
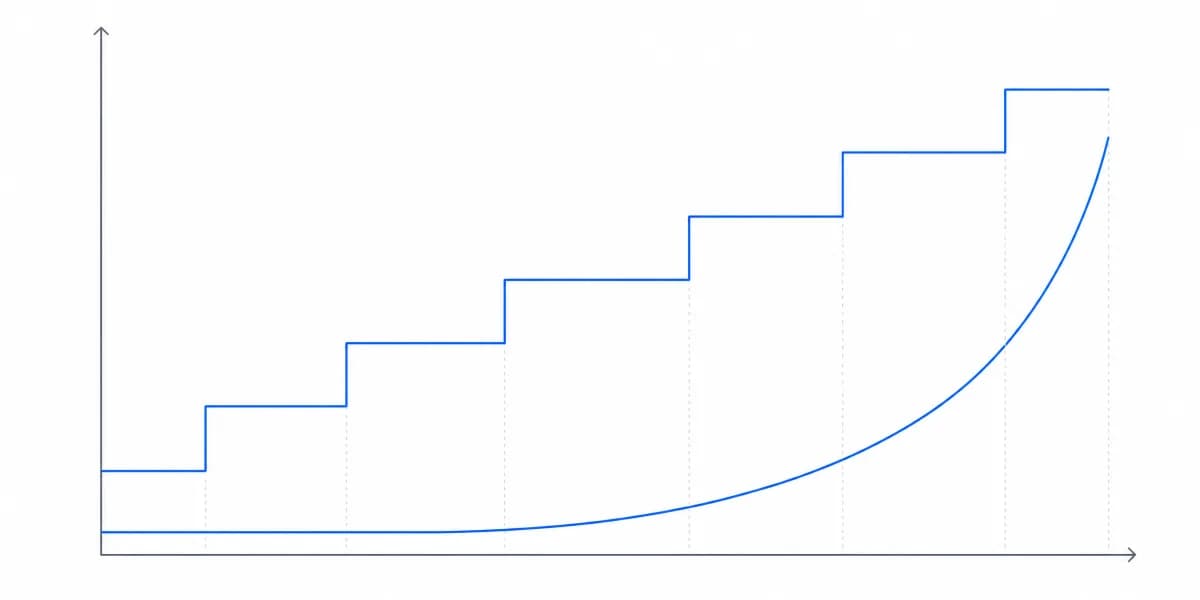
We've been in enough pricing conversations to recognize the pattern. A product manager reaches out, excited about adding analytics. Sales demos go well. Then comes the pricing discussion, and suddenly there's talk of "custom quotes," "contact our team," and "it depends on your usage."
The proof of concept may still leave important production questions unanswered: which viewers are billable, what happens at a limit, which plan contains required security features, and which services sit outside the subscription.
The embedded analytics market mixes public subscriptions with quote-based contracts. That makes a workload model more useful than a side-by-side comparison of starting prices.
Why Most Companies Get Blindsided by Embedded Analytics Costs
The common planning error is to treat a starting price as a production forecast. A team signs up for a demo, builds a proof of concept, and begins rollout before mapping the vendor's billing units to its own workload.
Then the bills start coming in:
- A viewer definition that includes more accounts than the forecast assumed
- A metered plan whose API, render, compute, or refresh unit was never load-tested
- White-labelling, SSO, or row-level security on a different tier
- Storage, data processing, or export volume outside the quoted allowance
The failure mode is a mismatch between the quoted assumptions and the live deployment. The question that prevents it is asked before signing: what does this bill look like at the expected workload, at ten times the audience, and during a peak month?
Five Pricing Models Are in Use, and One Contract May Combine Several
An embedded analytics contract may use one of these models or combine several of them.
| Pricing model | How you pay | Predictability | What decides your 3-year cost | Billing unit to verify |
|---|---|---|---|---|
| Per-user / per-viewer | Fee per billable viewer | Low when the audience grows | contracted rate × billable viewers × 36 | registered, active, or concurrent viewer |
| Capacity | Provisioned resources over time | Medium after load testing | capacity size × operating hours, plus scaling | node, instance, or capacity unit |
| Usage-based | Consumption during the billing period | Low before load testing | forecast units × rate, including overages | query, render, API call, compute, or data volume |
| Feature-tier | Subscription determined by required capabilities | Medium | required tier × 36, plus add-ons | plan, workspace, environment, or feature |
| Flat-rate | One fixed subscription fee | High when limits are explicit | subscription × 36, plus stated add-ons or services | plan allowance and upgrade threshold |
Per-Viewer Pricing Turns Audience Growth Into Software-Cost Growth
How it works: The contract defines a price per registered, active, concurrent, or monthly active viewer. Those definitions produce different totals, so write the definition into the model.
The gotcha: Audience growth becomes software-cost growth. A hypothetical $20 rate is $10,000 per month at 500 billable viewers and $200,000 at 10,000; replace that illustrative rate with the one in your order form.
Some analytics contracts use a viewer or seat component; do not infer it from the product category. Confirm the current billing unit directly in the quote.
The viewer count is a contract definition, not a headcount
- "Active users" vs "total users" definitions (are they counting everyone who logs in, or just active viewers?)
- Minimum seat requirements hidden in enterprise contracts
- Automatic upgrades when you hit user thresholds
Usage-Based Pricing Is Only Forecastable Once You Have Representative Load Data
How it works: You pay based on API calls, compute capacity, data processed, or rendering volume.
The gotcha: A forecast built without representative load data is fragile. Test normal, growth, and peak traffic, then confirm whether excess usage is throttled, billed as an overage, or moved to another tier.
Capacity and consumption billing appear in cloud services and analytics contracts, but the exact meter is vendor-specific.
Usage billing is only testable once you know what counts as one unit
- "What counts as an API call?" (dashboard load? every chart interaction? background refresh?)
- "What happens if we exceed our tier?" (throttling? auto-upgrade? overage charges?)
- "Can you show me a real customer's actual monthly bill variance over 12 months?"
Your Feature-Tier Price Is the Lowest Tier That Holds Every Production Requirement
How it works: Plans bundle different capabilities and limits. Your effective price is the lowest tier containing every production requirement, not the cheapest tier on the pricing page.
The gotcha: White-labelling, custom domains, SSO, or advanced security controls may sit on a higher tier. Build a requirements-to-tier map before accepting the quote.
Feature packaging differs by vendor and can change, so the current pricing page and order form are the evidence that matters.
Row-level security, SSO and branding are what push you up a tier
- "Which tier includes row-level security, SSO, and audit logs?"
- "Which branding and custom-domain controls are included in this plan?"
- "Which production requirements in our checklist require an add-on or upgrade?"
Flat-Rate Pricing Is Predictable When the Allowance and Renewal Terms Are Explicit
How it works: One monthly or annual subscription covers the stated plan allowance. Fixed price does not automatically mean every resource or feature is unlimited.
The advantage: It is predictable when the plan, limits, add-ons, renewal terms, and services are explicit.
The catch: A fixed subscription can still move when you need another plan, environment, service level, or resource allowance. Model those thresholds too.
Sumboard currently publishes fixed Growth and Business subscriptions, while Enterprise is quoted separately. Verify any vendor's current plan before using it in a forecast.
What a Headline Quote May Leave Out
The headline subscription is only one section of the commercial model. Put the surrounding terms into the same worksheet:
Hidden cost #1: Professional services Implementation, custom dashboard work, or training may be separately scoped. Ask whether each item is inside the quote or beside it, because the answer changes the first-year total.
Hidden cost #2: Support tiers Support channels, response targets, and dedicated contacts may vary by tier. Price the service level your production team actually needs.
Excluded cost #3: Data export or egress Export, migration, or egress may be included, metered, or separately scoped. Record the applicable unit and rate before treating portability as cost-free.
Hidden cost #4: Annual commitments An annual or multi-year quote may differ from the monthly option. Check the committed term, renewal notice, price-adjustment language, and what remains payable after cancellation.
Hidden cost #5: Who the meter actually counts A per-user rate says nothing until the definition of "user" is on the page, and that definition is where a customer-facing deployment diverges from an internal one. Metabase's pricing page states that "Both your internal team developing analytics and users of your embeds accessed through your product count as users", checked 7 August 2026. On that definition the meter follows your customer base rather than your headcount. Read it before comparing rates, because two vendors quoting an identical per-user figure can differ by orders of magnitude on the same deployment.
A headline quote keeps its line items hidden until you ask for a worked invoice
- "What's your month-to-month pricing vs annual?" (tests billing cadence and commitment)
- "Show a worked example invoice for our workload" (reveals the actual line items without requesting another customer's data)
- "What happens if we exceed our tier limits mid-month?" (throttling? auto-upgrade? overage?)
- "Can we self-serve all implementation or do we need your services team?" (integration complexity)
The Same Growth Curve Produces Very Different Bills, Depending on the Meter
The following example shows how different meters behave as an audience grows for a B2B SaaS company adding customer-facing analytics. It uses a deliberately hypothetical $20 viewer rate and Sumboard's currently published Business subscription; it is not a market benchmark. Replace both with current quotes before making a decision.
Scenario: Startup → Scale-up (Year 1 to Year 3)
- Year 1: 100 customers, 500 embedded viewers
- Year 2: 1,000 customers, 5,000 embedded viewers
- Year 3: 5,000 customers, 25,000 embedded viewers
Per-Viewer Model: the Same Rate Produces a Ten-Times Bill in Year Two
- Year 1: 500 viewers × $20 = $10,000/month = $120K/year
- Year 2: 5,000 viewers × $20 = $100,000/month = $1.2M/year
- Year 3: 25,000 viewers × $20 = $500,000/month = $6M/year
Across these three illustrative years, the arithmetic totals $7.32M. That number describes this scenario only; it is not a vendor quote.
Compare that result with an actual fixed-price quote and with an owned-cost estimate for building in-house. An internal build removes the vendor's viewer fee, but it does not remove engineering, infrastructure, security, support, or maintenance.
Capacity Model: It Cannot Be Totalled Without Your Own Workload Inputs
This model cannot be totalled without workload inputs. Size it against node or capacity requirements, operating hours, traffic shape, and overage rules. A provisioned resource may continue billing while idle, while a consumption meter moves with actual usage; the contract determines which behavior applies.
The three-year estimate must come from the required capacity, operating hours, scaling policy, and contract. Record the calculator date and assumptions so the estimate can be reproduced.
Feature-Tier Model: a Quote-Only Tier Cannot Be Estimated From a Public Starting Price
Map every production requirement to the current plan matrix, then use the lowest tier that satisfies the complete list. Public pages such as Metabase pricing can help document packaging on the date of review, but the signed order form remains authoritative. If a required tier is quote-only, the three-year estimate is the negotiated subscription plus add-ons and services; a public starting price cannot substitute for that quote.
Fixed Subscription: the Three-Year Total Is Arithmetic, Not a Forecast
- All years: €499/month = €5,988/year = €17,964 over 3 years
At the currently published €499 monthly price, the subscription arithmetic is €17,964 over 36 months, before any separately scoped services or future pricing changes. Record the date of the price used in the model.
The comparison shows why the billing unit belongs beside the feature checklist. A feature match with an unsuitable meter can still produce the wrong commercial result.
Two Real Vendors, Two Opposite Meters, Both Documented on Their Own Pages
The scenario above uses an illustrative rate. Two current vendor positions show that the choice of meter is not a detail, and both are checkable rather than characterised.
Metabase's pricing page states that "Both your internal team developing analytics and users of your embeds accessed through your product count as users" (checked 7 August 2026). On that meter, every customer who opens a dashboard inside your product is billable, so the bill tracks your customer base.
Microsoft documents the opposite arrangement for the equivalent scenario. In Power BI embedded analytics, the "embed for your customers" solution is compared against "embed for your organization", and the comparison states that in the customer-facing case "App users don't need a license", while in the organization case "Each app user needs a Power BI license" (checked 5 August 2026). The cost does not disappear, it moves: the same page states that "To embed in a production environment, you must use a capacity", and that free trial tokens are limited to development testing.
So one vendor bills per end user and the other bills for reserved capacity regardless of how many end users arrive. Neither is cheaper in general. The first is predictable when your customer count is stable and punishing when it is not; the second is indifferent to viewer growth and has to be sized and paid for before the growth appears. Which one fits is a fact about your growth curve, not about the vendors.
Multiply the contracted viewer rate by your high-growth audience and compare that result with both a fixed-price quote and an owned-cost model. The owned model must include engineering, infrastructure, security, accessibility, exports, incident response, maintenance, and any external implementation services. The crossover point is specific to your rates and staffing assumptions.
Nine Pricing Pages, Read on One Day: Two of Them Price the Thing You Are Buying
The question above, "which prices are public", is usually left as an exercise for the reader. It is answerable, so here is the answer, with the method attached so you can repeat it.
On 19 August 2026 we opened the pricing page of nine embedded analytics vendors and asked one question of each: does this page publish a currency figure you can put in a forecast before you speak to anyone? Not whether a pricing page exists. Nine of them exist. Whether it yields a number.
Three pages publish a figure and two of them price the tier you would actually buy. Metabase publishes the most complete one: Pro at $575 per month plus $12 per user with the first ten included, which is the tier where embedding starts, and Enterprise from $20,000 per year. Luzmo publishes floors rather than totals, Starter from EUR 995 per month and Premium from EUR 2,495 per month, both billed annually, with Enterprise custom. Its Starter tier does carry embedding: the page describes "embedded, white-labeled analytics" with full API and SDK access at that level, and reserves self-service dashboard building, not embedding, for the higher plans.
ThoughtSpot is the interesting one, because it publishes prices and still does not answer the question. Its analytics plans are priced per user, $25 for Essentials and $50 for Pro, and its embedded plans are not: the Developer plan is free for a year and the embedded Enterprise plan is quote-only. A per-user analytics price tells you nothing about what a customer-facing deployment costs, which is why the count that matters here is two rather than three.
Six pages carry no price for a plan you could buy, and they are not all the same case. Looker answers "call sales" on standard, enterprise and embed alike. It is not that the page is empty of numbers: it publishes conversational-analytics token overage rates, $3.00 per million input tokens and $20.00 per million output tokens from 1 October 2026. Those are real published prices for something you are not buying, which is a different failure from silence and worth separating from it. Power BI Embedded does something more particular: it publishes a full A1 to A8 capacity table with virtual cores and memory for every node, and a dash in every price cell, under a line stating the prices are estimates rather than quotes. Qrvey, Sisense and Embeddable answer with a quote request. Sigma is a fourth case again: its page carries no pricing tiers at all, so there is nothing to request a quote against from the page.
Three vendors are missing from that count and it is worth saying why rather than quietly listing nine. Tableau, Domo and Explo returned 403, 405 and 404 to the same request. A page that would not load is not evidence about what it publishes, so they are absent rather than assumed.
What this changes about how you run the evaluation
If two of nine pages price the thing you are buying, then the comparison spreadsheet cannot be built from public pages alone, and any article that hands you a full one has filled most of its cells from somewhere other than the vendors' public pricing pages. That source may be a quote the writer obtained, which is legitimate and worth more than a public page; it may also be an older article. The distinction matters to you, so the cells should say which. That is the practical reason this page models a workload instead of listing starting prices: for six of these vendors there is no starting price to list.
It also sets the order of the evaluation. Four of these six pages name the conversation as the route and nothing else: Qrvey asks you to request pricing, Sisense says talk to us, Embeddable says speak to us to get a custom quote, and Looker answers call sales on every edition including embed. Start those conversations at the beginning of the evaluation rather than after the shortlist, because for those four the page itself will not give you a number to work from. Power BI is not in that group: Azure's own pricing calculator returns a figure without a sales conversation once you know which node you need. Send every vendor the same workload description, the same billable-viewer definition, and the same three cases from the scenario above, and the returned quotes become comparable in a way the pricing pages never were.
One more thing follows from the Power BI row. A capacity table with named nodes and empty price cells is not the same as a quote-only page, and the difference is in your favour: the sizing is public even when the price is not, so you can size the node your workload needs and ask for the price of exactly that node. Where a vendor publishes the shape of the meter but not the rate, price the shape first.
The dates matter here more than usual. Every figure above was read on 19 August 2026 and vendor pricing moves; recheck the page before you commit anything to a forecast, and record the date next to the number the way this section does.
How Sumboard's Pricing Actually Works
Sumboard publishes Growth and Business subscription prices, while Enterprise work is scoped separately.
Sumboard Publishes Two Tiers, Both With Unlimited Embedded Viewers
- Growth: €199/month - For early-stage and scaling SaaS companies
- Unlimited embedded viewers (zero per-user fees)
- White-label dashboards, exports, and multi-tenant support
- Standard support
- Up to 10 embedded dashboards and the published plan allowances
- Business: €499/month - For established SaaS companies
- Everything in Growth
- Custom PDF layout builder
- Dashboard localization
- Priority support
- Enterprise: Custom pricing - For complex requirements
- Custom data pipelines
- Custom-built data warehouse
- Custom onboarding and dedicated support
What Growth and Business Currently Share, So the Tier Choice Is Not About Features
- Unlimited embedded viewers (zero per-user fees)
- White-label dashboards and PDF exports
- Multi-tenant architecture support
- PDF and XLSX export
- Unlimited data sources and caching under the published plan description
For a forecast, pair those published subscriptions with the plan allowances and any separately scoped Enterprise work. Recheck the pricing page at purchase and renewal rather than treating this article as an order form.
The practical advantage is auditability: the public Growth and Business prices can be entered into a forecast before a sales conversation. Enterprise requirements still need a scoped quote.
The embedded analytics alternatives guide compares the platforms side by side.
Three Question Sets That Expose a Pricing Model Before You Sign It
When you're evaluating embedded analytics pricing, forget the feature checklist for a minute. Ask these questions first:
Budget planning starts with which prices are public and which need a quote
- "Which prices are public, and which require a written quote?" (identifies the evidence available for the forecast)
- "What will I pay in month 1, month 12, and month 36 as we scale?" (get specific growth projections)
- "Are there any fees beyond the base price?" (support, services, overages, add-ons)
Scaling economics turn on which boundary moves you to the next tier
- "Which workload boundary moves us to another tier, capacity, or overage rate?"
- "Can you price our base, growth, and peak cases with the same billable-user definition?"
- "What happens if we grow faster than expected?" (tests thresholds and overage behavior)
Exit terms are written before you join, and they decide what leaving costs
- "What's your cancellation policy?" (30 days? End of annual contract? Penalties?)
- "Can we export all our data if we leave?" (vendor lock-in check)
- "Are there any termination fees?" (some enterprise contracts have these)
The decision record should distinguish what is published, what is stated in a written quote, and what becomes binding only in the order form. A custom quote is not inherently opaque, but its assumptions must be itemized before different offers can be compared.
Where to go next
- Embedded analytics guide: the three routes to shipping it, what each one costs in calendar time, and the four things that set your launch date.
- Embedded Analytics Benefits: from 10-minute integrations to new revenue streams.
- Embedded Analytics articles: every article in this cluster.
Ready for transparent embedded analytics pricing?
Sumboard offers clear, predictable pricing with zero per-user fees. See exactly what you'll pay before talking to sales.


