Your customers answer their own questions inside your product, without a support ticket and without your team building another report. You decide what data they can reach and where every number comes from.
What they can do
They build and customise their own dashboards
They ask a question in plain language and get a chart back. They save the charts they need to a dashboard of their own, in your product's design.
Coming soonRestyling their dashboards with AI chat.
What they can doComing soon
They connect their own AI tools
An MCP connector for your customers' users. They query their data from the AI assistant they already work in.
What keeps it safe
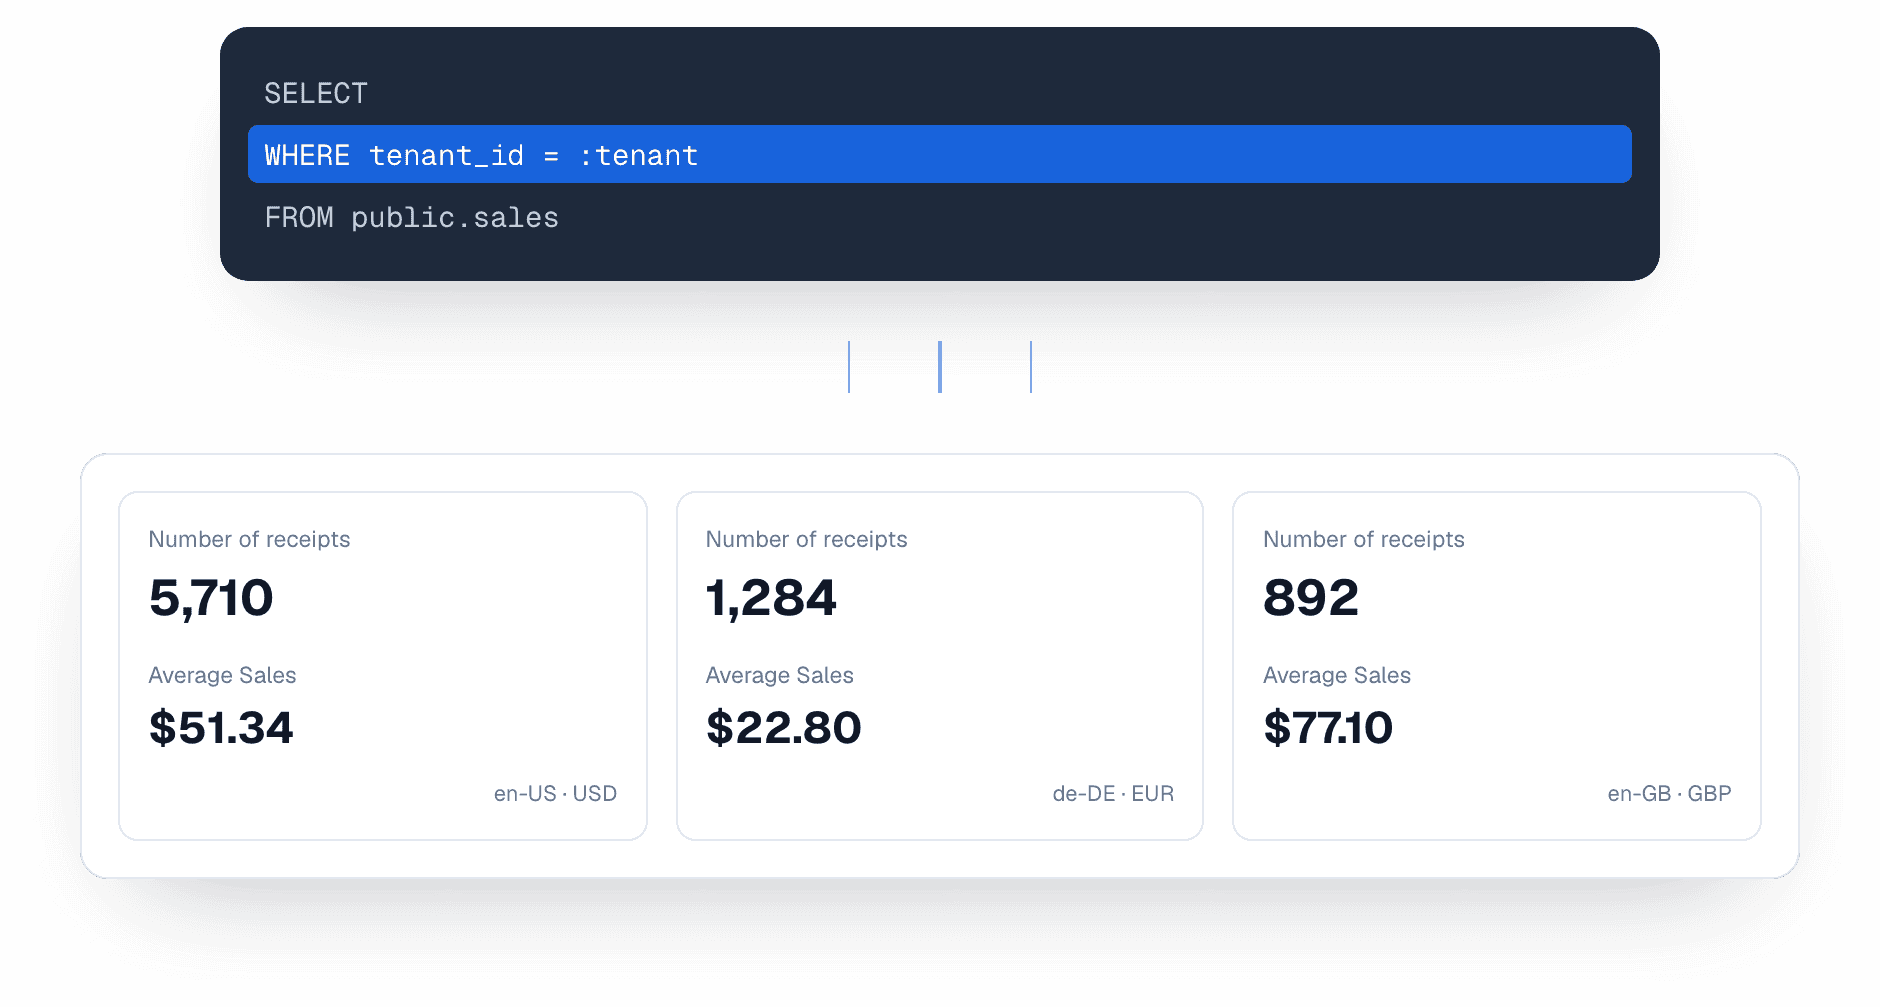
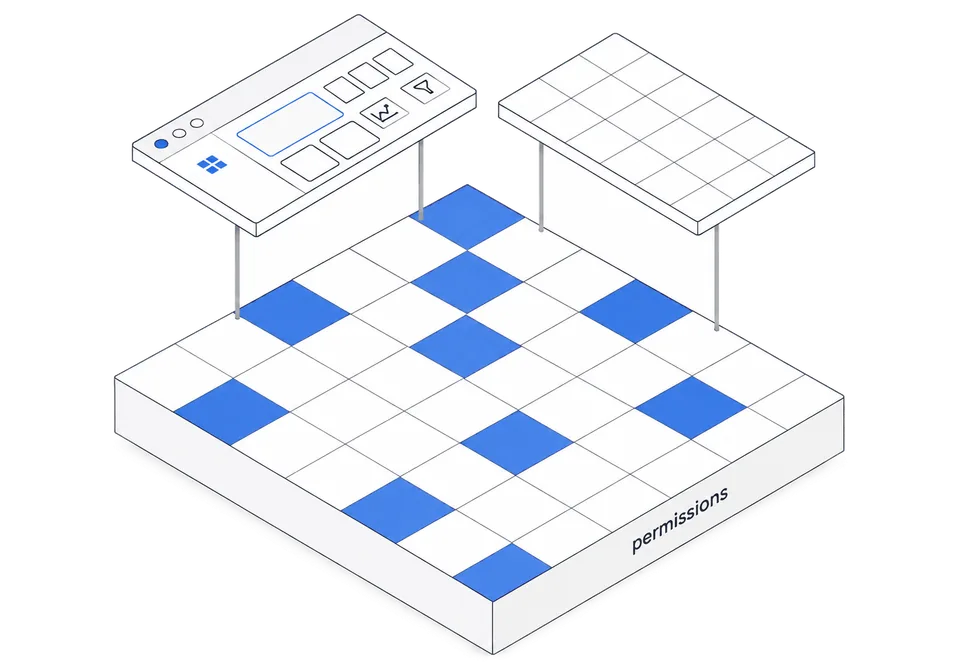
They see only the data they are allowed to see
Every query is scoped to the signed-in customer on the server. The same rule applies in dashboards, in Ask and through MCP.
What keeps it safe
They never get a wrong number
The AI answers only from queries you approved. Your customers never see a query and never write one.
Switch between the workspace where your team builds and the branded dashboard your customer sees.
View perspective
BuilderCustomer
01Create data insights
02Customize with your brand
03Embed in your app
Loading interactive demo…
Query library
Write a metric once, use it in every dashboard
Save a query in the Query library and reuse it in any chart, on any dashboard, for any customer. When the definition changes, you publish a new version and choose where it applies.
Folders, drafts and versions for every query
Charts pick a reusable query instead of carrying their own SQL
The AI your customers use reads the same queries
Query library · Operations
On-time deliveryv1
key: on_time_delivery
SELECT
  COUNT(*) FILTER (WHERE delivered_at <= promised_at)
    * 100.0 / COUNT(*) AS "on_time_pct"
FROM shipments
WHERE customer_id = customer
  AND delivered_at = time_range
KPI tile
94.2%
Trend chart
94.2%
AI chat
94.2%
One query, “On-time delivery”, behind the KPI tile, the trend chart and the AI chat.
AI in the editor
Edit dashboards by chatting with AI
Tell the AI what you want and the dashboard changes in front of you: your brand colours and font, a different chart type, a new filter, a click-through to the detail.
Save the result as your workspace design, and everything your customers build starts in that look.
Dashboard editor · Fleet Performance
AI chat
Use our brand colours and font. Make the trend an area chart. Add a filter by lane.
Done. I applied your brand, changed the trend to an area chart and added a Lane filter.
On-time deliveryLane: All ▾
94.2%
Queries and dashboards as codeComing soon
Analytics that behaves like software
Export your queries and dashboards as YAML files and keep them in your own Git repository. Review changes as diffs, keep the full history, and roll back when you need to.
Your analytics is plain SQL and YAML that you own, so you are never locked in.
queries/on-time-delivery.yaml
name: On-time delivery
key: on_time_delivery
-version: 1
+version: 2
description: Share of shipments delivered on time
sql: |
SELECT ... FROM shipments
WHERE customer_id = {{customer}}
+ AND status <> 'cancelled'
on-time-delivery v2: exclude cancelled shipments
MCP connector for your teamComing soon
Use Sumboard from your own AI tools
Connect your AI assistant or coding tool to Sumboard through MCP. Your team builds and updates queries and dashboards from the tool they already work in, with the same permissions they have in Sumboard.
Your AI assistant
Add a chart of late shipments by carrier to Fleet Performance.
Sumboard · MCP connector
Added “Late shipments by carrier” to Fleet Performance, using the reusable query “Late shipments”.
Deployment
On-premise or in the cloud
Run Sumboard in our cloud and start the same day. Or install it on your own infrastructure, so your data never leaves your network and you control access, updates and where everything is stored.
No. Queries run live on your source. Results are kept only if you turn on caching.
No. Queries run live on your source. Results are kept only if you turn on caching.
Good for
Getting live fast
Regulated industries and strict data-residency rules
Case studies
Results from our customers
See how companies like yours shipped customer-facing analytics in weeks, not months, and transformed their product experience.
POS terminal solutions
How Cashpad gave their customers powerful business insights
By embedding Sumboard dashboards into their web BackOffice, Cashpad now delivers real-time analytics and sales insights to help their 2000+ European customers make better business decisions.
Key results
✓Shipped customer analytics 10x faster than building in-house
✓Enhanced product demos with professional analytics
✓Enhanced product value with reporting for customers
“Analytics is the first thing we are showing to our customers during the demo sessions of our product. Now it looks so much better than before, and works faster.”
NicolasCTO at Cashpad
Smart mobility
How Orbility delivered analytics to airports and cities worldwide
They integrated Sumboard across their product line, giving airports and smart cities direct access to mobility insights.
Key results
✓Embedded customer analytics 10x faster than in-house development
✓Increased customer engagement with reporting capabilities
✓Enhanced product stickiness with native analytics experience
“Sumboard exceeded our expectations with its performance and ease of integration. We’ve now embedded it into our product line, enabling our customers to access reports through a cloud portal.”
GeorgeCTO and CPO at Orbility
How it works
Live in your product in 4 steps
From your database to dashboards your customers build themselves, in days, not months.
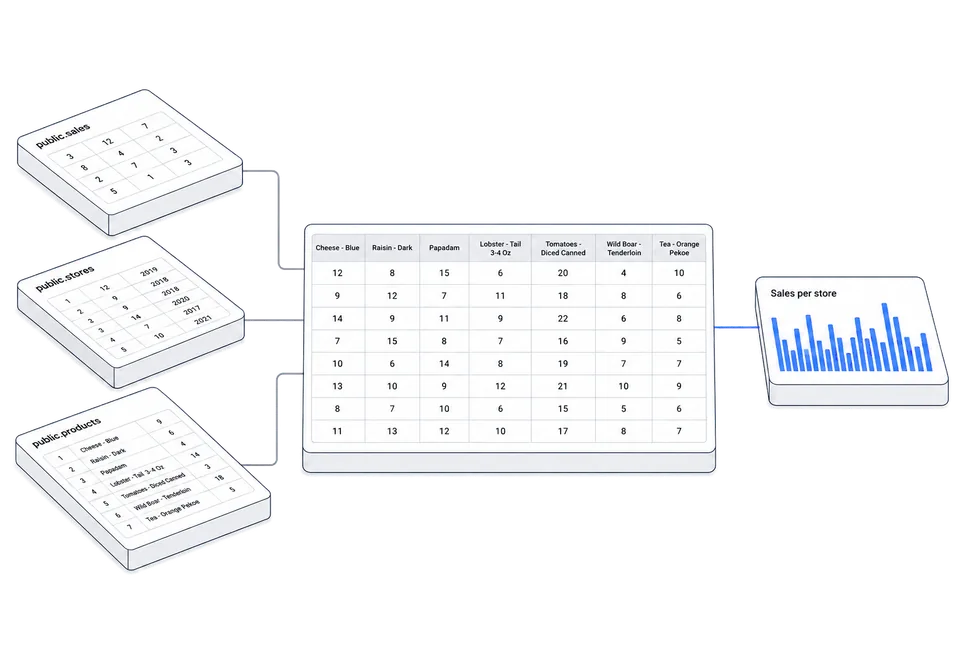
Your databases stay where they are. Sumboard connects to PostgreSQL, MySQL, MS SQL Server, MariaDB, MongoDB or a REST API, and reads at query time.
Several data sources on one dashboard
A read-only database user, over SSL or SSH
No second copy of your data
Also included
What else your customers get with every dashboard
Reports, schedules and translations come with every embedded dashboard, in your brand.
Custom PDF builder
Design PDF reports with your logo, layout and colours. Your customers download them or get them by email.
Translate and localize
Each customer sees dashboards in their own language and time zone.
Email schedules
Your customers set up their own daily, weekly or monthly reports by email, as PDF or Excel.
Compare over period
Any chart can show this period next to the previous one, so your customers see what changed.
For your developers
How Sumboard fits into your stack
One embed serves all your customers. Your data stays in your own databases.
Signed-token embed
Your server signs a token for each user. The token decides which customer's data every query returns.
Any tech stack
The SDK installs from npm into your own web application.
Your existing databases
PostgreSQL, MySQL, MS SQL Server, MariaDB, MongoDB and REST APIs.
Read-only database connection
Sumboard reads from your source with a read-only user and keeps no second copy of your data.
Caching you control
Turn on caching for speed and set the timeout. Cached results are removed when it expires.
Draft and publish
Change a dashboard in draft and publish when it is ready. Your customers see only the published version.
If your data is not ready for analytics, our engineers get it there: warehouse migration, pipeline rebuilds and data modelling. Each project is scoped and priced on its own.



 Nicolas CTO at Cashpad