
Finance analytics inside your product.
Reconciled financial summaries, per customer.
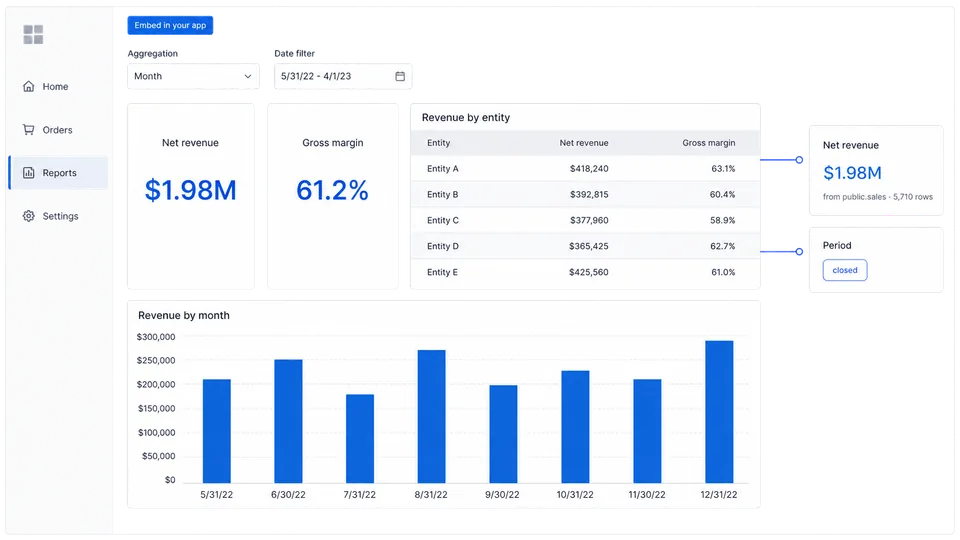
Experience Sumboard
Builder view and customer view.
Switch between the workspace where your team builds and the branded dashboard your customer sees.
- 01Create data insights
- 02Customize with your brand
- 03Embed in your app
What goes wrong in Finance dashboards.
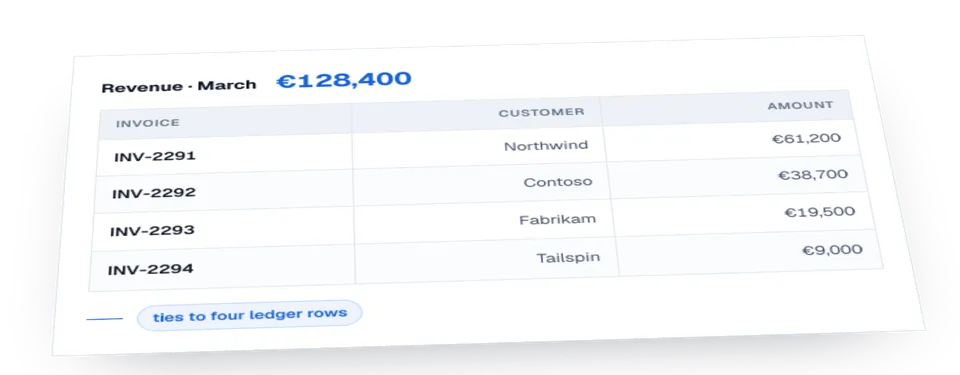
A financial dashboard is a summary of the ledger, and every figure on it has to trace back to ledger rows.
A summary is defensible only if every figure on it traces to the rows that produced it. When the ledger is restated and the summary is not, the two disagree.
Permission resolution at query time.
Entity and cost-centre boundaries decide access, and they are stricter than most verticals because a consolidated figure can leak a subsidiary's position. The dashboard has to permit a total without permitting the rows that make it.
One metric definition, shared across teams.
Net revenue
Recognised revenue after refunds and credits for a stated period. The basis, cash or accrual, is stated with the figure.
Gross margin
Revenue less cost of sales, as a share of revenue. Which costs sit above the line is a policy choice, and the dashboard states it.
Days sales outstanding
Average days from invoice to payment. Sensitive to a small number of large invoices, so it is read next to its distribution rather than on its own.
Cash conversion
Operating cash against operating profit for a period. Shown as a pair, since either figure alone can look healthy while the two together do not.
Three failure modes in production.
The summary cannot be traced to the ledger
When a dashboard total and the accounting system disagree, a stated source and row count on the figure show where they diverged.
Open periods presented as closed
Numbers from an unclosed period are provisional by definition. Open and closed periods are rendered differently.
Currency converted at read time
Converting at display time means the same report run twice gives two totals. The rate and its date belong in the model, where they can be stated and audited.
How fresh the numbers need to be.
A financial summary is read against a close calendar, not a clock. What matters is that the dashboard says which period is closed and which is still open, because a figure from an open period will change.
Further reading for Finance engineering teams.
Financial Dashboards: The Summary, Not the Ledger
A financial dashboard is the summary; the accounting system keeps the ledger. Which finance metrics earn a tile, and why a reader with nobody to ask changes the architecture for FinTech products.
Revenue Dashboard Metrics: Definitions, Reconciliation, and Release
Build a revenue dashboard that separates subscription metrics, recognized revenue, and cash, then reconciles each number to its source and policy.
Financial KPI Tracking: From Events to Reconciled Dashboards
Design customer-facing financial metrics across subscription activity, accounting policy, cash timing, tenant scope, close, and reconciliation.
Frequently asked questions.
Can the dashboard be reconciled to our ledger?
Yes. Figures carry their source and row count so the summary can be traced to the ledger.
How do you show that a period is still open?
The period's state is data the dashboard reads, so open figures are marked as open rather than presented as final.
Can a group see a consolidated total without subsidiary detail?
Yes. The aggregate is permitted where the rows are not, so the total is assembled and the underlying rows are never returned.
Which exchange rate is used?
The rate your model specifies, applied in the model. Conversion at display time would give the same report different totals on different days.