
Operations and Supply Chain analytics inside your product.
Plant, fleet and supply-chain reporting, with per-number freshness.
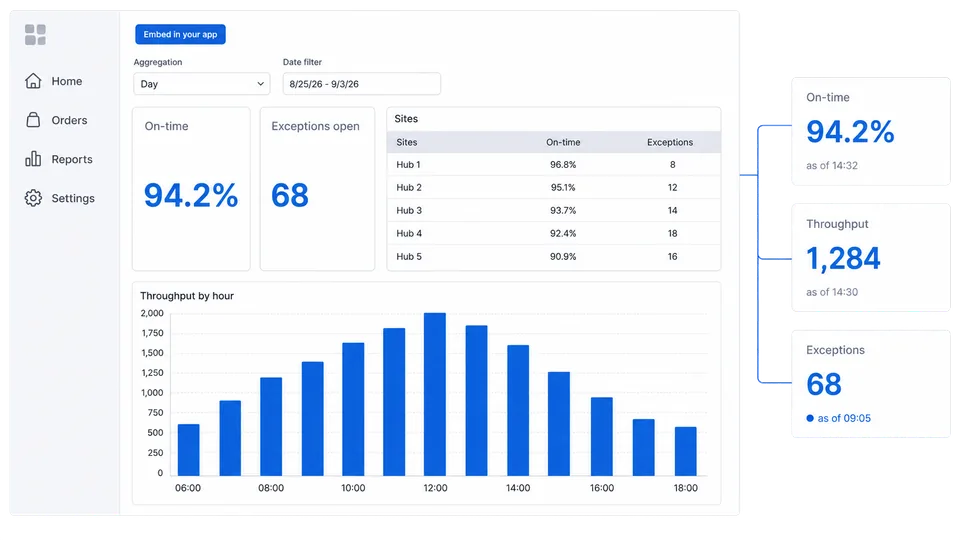
Experience Sumboard
Builder view and customer view.
Switch between the workspace where your team builds and the branded dashboard your customer sees.
- 01Create data insights
- 02Customize with your brand
- 03Embed in your app
What goes wrong in Operations and Supply Chain dashboards.
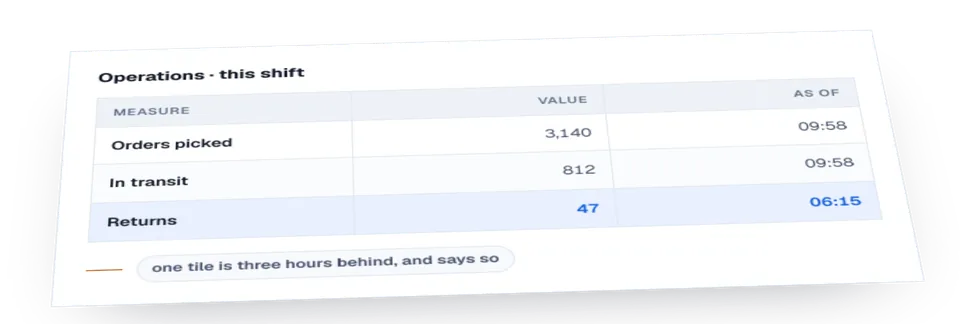
Operational data arrives late and out of order, so each number shows how stale it is.
Operational events arrive late and out of order, so a figure read now is not yet settled. Each number carries its own freshness.
Permission resolution at query time.
A site sees itself, a network operator sees its sites, and a supplier sees only the lines it is party to. In supply-chain data two parties can share a row and see different columns of it.
One metric definition, shared across teams.
On-time delivery
Deliveries inside the promised window as a share of the total. The dashboard states whether the original or the revised promise counts.
Throughput
Units completed per period at a stated stage. Shown per stage, since a line can be fast at one point and blocked at the next.
Cycle time
Elapsed time from start to completion for a stated process. Median rather than mean, since a few stalled jobs distort an average.
Exceptions open
Issues raised and not yet resolved at a point in time. Shown with age, not count alone.
Three failure modes in production.
Late data presented as live
A dashboard that refreshes on a timer looks live whether or not new data arrived.
Out-of-order events reordered by arrival
Events that land late must be placed by when they occurred, not when they were received. Ordering by arrival changes yesterday's totals after the fact.
One freshness figure for many sources
A network dashboard blends feeds that update at different rates. A single 'last updated' stamp is accurate for one source only.
How fresh the numbers need to be.
Operational data arrives late and out of order: a scan from a depot can land hours after a later event. Staleness is displayed per number.
Further reading for Operations and Supply Chain engineering teams.
Supply Chain Dashboards: What General Dashboards Miss
Build powerful supply chain dashboards with real-time visibility into logistics, inventory, and operations. Track KPIs, optimize costs, and improve delivery performance.
Manufacturing Dashboards: The Data Is Late, in Four Shapes
A plant already has the data; it arrives too late and in four shapes. OEE and the KPIs worth a tile, and why the business case is not faster reporting.
Tactical Dashboards: Bridging Strategy and Operations
Not every business goal fits neatly into 'strategic long-term' or 'operational real-time.' Here's how tactical dashboards track the middle layer.
Production Analytics for Manufacturing Customers
Manufacturing customers now expect interactive production analytics rather than CSV exports. How B2B SaaS companies deliver real-time visibility without a twelve-month build.
Logistics Dashboards: From Shipment Events to Owned Exceptions
Build logistics dashboards from governed shipment milestones, explicit SLA clocks, correction-aware metrics, and an owned exception response.
Supply Chain KPI Dashboards: Metrics With Evidence and Owners
Build supply-chain dashboards from governed order, shipment, inventory, supplier, and cost contracts instead of borrowed thresholds.
Manufacturing KPI Dashboard: From Plant Events to Owned Action
Define manufacturing metrics from eligible events, reconcile their sources, apply tenant and role scope, and connect every signal to an owner.
Chart.js Tutorial: Production-Ready Customer Dashboards
Chart.js renders to canvas, and that one decision drives everything after it: responsive containers, lifecycle cleanup, accessibility, and what performance you can actually measure.
Embedded Analytics Best Practices: Production Framework
Turn one customer task into a production-shaped slice with trust, runtime, accessibility, operating, and rollout evidence.
Operational Dashboards: From Signal to Response
An operational dashboard should turn a current signal into owned, authorized, and verifiable work, not merely refresh a wall of KPIs.
How to Build Customer-Facing Analytics: A Production Slice
Build customer-facing analytics across task, semantics, identity, runtime states, artifacts, operations, commercial terms, and rollback.
Frequently asked questions.
How do you show that a number is stale?
Each figure can carry its own as-of stamp rather than one page-level timestamp.
What happens when data arrives out of order?
Your model places it by event time, so a late scan lands in the period it belongs to.
Can a supplier see the lines they are party to and nothing else?
Yes, including at column level, through the token filter and your query's column selection.
Does this work if our data lands hourly rather than in real time?
Yes. The dashboard states its own freshness; the pipeline does not need to be instant.