Customer-facing analytics means giving your users dashboards over their own data, inside your product. The decision is usually mis-timed rather than mis-made: too early, and you are solving a problem your customers do not have; too late, and you are matching competitors instead of leading. The demand signal is almost never a request, because customers work around missing reporting rather than asking for it. Once you have decided, the three routes differ less in how long they take than in what you are left owning afterwards. And the two mistakes that get expensive fastest are both architectural: leaving multi-tenancy until later, and designing from the data you have rather than the decisions your customers make.
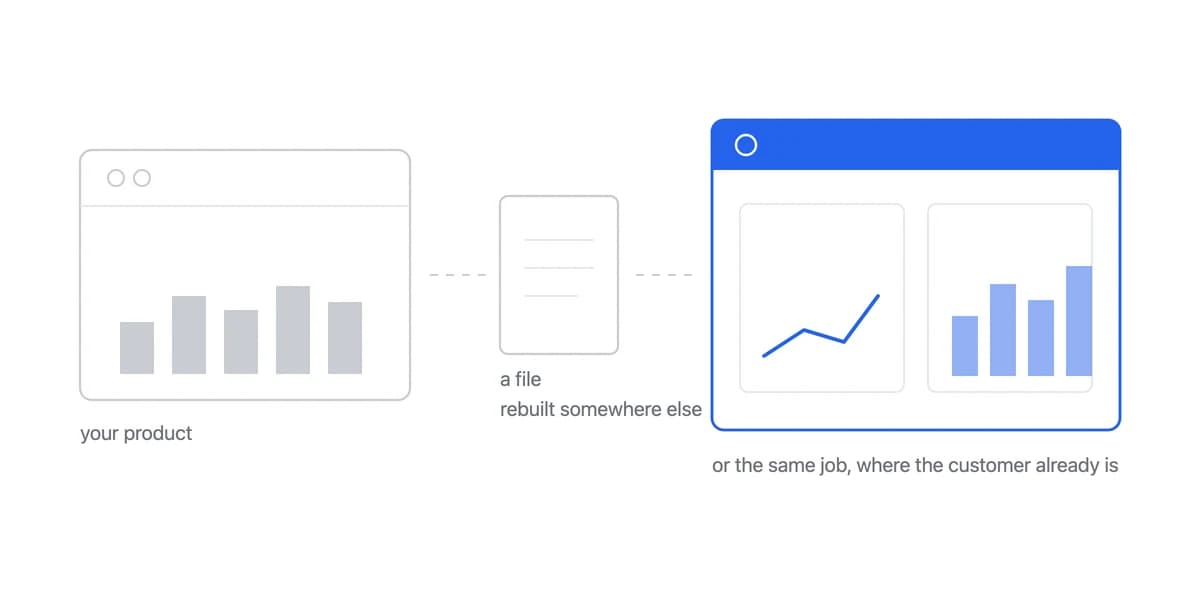
Most SaaS products collect a great deal of data and give customers almost no way to look at it. The customer exports a CSV and rebuilds the report in a spreadsheet, or asks your support team for a data pull, or quietly pipes your data into a BI tool you never hear about. None of that arrives on your roadmap as a feature request, which is why the demand is so easy to miss.
This guide covers how to read that demand, when the investment makes sense and when it does not, what each of the three implementation routes actually leaves you owning, and the mistakes that are cheap to fix early and expensive to fix late. It is written for product teams at B2B SaaS companies, and it assumes you would rather be honest about the trade-offs than be sold to.
Customer-facing analytics puts the reporting inside your product, where the work already happens
Customer-facing analytics means giving your users dashboards and reports inside your product, over their own data. It is distinct from internal analytics, which helps you run your business. This is about helping your customers run theirs.
The distinction matters more than it sounds, because it changes who the interface is for. Internal analytics can assume a colleague who will learn the tool, ask someone when they are stuck, and tolerate a rough edge. Customer-facing analytics cannot assume any of that. The person using it did not choose the tool, will not be trained on it, and will judge your whole product by it.
A purpose-built customer-facing analytics platform closes that gap, built on solid architecture of the kind compared across the embedded analytics alternatives. Some real shapes it takes, from products we have worked with:
- Restaurant POS: chain managers comparing sales across locations, identifying peak hours, tracking inventory turnover
- Parking management: operations teams monitoring occupancy rates, revenue per space, maintenance schedules
- E-commerce platforms: store owners analyzing customer behaviour, product performance, seasonal trends
- Marketing tools: campaign managers tracking ROI, audience engagement, conversion funnels
The demand signal is never a request
The most common way this decision goes wrong is that somebody asks customers whether they want analytics, hears a lukewarm answer, and shelves it.
That survey was always going to under-report. A customer who needs reporting and does not have it does not sit in the gap waiting to be asked about it. They build a workaround, and once the workaround exists the gap stops feeling like a missing feature. It feels like Tuesday. So the reliable signals are behavioural rather than stated, and every one of them is somebody routing around your product.
What this changes in practice is where you look. Instead of surveying, read your own exhaust: how often the export endpoint is hit and by whom, how many support tickets are really data pulls, which accounts mention a BI tool in onboarding calls, and what churned customers said on the way out. Ask customer success what they get asked for most; they will usually answer in one sentence.
There is one more signal worth naming, because it is the only one that shows up as a request: feature requests phrased as insights, visibility or dashboards. Customers who do not have the word for what they want reach for the outcome instead.
Several of these being true means the timing is right rather than early
If several of these are true, the timing is probably right rather than early:
- Customers regularly ask for reporting features or data exports
- Support spends meaningful time producing manual reports
- Analytics comes up in deals you lose, or in competitor comparisons
- Customer success lacks visibility into how accounts actually use the product
- Product is seriously considering building analytics in-house
- You are looking for something that justifies a higher tier
- You need something that raises switching cost and reduces churn
- You want to ship a customer-visible capability without a multi-quarter build
Customer-facing analytics will not fix a product people are leaving for other reasons
It is worth being direct about this, because the honest cases are specific rather than vague. Skip customer-facing analytics if your customers do not make data-driven decisions in the first place, if your product generates too little data to say anything interesting, or if you are still finding product-market fit.
That last one is the one teams argue with, so it is worth stating plainly: analytics can help with retention and expansion, but it will not fix a product people are leaving for other reasons. If churn is driven by missing core functionality, analytics is a distraction with a long lead time.
Three questions decide it, and only the third one is hard
1. Do our customers actually want this? Answered from behaviour, per the section above. Validate it by surveying active customers, asking customer success what gets requested most, checking whether competitors ship it, reading churn exit feedback, and testing a mockup before anything is built.
2. Do we have six or more months to build it ourselves? You probably do if analytics is a genuine differentiator for you, you have two or three senior developers available for the long haul, there is no urgent competitive pressure, and you need something specific enough that no platform covers it. You probably do not if customers are asking now, engineering is committed to core product, competitors already ship it, or standard dashboards and reports would be fine.
3. Is this a priority against core product? This is the hard one, and it is a strategy question rather than a resourcing question. Analytics is high priority when the core product is stable and adopted, when you are focused on expansion and retention, when customer data is central to their daily workflow, when it could support a higher price, or when you are losing deals over it. Core features win when you are still finding fit, when there are real gaps against competitors, when churn traces to missing functionality, or when growth is coming from new features.
If the answers run yes, no, yes, then this is worth doing now.
Customer-facing analytics and traditional BI differ by audience, and that explains the rest
Both are built on similar technology and they are aimed at different people, which turns out to explain almost every other difference between them.
| Customer-facing analytics | Traditional BI | |
|---|---|---|
| Audience | End users and customers | Internal teams and analysts |
| Interface | Simple, minimal training | Complex, assumes data literacy |
| Data access | Personalised per user or tenant | Shared organisational views |
| Integration | Embedded in your product | Standalone application |
| Skills required | Minimal, non-technical users | SQL and data modelling |
| Personalisation | Per user, via multi-tenancy | Role-based views |
Traditional BI tools can be embedded for customer-facing use, and teams do it. What they run into is consistent: per-user pricing that does not scale when the users are your customers rather than your staff, interfaces designed for analysts that confuse end users, multi-tenancy that requires substantial configuration to isolate data properly, and branding that gets close to yours without arriving. For how the individual vendors differ on this, our BI tools comparison works through the field.
Several enterprise BI vendors publish seat prices but not the rate that applies to embedding. Google publishes no Looker licence price at all, and Microsoft lists Power BI Embedded and Fabric capacity as variable with a link to sales. Any per-embedded-viewer figure you find circulating is somebody else's negotiated contract rather than a rate you can plan against, so compare the meters rather than the numbers.
Core features, and what each one is really for
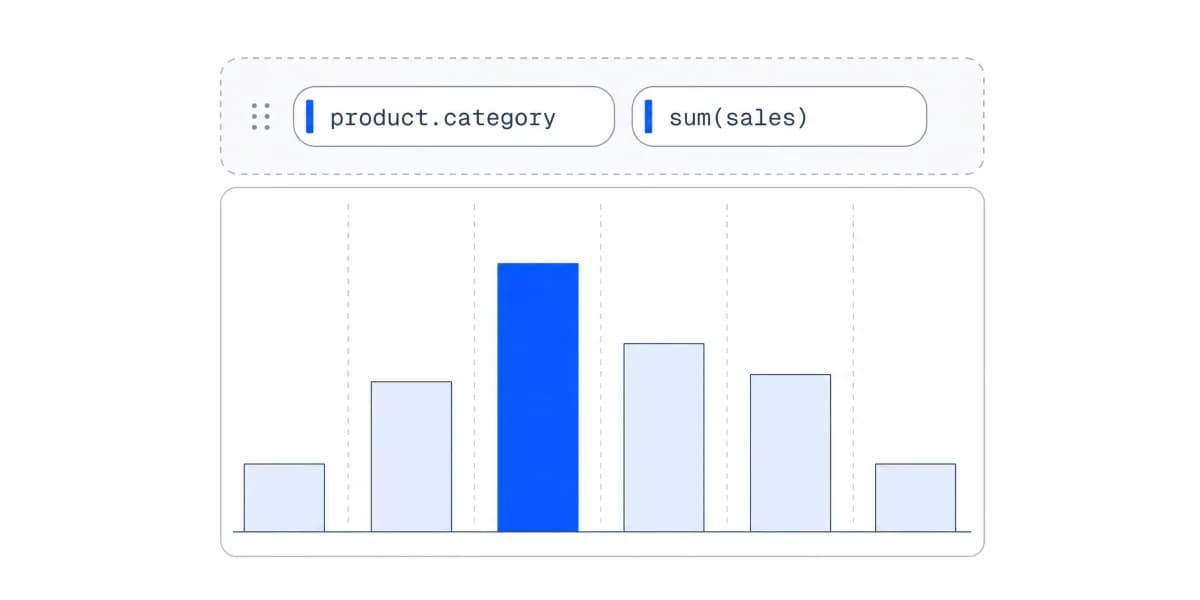
Interactive dashboards. Filtering by date range, category or custom dimension; drilling into a metric; clicking a data point to see what is under it; exporting a view for a report. The point of interactivity is not richness, it is that a static report answers one question and a customer arrives with a different one.
True real-time depends on your data pipelines rather than on the analytics layer. Most platforms deliver near real-time, with latency from seconds to minutes. Sub-second updates require real architectural investment, and for most B2B SaaS the honest word is near-instant.
Self-service report building. Users choose their own metrics, pick a visualisation, apply filters, and save a view they can come back to. The business case is that it removes a class of support ticket entirely, and the risk is that it becomes a way to ship complexity instead of decisions.
White-label customization. Brand colours, fonts and design elements; custom CSS where you need finer control; no third-party branding; UI patterns that match the rest of your application. The test is not whether it is customisable but whether a customer would guess it was bought. There is more depth on this in the white-label analytics guide.
Multi-tenant architecture. Each customer sees only their own data, with controls at tenant, user and data level, and performance that holds up with many concurrent users.
Multi-tenant architecture gives you the technical foundation for compliance. Meeting SOC 2 or GDPR depends on organisational practice well beyond the technical layer, so treat the architecture as necessary rather than sufficient.
Good Customer-Facing UX Is Mostly the Handling of States Where There Is No Chart
Dashboard design advice is abundant and it is nearly all written for internal dashboards. Most of it transfers. One thing does not, and it is the thing that decides whether your analytics feature generates support tickets or absorbs them.
An internal user who opens a dashboard and sees nothing asks someone. There is a data team, a channel, a person who built it. Your customer has none of that. When they see nothing, they have exactly two moves: file a ticket, or conclude that this part of your product does not work.
That asymmetry is the whole difference, and it lands hardest on the states where there is no chart to look at.
An empty panel can mean the query is still running, the filter matched no rows, the account has no data yet, or the viewer is not allowed to see it. Four different situations, four different next actions, and by default all four look the same. Every one of them arrives at your support queue as the same sentence: the dashboard is blank.
Handling them is not visual polish. It is the difference between a customer who clears a filter and a customer who writes to you.
- Still loading needs a skeleton that reads as a number on its way, not an empty frame. A spinner in the middle of an otherwise empty panel stops reading as progress and starts reading as failure, and where that turn happens is worth watching in your own session recordings rather than taking from a rule of thumb.
- Filter matched no rows needs to name the filter and offer to clear it. This is the cheapest of the four to fix, because the dashboard already knows which filter is applied.
- No data yet needs to say what has to happen first. A new account looking at an empty chart is looking at your onboarding, not at your analytics.
- Not permitted needs to say who to ask, and it must not reveal whether the data exists. "No results for this account" and "you cannot see this account" are different sentences, and the second one leaks the existence of the first.
The other half is that your customer never had an onboarding session
Internal analytics is taught. Someone walks the team through the board, explains what the metric means, and is available afterwards. Customer-facing analytics is met cold, by someone who came to your product for a different reason and has now clicked a tab.
Three things follow, and they are the ones that separate an embedded dashboard that feels native from one that feels bolted on.
The interaction grammar has to be your product's, not the analytics vendor's. If the rest of your application uses a certain date picker, a certain way of showing filters, a certain place for actions, the dashboard that breaks that pattern reads as a different application. This is what the white-label question is actually about, and it goes well past colours.
Every number needs to be interrogable in one click. A customer who does not trust a figure and cannot get under it will not raise it as a question about the definition. They will treat it as wrong, and tell you so. Drill-through is not an advanced feature here, it is the mechanism by which a customer resolves their own doubt instead of sending it to you.
Defaults carry more weight than any control. Most customers will never change a filter, so the view they land on is the view they have. An internal dashboard can afford a neutral default because the analyst will adjust it; a customer-facing one cannot, and the default range and default segment deserve more argument than the chart types do.
Which of this actually reduces support tickets
The self-service claim usually made for analytics is that customers stop asking you for reports. That is true, and it is the second-order effect. The first-order effect is smaller and more reliable: the four states above stop producing tickets that were never about analytics at all, because the customer was reporting a blank screen.
Both matter, and they arrive in that order. A self-service report builder removes a class of request. Handled empty states remove a class of confusion, and confusion is the one that gets filed as a bug.
The metrics change by industry, and the delivery contract does not
- SaaS and software: feature adoption and usage patterns, team collaboration metrics, ROI and productivity, benchmarks against similar accounts
- Fintech and financial services: spending patterns, portfolio performance, budget adherence, payment analytics and reconciliation
- Healthcare and telemedicine: patient outcome tracking, appointment completion rates, practice performance, population health
- E-commerce and retail: sales by channel, inventory movement, customer behaviour, campaign ROI
- HR tech and workforce: engagement scores, hiring funnel metrics, performance review analytics, workforce planning
- Martech and advertising: campaign performance, audience engagement, attribution, A/B test results
Build, embed, or buy differ in timeline, and differ more in what you still maintain in three years
Once you have decided analytics is worth doing, there are three realistic routes. They differ in timeline, and they differ more in what you are still maintaining afterwards.
Building in-house takes 6-12 months realistically: basic dashboards around six months, a full feature set past twelve. What you actually build is a data aggregation layer with query optimization, chart library integration, a report builder your customers can operate, PDF and Excel export with formatting that survives contact with a printer, email scheduling and delivery, and performance work for large datasets. That is two to three full-time developers, and then it is a permanent line item, because drill-down, filtering and advanced export each take weeks on their own and none of them are ever finished.
Embedding a traditional BI tool trades build time for configuration time. You inherit an interface designed for analysts, a branding ceiling, usually a separate login, and an enterprise sales cycle before you can start. You also inherit a pricing model built for a fixed internal headcount, applied to a customer base you hope will grow.
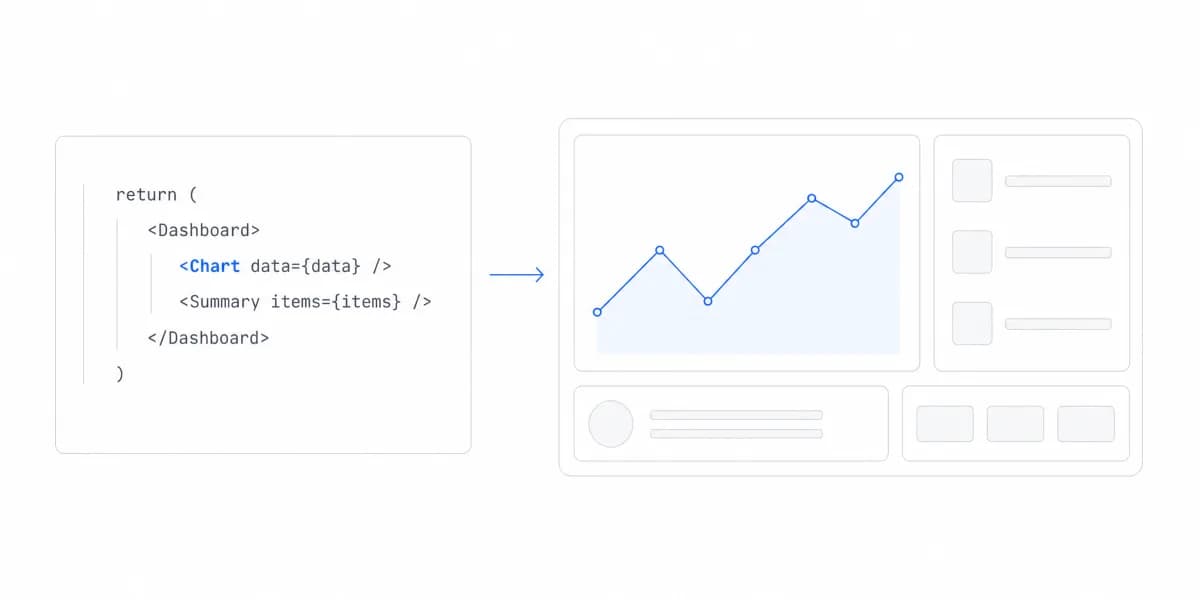
A purpose-built platform gets you integrated quickly, with visualisation components already built for this job and white-labelling as a feature rather than a project. What you give up is control over the roadmap, which is a real cost if analytics is your differentiator and close to no cost if it is not.
The build-versus-buy question is often framed as cost. It is more useful as a question about attention: in three years, do you want your engineers maintaining a reporting product, or your product?
Two implementations, and what actually made them different
Cashpad, a restaurant POS system, replaced slow PDF exports with dashboards. Integration took about ten minutes and changed how the product demos.
"Analytics is one of the first things we are showing to our customers during the demo sessions of our product. Now it looks so much better than before, and works faster."
Nicolas, CTO at Cashpad
Orbility, a parking management platform, took around three months. The analytics integration was not the three months. Replacing an inflexible 2013 system and building the data warehouse underneath it was.
Both numbers are true and quoting either one on its own is misleading. The ten minutes is what integration costs when the data is already queryable. The three months is what it costs when it is not. Before you estimate the analytics work, estimate the state of the data it will run on, because that is the variable that actually moves.
Your customers already pay for this outcome somewhere else, which is what you are pricing against
Your customers are, in many cases, already paying for this outcome somewhere else. They export from your product and rebuild the analysis in a BI tool, or they pay somebody to do it. Analytics inside your product competes with that spend, and it competes from a better position, because you already have the data and the context.
The routes are familiar: a premium tier that includes advanced dashboards, analytics sold as a separate add-on, paid export and integration capability, and custom reporting for enterprise accounts. What any of it is worth is genuinely specific to you, and we would rather leave the number blank than invent one. Price it against what your own customers already spend getting this done elsewhere, which you can find out by asking them. Before you commit, it is worth comparing embedded analytics vendor pricing and reading through the build versus buy trade-off in more detail.
Two published numbers you can check, and the meter that decides which side of them you land on
The worth of your own analytics tier is specific to you and we are not going to invent it. The spend it competes against is public, and so is one detail that changes the buy-side arithmetic entirely.
On the spend side, Power BI Pro is $14.00 per user per month, paid yearly, and Metabase Starter is $100 per month including the first five users, then $6 per additional user per month, both checked 7 August 2026. A customer exporting from your product and rebuilding the analysis is paying something in that region per person, plus whoever spends the afternoon doing it.
On the buy side, read the meter before the rate. Metabase's pricing page states that "Both your internal team developing analytics and users of your embeds accessed through your product count as users", checked 5 August 2026. That single sentence is the difference between a per-user plan being cheap and being unworkable: on an internal deployment the meter counts your staff, and on a customer-facing one it counts your customers. A model that is comfortable at forty employees behaves very differently at four thousand end users, and the rate card looks identical in both cases.
None of that tells you what to charge. It tells you which questions to take into the vendor conversation, and it is checkable on the day you read it rather than taken on trust.
The six mistakes, and which ones get expensive
Overcomplicating the interface. Too many features exposed too early, to users who wanted one number. Start with a focused set of dashboards aimed at the decisions your customers actually make.
Neglecting mobile. Dashboards that only work on a desktop create friction for people who check things between other things. Test on a tablet and a phone before launch, not after.
Starting from the data instead of the decision. The most common failure, and it produces dashboards full of metrics nobody opens. Interview customers about the decisions they make weekly, then design for those moments specifically.
Leaving security and multi-tenancy until later. Without proper isolation you risk data leaking between customers. Designing for it early costs a fraction of retrofitting it, and retrofitting is possible but significantly more expensive.
Treating analytics as a one-time project. Shipping it and never revisiting it. Set up a feedback loop and let usage data tell you what to build next.
Over-engineering before validation. Building sophisticated self-service before you know anyone wants it. Ship a small version, watch adoption, then invest.
The roadmap starts with the self-assessment, not with a platform shortlist
1. Assess requirements. Work the self-assessment above. Review support tickets for analytics requests, look at what competitors offer, and cost the manual reporting your team already does.
2. Define the strategy. Identify the metrics your customers currently track by hand, map analytics to their actual workflows, define what success would look like, and account for the fact that your segments will not want the same things.
3. Choose the approach. Standard integration covers most SaaS products with ordinary analytics needs. Custom infrastructure is for complex data requirements or a legacy system that has to be modernised first, which is the Orbility case above.
4. Launch and iterate. Ship the essential dashboards, gather feedback on what people actually open, monitor adoption, and expand based on demand rather than on the backlog.
What is changing: AI insight, conversational queries, and where each one is actually useful
AI-generated insights are moving past anomaly detection into recommendation: automatic insight generation, predictive analytics, smart alerts. Mainstream enough to expect.
Conversational analytics lets users ask in natural language rather than build a query. Growing, and most useful where the question is simple and the schema is not.
No-code dashboard builders put dashboard creation in non-technical hands, with drag-and-drop, template libraries and AI-assisted visualisation. Mainstream.
Near-instant streaming as customers stop accepting yesterday's numbers. Growing, with the caveat above: true sub-second depends on query complexity, data volume and infrastructure, and near-instant is the accurate word for most B2B SaaS.
Embedded AI agents that answer complex questions, surface things proactively and generate reports. Emerging rather than settled: interest is well ahead of production adoption, so treat it as a trend to watch rather than a requirement to meet.
Ready to launch customer-facing analytics?
Stop losing customers to competitors with better analytics. Sumboard's customer-facing analytics platform lets you launch self-service dashboards in days, not months.