Six of these thirteen platforms will tell you a price
What each one publishes (checked 31 July 2026):
- Publishes a price: Sumboard (€199/month Growth, €499 Business, Enterprise custom), Luzmo (from €995/month, billed annually), Metabase ($100/month including five users then $6 each, or $575/month including ten then $12 each), Grafana Cloud (free, then $19/month plus $8.00 per active user and $6.50 per 1,000 series), Tableau (from $15/user/month, billed annually)
- Publishes no figure: Looker, Sisense, GoodData, Reveal and Embeddable, all quoted per deal. Three of them publish the model even without the amount: GoodData prices per workspace plus a platform fee, Embeddable pricing set primarily by project scope rather than by users or query volume, and Reveal a flat-rate structure with no hidden fees and unlimited users. Power BI Embedded sits between the two groups: it prints a monthly figure for six of its eight capacity nodes and leaves the largest two unpriced, and either way it bills by provisioned capacity hour, so the Azure calculator is what turns a node size into a bill
- Quote-only but consumption-metered: Domo, which publishes no figure but bills on credits consumed rather than on seats
- Open-source: Metabase, Grafana and Superset are free to licence; hosting and engineering time are yours and are the real variable
Do not use category-wide implementation bands. Time the same production slice on every shortlisted platform: one real connection, one tenant-aware identity path, one representative dashboard, one branded outbound artefact, mobile and error states, and one deployment through your release process.
The table below connects each platform to a defensible evaluation context without inventing integration times:
| Platform | Evaluation context | Published price signal |
|---|---|---|
| Sumboard | Customer-facing workflow and SDK path | published plan price |
| Looker | Governed semantic modeling and Google Cloud fit | quote required |
| Tableau | Existing Tableau skills and content estate | licensed-user rates published; embedded case requires validation |
| Power BI | Microsoft identity, Fabric/Azure, and capacity design | capacity meter; size in Azure |
| Luzmo | Embedding-first product with active-user bands | starting plan published |
| Metabase | Self-hosted or managed BI with explicit operating ownership | OSS licence plus published paid tiers |
Decision Framework: Start with company size, budget, and technical resources. Companies below enterprise scale typically benefit from purpose-built embedded solutions (faster deployment, predictable costs). Enterprises with existing BI infrastructure may prefer established players despite longer implementations. Whether those cost more is not something this page can tell you, since most of them quote per deal.
Choosing an embedded analytics platform is one of the most consequential technical decisions for B2B SaaS product teams. The wrong choice can mean months of delayed launches, unexpected costs, or (worse) rebuilding from scratch.
This guide analyzes 13 embedded analytics alternatives against vendor documentation, published pricing checked on the dates shown, and what each platform's own materials commit to. We'll cover everything from enterprise solutions like Looker and Tableau to developer-friendly platforms like Luzmo and Reveal, plus open-source options like Metabase.
This guide answers five questions that determine whether a platform belongs on the shortlist:
- How embedding architecture (iframe vs SDK vs API-first) affects integration complexity and performance
- The hidden costs of "repurposed internal BI" tools vs purpose-built embedded platforms
- Multi-tenant security requirements and which platforms handle them natively
- Which vendors publish a price at all, what each one's meter counts, and how to run a three-year comparison on your own numbers rather than on ours
- When to choose iframe-based solutions vs SDK-first architecture vs headless BI
An Embedded Analytics Alternative Becomes Part of Your Product, Not a Tool Beside It
Embedded analytics refers to integrating data visualizations, dashboards, and reporting capabilities directly into your SaaS application so customers can analyze their data without leaving your product. Unlike standalone BI tools, embedded analytics becomes part of your product's user experience.
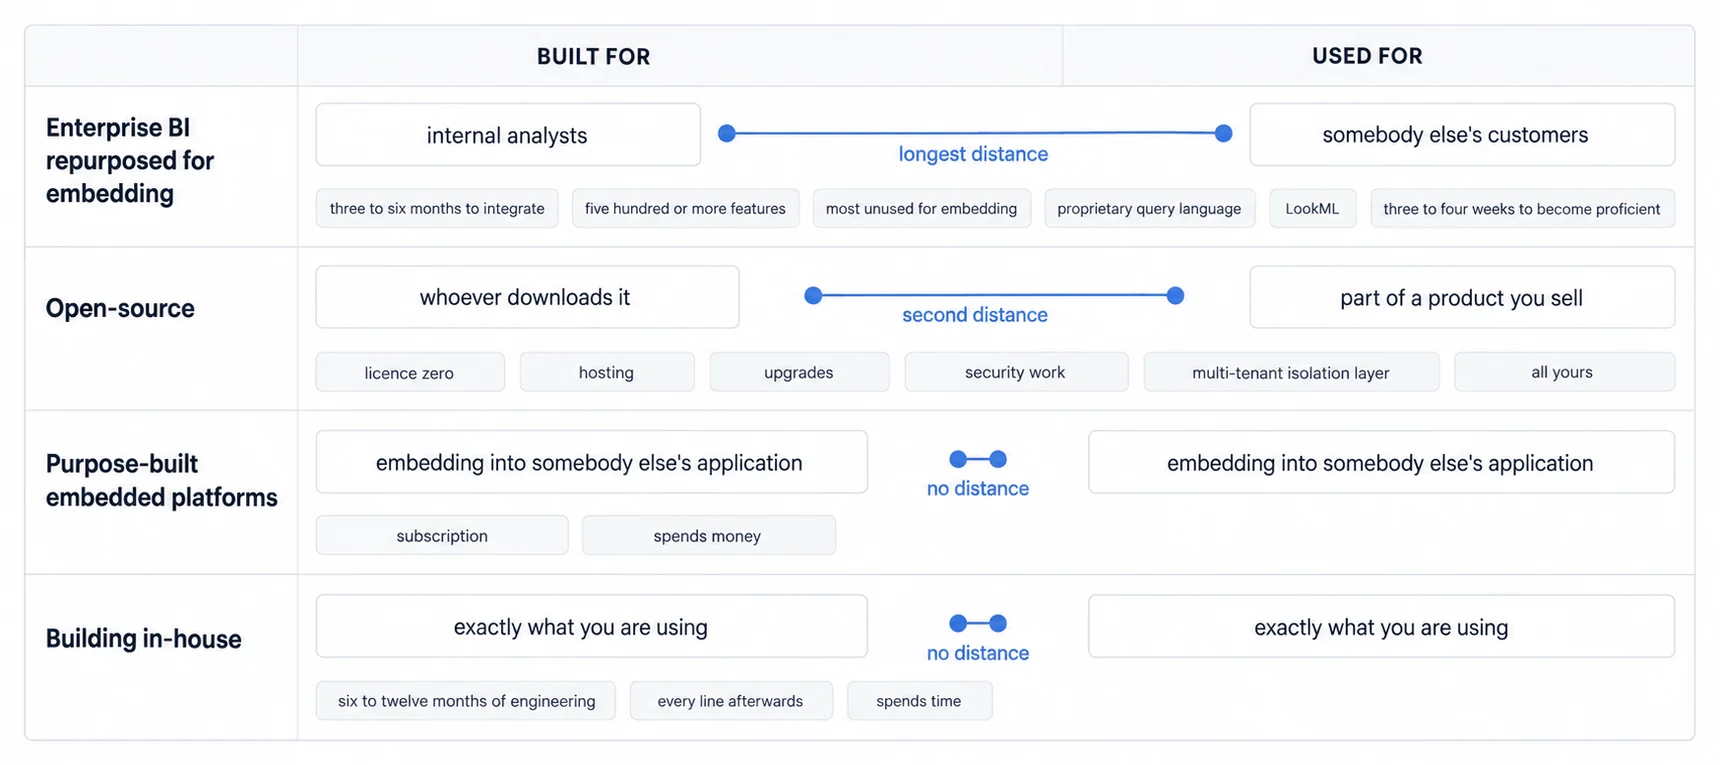
The embedded analytics market splits into four distinct categories, each serving different use cases and company profiles:
Enterprise BI, Repurposed: Built for Analysts and Then Pointed at Customers
Looker, Tableau, Sisense and Power BI originated as broad BI platforms and also support embedded use cases. Their modelling, governance, administration and deployment surfaces are correspondingly substantial. Integration time depends on the existing data model, authentication design, tenancy requirements and release process, so it should be estimated from a representative proof of concept rather than a category-wide timeline.
What you get in exchange is genuine: strong governance, sophisticated multi-source modelling, and a semantic layer a data team can live in. What comes with it is a proprietary query language, LookML for Looker or DAX for Power BI, and a price that is negotiated rather than published, so you cannot size the thing before a sales conversation.
The planning implications follow from the architecture. LookML and DAX add product-specific concepts to the implementation. iframe embedding adds a page boundary and a load step your application does not control, which is worth measuring on real data rather than demo data. Modelling, governance and administration also require named owners; include that capacity in the operating model rather than hiding it in the licence line. For reliability, ask for uptime history and the current status page for anything customers will see.
Right for large enterprises with existing BI infrastructure and a dedicated data team who need complex multi-source modelling.
Purpose-Built for Embedding: the Customer-Facing Case Is the Design Case
Sumboard, Luzmo, Reveal and Embeddable were designed for this job rather than adapted to it, which shows up in three places: the embed is a component call rather than an infrastructure project, multi-tenancy and row-level security are in the default path instead of being configured, and white-labelling reaches custom domains, logos and themes rather than stopping at a colour picker.
The pricing shapes differ and none of them price your customer list as licensed users, which is the point of the category. Sumboard charges a flat monthly plan, Luzmo an active-user band, and Reveal and Embeddable quote per deal. There is also no proprietary language to learn, so the skill your team builds is your own stack rather than a vendor's.
Right for B2B SaaS companies of roughly 50 to 500 people who need customer-facing analytics shipped without derailing the core roadmap.
Open Source: the Licence Is Free and You Become the Operator
Metabase, Grafana and Apache Superset cost nothing to licence and give you full control of the code, which is a real advantage for a team that wants it. Everything else about them follows from one fact: self-hosting means the cloud hosting, the security, the updates and the backups are yours, permanently, and support is the community unless you buy the enterprise tier.
Right for technical teams with genuine DevOps capability who want control of the platform and have somebody to give that ownership to.
For every cost and timeline in the evaluation, label its evidence: a published price, a written vendor quote, an observed invoice, loaded internal time, or a measured trial result. Do not combine an assumed hosting range, a generic contractor rate, and a vendor licence into a precise-looking total. Use your deployment, ownership model, security requirements, and release process.
The costs that do not appear on any pricing page are the server hosting and its database, whatever share of an engineer the DevOps really takes, security audits and penetration testing where your customers ask for them, and version updates, which never reach zero.
Building It Yourself Makes Sense Only When Analytics Is the Product
Some teams build from scratch on charting libraries such as D3, Chart.js or Recharts plus their own backend. Estimate that route from a named scope: semantic definitions, query service, tenant authorization, dashboard editing, chart and table behavior, responsive interaction, accessibility, exports, schedules, observability, upgrades, and support.
Maintenance does not drop to zero after launch, but its size is a fact about the surface you own and the reliability level you promise. Measure the first production slice, record unresolved work, and forecast from your loaded team cost rather than borrowing a generic calendar range or dollar total.
This is right when analytics is your product rather than a feature of it, meaning BI platforms, visualisation tools and analytics-as-a-service. It is wrong in the usual case, where analytics is a feature and the opportunity cost of the engineering time is the real price. The build versus buy breakdown works the comparison through in detail.
Company size is only a proxy for team shape and available ownership, but it provides a useful first filter:
- <50 employees (Pre-seed to Seed): Sumboard, Luzmo, or Reveal. Need speed and simplicity.
- 50-500 employees (Series A-C): Purpose-built embedded platforms. Balance speed, cost, and features.
- 500-1000 employees (Late-stage): Evaluate both purpose-built and enterprise options based on complexity.
- 1000+ employees (Enterprise): Looker, Tableau, or Sisense if you have dedicated BI team and infrastructure.
Thirteen Embedded Analytics Alternatives, Grouped by What Each One Was Built For
The enterprise four, and where each one stops publishing
The four enterprise platforms below share a history and a habit. All were built as internal BI for analysts and added embedding afterwards, and all four publish enough to look transparent and then stop at exactly the point an embedded deployment starts.
That is not an accusation, it is what their own pricing pages say, checked on 31 July 2026 and cited below. It is also the single most useful thing to know before building a comparison spreadsheet, because four of the columns you were going to fill in do not exist.
| Platform | What is published | What is not | Typical integration |
|---|---|---|---|
| Looker | nothing but token overages | platform, base and per-viewer rates | measure in proof of concept |
| Tableau | edition prices and licensing-model definitions | the quote for your embedded deployment | measure in proof of concept |
| Sisense | nothing; a 7-day trial, advertised on the home page | every rate | 3-5 months |
| Power BI Embedded | node sizes, a calculator, and a monthly figure for A1 to A6 | a price for the two largest nodes, and any bill before you size the node | 1-3 months |
Looker asks you to learn a language that only works in Looker
Looker is Google Cloud's enterprise BI platform, built around LookML, a proprietary modelling language. It was designed for internal analytics teams and the embedding was added later, which shows in the architecture: embedding is primarily iframe-based and multi-tenant setup means careful LookML modelling rather than configuration.
What you get for that is real. The semantic layer is genuinely powerful, governance and permissions are strong, API coverage is complete, and if your data already lives in Google Cloud the integration is deep. What you pay is a learning curve measured in weeks before anyone is productive, an integration measured in months, and a semantic layer that does not travel: LookML runs in Looker and nowhere else, so leaving means rewriting the model rather than pointing it somewhere new.
On cost, Google publishes no figure at all. Standard, Enterprise and the Embed platform all read "Call sales", so there is no platform, base or per-viewer rate to plan against (Looker pricing, checked 7 August 2026). The only published numbers on that page are Conversational Analytics token overages at $3.00 per million input tokens and $20.00 per million output tokens. One question worth asking in the sales conversation, because the price list cannot answer it: is the LookML modelling work inside the quote or beside it?
This fits organizations with a dedicated BI team, existing Google Cloud infrastructure, and a real need for governed semantic modeling. For a straightforward embedded use case, validate whether that modeling and administration surface earns its ownership cost.
Tableau publishes seat prices, and seats are not what an embedded deployment buys
Tableau, now part of Salesforce, is among the most established visualisation platforms, and Tableau Embedded puts its dashboards inside another application. The visualisation library is the best-known reason to choose it: the chart types, the customisation depth, the training material and the size of the community are all genuine advantages, and the Salesforce ecosystem integration matters if you are already in it.
Tableau's current Embedding API v3 exposes a web component and JavaScript API; Tableau's configuration documentation also describes the iframe created beneath the component. Existing workbook complexity, identity and permission design, data behavior, and release requirements determine the implementation work. Measure a representative path rather than assigning the platform a category-wide timeline.
The pricing needs care because the published price is an EDITION starting price, not a role rate and not an embedded-deployment total. Standard starts at $15 per user per month and Enterprise at $35, both billed annually; Creator, Explorer and Viewer are named as licence types in a footnote with no rate attached, so there is no Viewer figure to multiply. Tableau documents role-based licensing, usage-based licensing measured in analytical impressions for external Usage Viewers, and a capacity-based model introduced in July 2026; Creators and Explorers remain per-user under the latter two. It describes Embedded Analytics as a limited-use Tableau Cloud offering for external-facing applications. Read the current Tableau licensing models, then obtain the meter and quote that apply to your deployment rather than multiplying an internal Viewer rate.
Tableau belongs on the shortlist when its visualisation, governance, Salesforce fit, trained operators, or existing content estate create value that the embedded product can reuse.
Sisense will let you try it before it will tell you the price
Sisense is a cloud-native platform focused on complex data modelling and AI-driven insight, and Sisense Embedded handles white-labelling and customisation for SaaS applications. The modelling across multiple messy sources is the real strength, white-labelling is flexible, and there is a proper embedded SDK alongside the iframe route.
Integration runs three to five months. Customisation is high, which is another way of saying it takes developer time, and multi-tenancy is supported through a setup that is not simple.
Sisense publishes no figure either: Enterprise reads "Talk to us" (Sisense pricing, which redirects to the plans page, read in a browser 7 August 2026). The trial sits somewhere else, and that is worth knowing before you go looking: the plans page mentions none, while the home page advertises a full-featured 7-day trial with sample data and no setup. The useful nuance is that trying and pricing are separate here, so a hands-on evaluation does not have to wait for the commercial conversation, which is not true of every vendor on this page. Worth asking for uptime history and the current status page before committing, as with any platform that will sit inside your product.
Suits mid-to-large enterprises with genuinely complex multi-source modelling needs. Overkill for a straightforward embedded dashboard.
Power BI Embedded prices the capacity, not the people
Power BI Embedded puts Microsoft's reports inside a web application using the App Owns Data architecture for multi-tenancy. If your company already runs Microsoft 365 and Azure it is the path of least resistance: the interface is familiar to anyone who has used Excel or Power BI, the Azure ecosystem support is strong, and integration is faster than the rest of this category at one to three months.
The meter is the thing to understand. Billing is capacity-based and hourly on whichever node type you deploy, and the node can be paused when idle. Microsoft publishes a monthly figure for six of the eight A SKUs, from $735.913 for A1 to $23,542.938 for A6, and leaves the two largest, A7 and A8, as N/A; the page carries its own footnote calling these estimates rather than price quotes, and sends you to the Azure pricing calculator for a real number (Power BI Embedded pricing, read in a browser, Central US in USD, 5 August 2026). Because the meter counts capacity rather than users, the bill follows the node you keep provisioned rather than your headcount, and a provisioned node accrues hours whether or not anyone opens a dashboard. Pausing and resizing are therefore the cost controls, and the calculator is worth running against your real traffic shape before committing rather than after.
Performance is tied to the capacity tier, which means scaling performance and scaling cost are the same lever. Right for companies already deep in Microsoft 365 and Azure, particularly with variable usage where pausing is genuinely available.
Purpose-built for embedding, which changes the timeline but not the transparency
The four below were designed for embedding rather than adapted to it, and the difference shows in one number: integration is measured in hours or days rather than months. What it does not predict is whether you can find out the price. Two of these four publish a rate and two quote per deal, which is the same split as the enterprise category and worth noticing before "purpose-built" is read as "straightforward to buy".
| Platform | First dashboard | What it optimises for | Price |
|---|---|---|---|
| Sumboard | minutes to SDK, days to deploy | shipping without owning the platform | published, €199-€499/mo |
| Luzmo | 1-2 hours | API-first, European SaaS | published, from €995/mo |
| Reveal | 1-3 days | .NET and Microsoft stacks | quoted per deal |
| Embeddable | 2-5 days | maximum control of the visual layer | quoted per deal |
Sumboard prices the plan, not the viewers
Ours, so read the rest of this section with that in mind. Sumboard is built for B2B SaaS companies of roughly 50 to 500 people that need customer-facing dashboards shipped in days. The embed is a component call rather than an infrastructure project, with SDKs for React, Vue and Angular, complete white-labelling down to logos, colours, domains and PDF exports, and row-level security for multi-tenancy built in rather than configured.
Growth is €199 a month with unlimited viewers and up to 10 embedded dashboards. Business is €499 and adds a custom PDF layout builder, dashboard localisation, versioning and priority support. Enterprise is custom and adds custom data pipelines, a data warehouse, onboarding and dedicated support (Sumboard pricing). There are no per-viewer or per-seat fees, so viewer growth does not move the bill; the limits that do apply are on dashboards and scheduled emails. We are SOC 2 compliant. On deployment and residency options, ask us, since what is available is agreed per contract, and confirm any one-off costs before you finalise a budget.
Two claims here are ours rather than independently benchmarked, and you should test both during a trial: that integration takes minutes, and that the rendering is tuned for sitting inside your application rather than owning the page. Time it yourself.
What we are not: there is no LookML-equivalent semantic layer, the ecosystem is smaller than Looker's or Tableau's, and we do not have a decade of enterprise references. If you need a modelling layer that a data team will live in, the enterprise four are a better fit and this guide would rather say so.
Choose us over the enterprise platforms when a published price and an embedding-first trial matter; over Metabase or Grafana when you would rather someone else operate the analytics infrastructure; and over building when you do not want to own the complete analytics surface and its maintenance. Try Sumboard's embedded analytics free.
Luzmo publishes a price, and it is not aimed at the same buyer
Luzmo, formerly Cumul.io, is Belgian, API-first, and aimed at European SaaS companies. First dashboard in an hour or two, a JavaScript SDK, native multi-tenancy, strong white-labelling and multi-language support.
Starter is from €995 a month and Premium from €2,495, both billed annually, with Enterprise custom (Luzmo pricing, checked 7 August 2026). Two things set the figure: the number of solutions you deploy in your product, and your monthly-active-user band, which means the bill does move with your customers' growth even though the rate is published. White-labelling is included on every tier, described on the Starter page as your brand with no Luzmo mentions.
The company is EU-based, and that is a fact about incorporation rather than an answer about data residency or GDPR specifics. Ask Luzmo directly; that is not something to take from anyone's comparison page, including this one.
Documentation is thinner than Looker's or Tableau's, which is a fair trade for a platform a fraction of their age, and worth checking against your own team's tolerance during evaluation.
Reveal is built for the Microsoft stack and quotes every deal
Reveal focuses on dashboard embedding with SDKs for React, Angular, jQuery and ASP.NET, which is the clue to who it is for. Its documentation describes white-label, multi-tenant, and self-service capabilities; verify the exact surfaces, policy path, and elapsed implementation time in a proof of concept.
Reveal publishes no figure and no tiers at all; the pricing page is a single "Request a Personalized Quote" form (Reveal embedded analytics pricing, read in a browser 7 August 2026). It does describe the shape of the deal even while withholding the number: no hidden fees, a flat-rate structure, and unlimited users. That shape is worth something on its own, because a flat rate with unlimited users is the opposite of the per-seat trap. What the page does not say is what the rate is flat against, so that is the question to put in the first email: which number moves the bill when we grow.
Since nothing is published, we cannot tell you how it compares on price to anything else on this page, and neither can anyone else.
Embeddable hands you the visual layer and expects you to want it
Embeddable is developer-centric in a specific way: the architecture is component-based and you bring your own visualisations, so the platform handles data and embedding while your team owns what it looks like. TypeScript support is good and the flexibility is the highest in this category.
The cost is developer time. Two to five days to a first dashboard assumes strong frontend capability, the learning curve is steeper than plug-and-play alternatives, there are fewer features out of the box by design, and the documentation is still maturing.
No figure is published. Embeddable describes a flat monthly subscription with unlimited usage and every feature included, quoted per project (Embeddable pricing, read 7 August 2026), and is explicit that it does not meter monthly active users, dashboard views or query volume, with project scope as the stated driver. Evaluation is a supported proof-of-concept with account-management and engineering help rather than a free tier, which tells you something about the deal size it expects.
Right for teams with real frontend capability who want control of the visualisation layer. Wrong for teams who wanted that layer to already exist.
Open source, where the licence is free and the job is not
The three below cost nothing to licence and that is the least useful fact about them. What you are actually choosing is to become the operator: hosting, upgrades, security and multi-tenancy all move onto your side of the line, permanently. The right comparison is therefore not a licence fee against zero. It is your hosting plus your engineering time against somebody else's licence fee.
There is a second trap specific to this category. Two of these three were built for something other than customer-facing business analytics, and the mismatch is not obvious from a feature list.
Metabase is the closest fit, and embedding is the paid tier
Metabase is the most widely used open-source BI tool and the one non-technical people get on with, which is a genuine advantage: the query interface is simple enough that business users write their own. Self-hosting is free with unlimited users, the community is active and the documentation is good.
The thing to know before planning around the free version is that white-label embedding is not in it. Pro is $575 a month with 10 users included and $12 per additional user, and embedding plus multi-tenant embedded analytics start there rather than at Starter. Enterprise is custom from $20,000 a year (Metabase pricing, checked 7 August 2026).
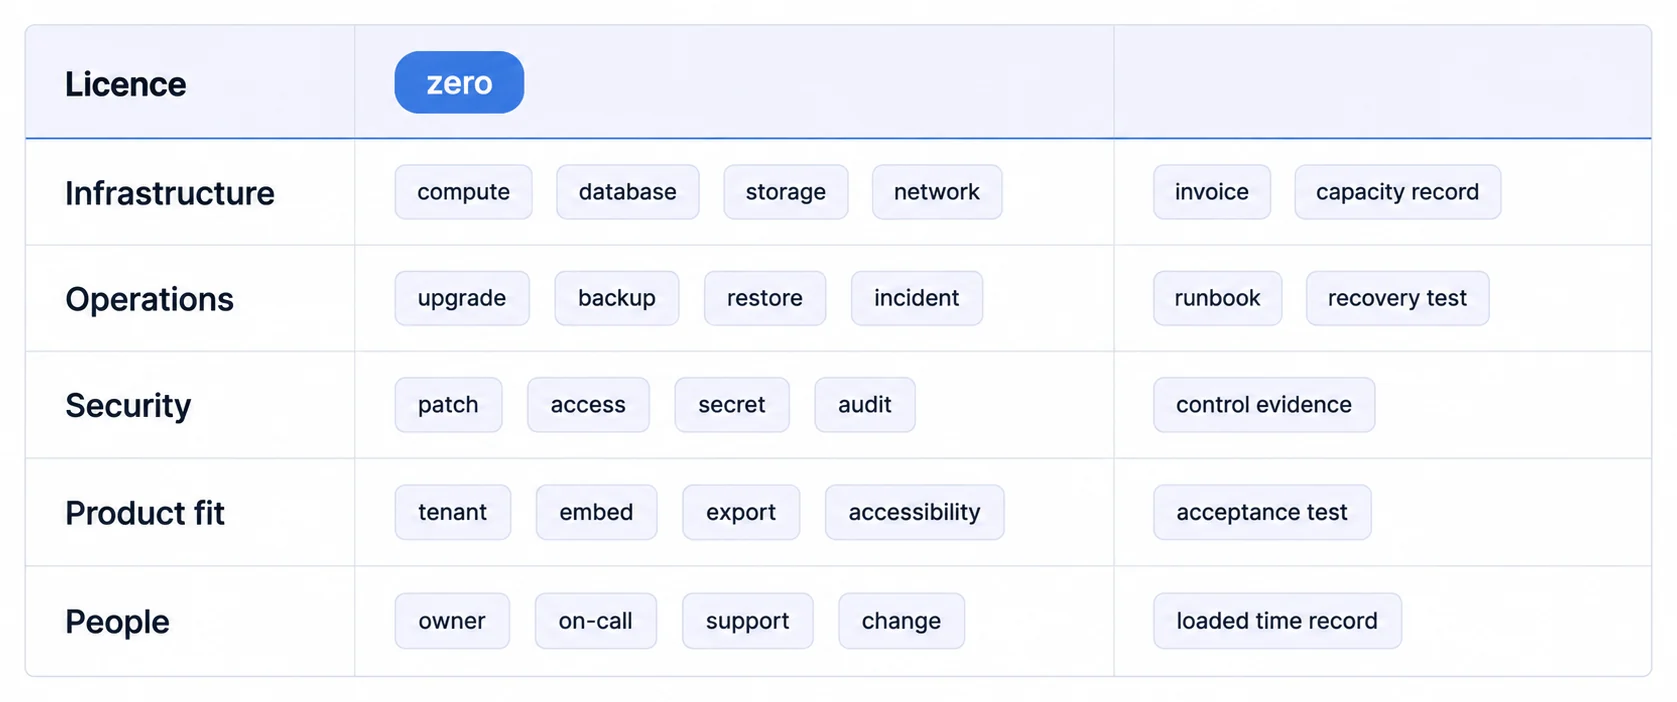
For a production multi-tenant deployment, the licence is only one line. Price compute, database, storage, network, upgrades, backup and restore, security work, support, and the loaded time of named owners from your own deployment records. Metabase does not publish a universal self-hosted operating total, and neither should a comparison page invent one.
Self-hosting and embedding require infrastructure, identity, tenant-policy, and release work that varies by environment. Time that path yourself and inspect the current embedding options in Metabase documentation. It can fit technical teams that want control and have named owners; it is a poor fit when that operating responsibility is unowned.
For a like-for-like comparison, read the current Sumboard pricing, record the plan and meter on the evaluation date, and project it with the same integration, data-connection, support, and change assumptions used for Metabase. A licence multiplication alone is not total cost of ownership.
Grafana is superb at the job it was built for, which is not this one
Grafana is an observability platform, and for time-series and infrastructure metrics it is excellent: real-time dashboards, deep Prometheus and InfluxDB integration, and a large community.
Point it at business analytics and test the required table behavior, tenant model, embedding boundary, customer-facing interaction, and accessibility rather than assuming observability features transfer unchanged. None of that is a criticism of Grafana; it is a fit test for using a monitoring-oriented product in sales, finance, or operations reporting.
The licence is free and Grafana Cloud is not: a free tier, then Pro at a $19 monthly platform fee plus $8.00 per active user and $6.50 per 1,000 metric series, with Enterprise starting at a $25,000 yearly commitment (Grafana pricing). Note that the Pro meter counts active users, which is the model to watch when the users are your customers rather than your staff.
Right for DevOps and SRE teams embedding monitoring. Wrong for non-technical end users and wrong for business analytics, which is the use most people arrive at this page looking for.
Apache Superset asks for Kubernetes before it asks for anything else
Superset came out of Airbnb, runs on a modern Python stack, connects to more than fifty databases, and has a genuinely good visualisation library plus SQL Lab for exploration. The Apache Software Foundation community behind it is active.
The prerequisite is the story. Deployment and operation require container, Python, SQL, identity, and security ownership. Validate current embedding support, tenant isolation, upgrade work, and customer-facing finish with the version you intend to operate.
The licence is free; managed services are separately priced and offers differ. Price hosting, managed-service quotes, and engineering time with your own scope and compare the total to a managed-platform quote, rather than comparing a licence fee to zero.
Right for data engineering teams with strong Python and Kubernetes skills who want full control. Wrong for everyone who wants a dashboard next week.
Two platforms where an architecture decision sets the bill
The last two are enterprise platforms with embedding attached, and they belong together for a reason that has nothing to do with their feature lists. Neither meters on users. Both meter on something you decided for other reasons, which makes them the two platforms on this page where a technical choice made in year one determines what you pay in year three.
GoodData meters your tenancy design
GoodData is an enterprise analytics platform aimed at large-scale deployments with complex modelling. The modelling is strong, security is enterprise-grade, the multi-tenant architecture is well thought out, and the API is complete. Implementation runs two to four months on a cloud-native platform with an embedding SDK.
No figure is published; both tiers require contact (GoodData pricing, checked 7 August 2026). What the page does describe is the shape: Professional is per-workspace pricing plus a platform fee, with unlimited users and unlimited data, and Enterprise is custom.
Read that carefully if you are building a multi-tenant product, because a per-workspace meter tracks how you partition customers. One workspace per customer and one workspace per customer segment are the same product decision viewed two ways, and they are not the same invoice. That is worth modelling before you design the tenancy rather than after, and it is the kind of coupling between architecture and cost that a feature comparison will never surface.
Since nothing is published we cannot tell you how it lands against mid-market budgets, and any comparison that does is guessing.
Domo meters your pipeline, not your customer list
Domo is a cloud BI platform whose Domo Everywhere handles embedding, positioned as one platform for both internal and external analytics. It is genuinely all-in-one, combining BI with data integration, with strong enterprise features and good mobile support. Implementation runs three to six months.
Pricing is credit-based consumption with no figure published, and there are only two routes in: a 30-day free trial with no credit card, or a custom quote (Domo pricing, read 7 August 2026). Credits are consumed by actions rather than by seats: storing data, updating tables, running workflows, ML inference. Domo states unlimited users and no per-user charges, which is the right meter for customer-facing analytics and an unusual one to find at this end of the market.
The consequence is the mirror of GoodData's. Your bill follows data and pipeline activity, so a decision to refresh hourly instead of daily is a pricing decision, and so is a modelling approach that rebuilds tables rather than updating them. For a multi-tenant product that is worth modelling against your real refresh cadence before committing.
Both of these suit large enterprises that want one platform for internal and external analytics, and both are more than an embedded-only use case needs.
Compared Side by Side on Published Prices, With the Gaps Left Visible
The pricing column below is what the vendor publishes on its own site, read on 31 July 2026. Where a vendor publishes nothing we say so rather than estimating, because an estimate presented in a comparison table reads as a fact and we have no way to check it.
The white-labelling column is our reading of each vendor's own documentation, scored on one question: can the vendor's name be removed from every surface a customer sees, exports included? "Full" means the vendor states that explicitly, "Limited" means we could not find that statement, and the middle values mean it depends on the tier or the embed method. It is not a measurement, so test it in a demo.
| Platform | Best For | Published price | Metered on | Architecture | White-Labeling |
|---|---|---|---|---|---|
| Sumboard | B2B SaaS (50-500) | €199-€499/mo | a monthly plan fee, viewers unlimited | SDK-first | Complete |
| Luzmo | European SaaS | from €995/mo, billed annually | solutions and monthly active users | API-first | All tiers |
| Metabase | Self-Host Teams | free OSS; $100/mo Starter with 5 users included then $6 each, $575/mo Pro with 10 included then $12 each | licensed users, after the included block | iframe | Pro and above |
| Grafana | Monitoring/DevOps | free OSS and free Cloud tier; Pro $19/mo plus $8.00/active user and $6.50/1k series | series, GB and active users | iframe | Limited |
| Tableau | Enterprises | from $15/user/mo Standard, $35 Enterprise, for licensed users; no embedded viewer rate published | licensed users; capacity option is quote-only | iframe/JS API | Test the export |
| Looker | Enterprises with BI teams | none, all editions read "Call sales" | agreed per deal | iframe | Test the export |
| Sisense | Mid-Large Enterprise | none, Enterprise reads "Talk to us" | agreed per deal | iframe/SDK | not verified |
| Power BI Embedded | Microsoft Ecosystem | none, the SKU table lists node sizes only | capacity node hours | Embedded | Test the export |
| GoodData | Enterprise Complex | none, both tiers require contact | workspaces plus a platform fee | SDK | not verified |
| Reveal | .NET/Microsoft Stack | none, every tier is quote-only | agreed per deal | SDK | Full |
| Superset | Python/Data Eng | free, Apache-licensed | your own infrastructure | iframe | DIY |
| Embeddable | Custom Visualizations | none published; flat monthly subscription, quote only | project scope, explicitly not MAUs or query volume | Component | Maximum |
| Domo | Large Enterprise | none published; credit-based, quote only | credits consumed by data, pipeline and workflow activity | Cloud | not verified |
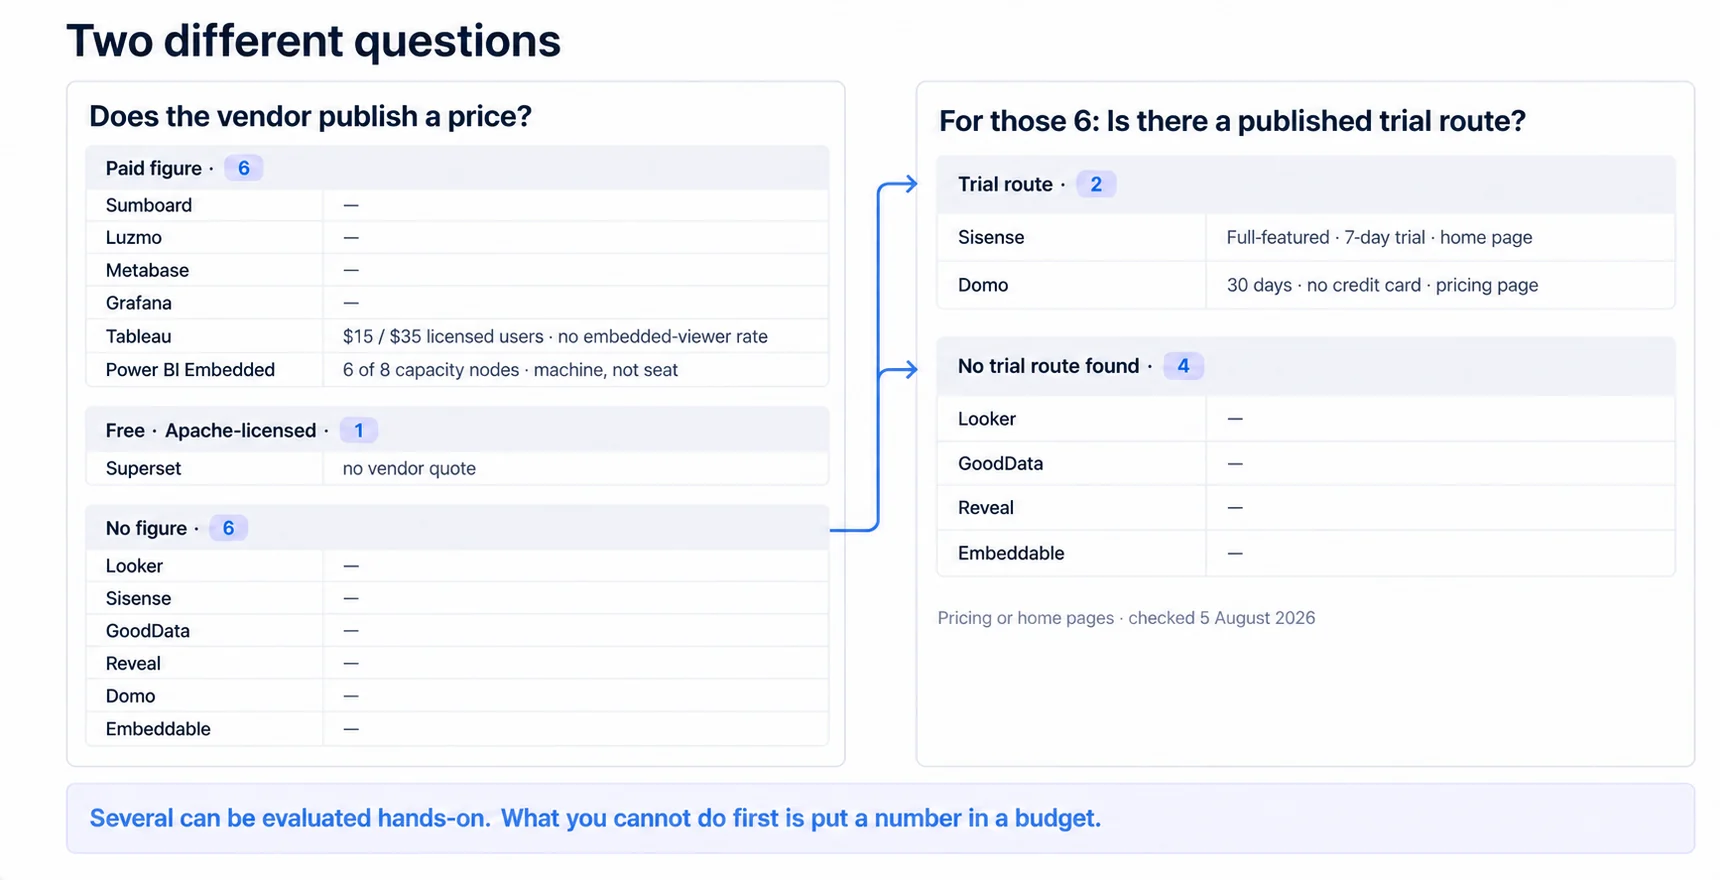
The thirteen platforms in this table fall into three groups, and it is worth being exact about them. Six publish a paid figure: Sumboard, Luzmo, Metabase, Grafana, Tableau and Power BI Embedded. Read the last two with care. Tableau's $15 and $35 rates are for licensed users, and it publishes no embedded-viewer rate, so a customer-facing rollout there still needs a quote; Power BI Embedded prices six of its eight capacity nodes and leaves the largest two as N/A, and its figure buys a machine rather than a seat, so the Azure calculator is what turns it into a bill. One is free and Apache-licensed, Superset, which has no vendor to quote you anything. The other six publish no figure at all: Looker, Sisense, GoodData, Reveal, Domo and Embeddable.
It is worth separating two things that get conflated. Not publishing a price is not the same as not letting you try the product. Two of the six make that easy: Sisense advertises a full-featured 7-day trial, though on its home page rather than its pricing page, and Domo publishes 30 days with no credit card. For the other four, Looker, GoodData, Reveal and Embeddable, no trial route appeared on either their pricing or their home pages when we looked on 5 August 2026, which is a statement about what they publish rather than about what they would agree to if you asked. So several of these can be evaluated hands-on. What you cannot do is put a number in a budget first.
Open source removes the licence fee; it does not remove the operating work:
Metabase, Grafana and Superset cost nothing to licence. What they cost to run is four lines that a licence fee would otherwise cover, and all four are yours:
- Cloud hosting for the analytics instance and its database
- Engineering time for upgrades, query performance and incident response
- Security work: patching, access review, and whatever audit your customers ask for
- The multi-tenant isolation layer, if the edition you self-host does not already give you one. Whether it does depends on the product and edition rather than on where it runs, so check before assuming either way
None of these has a single right number, because the DevOps line swings on how much of it you actually staff. Price it with your own engineers' loaded cost and your own hosting bill, then compare that total against a licence fee rather than comparing the licence fee against zero.
Four Decisions Separate Embedded Analytics Platforms, and Architecture Sets the Rest
The architecture question is really: where does the boundary run?
The three embedding architectures differ by one thing, and everything else follows from it. Where does the line between your application and the analytics sit, and therefore which side of it are you able to change?
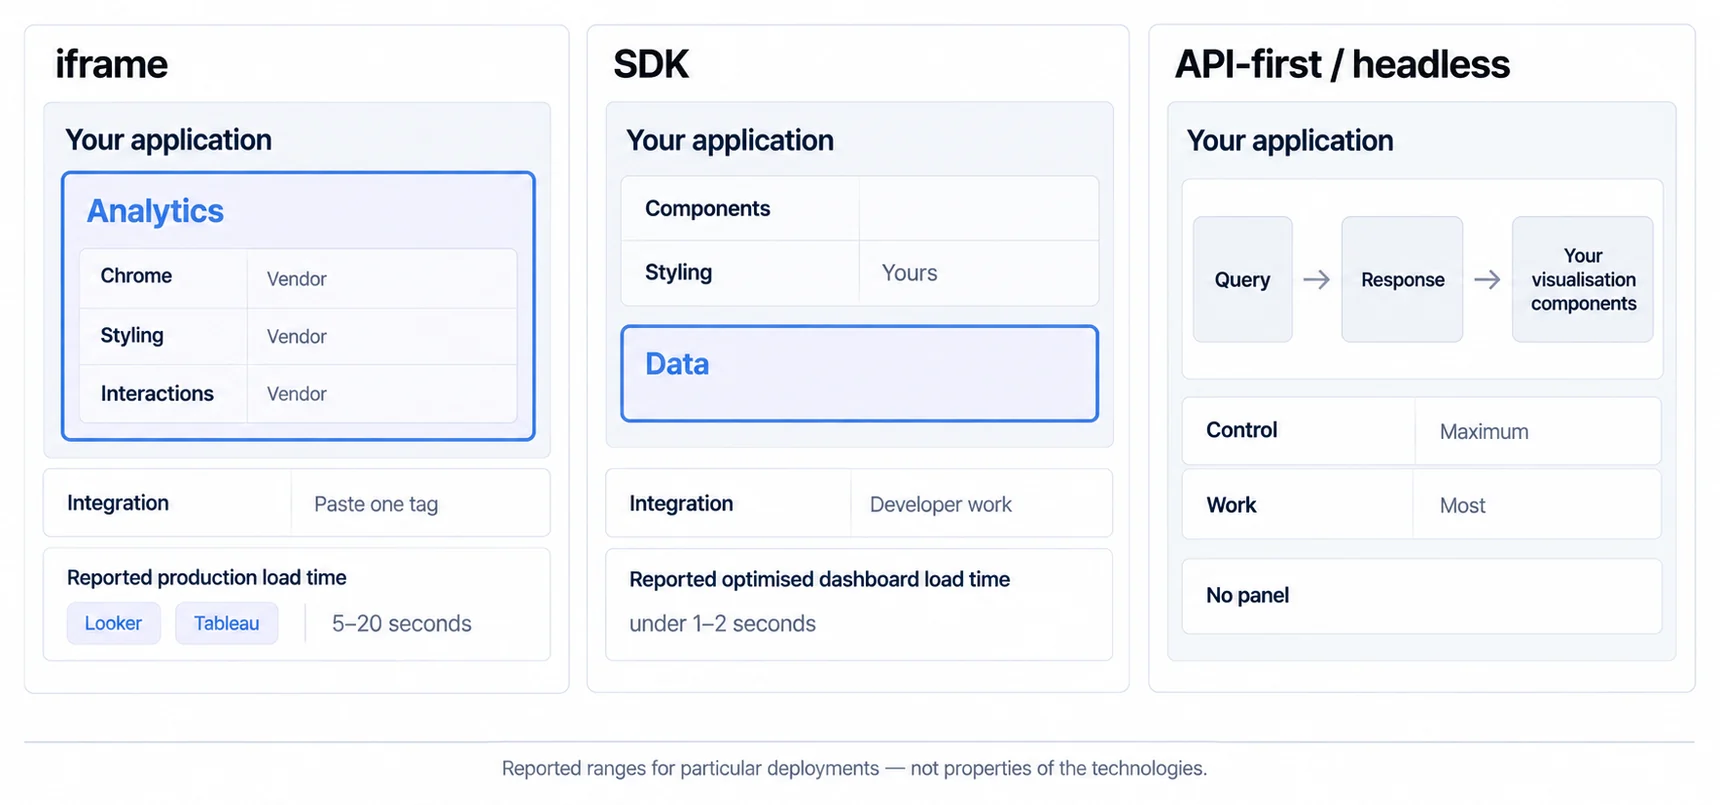
With an iframe the boundary is the frame, and everything inside it belongs to the vendor. Integration is genuinely simple, since you paste in a block of code, which is why Looker, Tableau, Power BI, Metabase and Grafana all offer it. What stops at that boundary is your styling, your performance budget and a good deal of your authentication comfort, along with the scroll behaviour that makes an embedded frame feel like a visitor in your own page. Fine for a proof of concept, and the thing your customers will notice first in production.
With an SDK the boundary is the component, so the analytics behaves like the rest of your interface: it inherits your styling, sits inside your layout, and loads on your terms. Sumboard, Luzmo and Reveal work this way. The cost is a slightly more involved first integration than pasting a frame, which is a one-off against a permanent difference in how the thing feels.
With an API-first or headless approach the boundary is the data, and everything above it is yours: you query, and you render with your own components. Embeddable and custom builds live here. Maximum control, maximum developer time, and the right answer only if you actually have a visualisation layer you want to keep.
There is no shared load-time benchmark that makes vendor architectures directly comparable. Measure each candidate on the same data, dashboard complexity, region, cache state and device during a trial, and record median and tail latency separately. The structural difference is still useful when interpreting the result: an iframe loads another document with its own assets and requests, while an SDK or headless integration can share more of the host application's loading strategy. Implementation quality determines the final numbers.
Multi-tenancy: three approaches, sorted by who is liable when it is wrong
A B2B SaaS application serves many customers from one instance, and each must see only their own data. That is the whole requirement, and it is unforgiving: there is no partial credit for a filter that works most of the time.
The three ways to get there differ mainly in where the mistake would live.
Built-in multi-tenancy puts isolation in the platform's default path, configured through tokens with row-level security, as in Sumboard, Luzmo and Reveal. Setup is fast and the safe configuration is the one you get by not doing anything clever. What you give up is the ability to express an unusual tenancy model that the platform did not anticipate, which matters if your customers nest inside each other or share data deliberately.
Manual multi-tenancy means you write the filtering logic, which is how Metabase, Grafana and Superset work. You get complete control over exactly that model, and you also own the failure mode: a filtering error does not throw, it renders, and what it renders is another customer's data in front of a customer. That is the reason this approach needs a review process rather than a developer.
Vendor-managed covers dedicated instances or isolation expressed through LookML or DAX, as with Looker and Power BI. It works and it is enterprise-supported, and it costs both money and the specialist who can maintain the logic.
The failure is worth naming plainly rather than dramatised with an anecdote: a misconfigured tenant filter shows one customer another customer's data, and it usually surfaces because the affected customer reports it, not because monitoring caught it. So the questions to ask a vendor are specific ones. Is row-level security enforced by token rather than by query construction? Is there an explicit multi-tenant guide rather than a general security page? Is there a SOC 2 Type II report? And can you see, in a trial, what happens when the tenant claim is missing entirely, since failing closed and failing open look identical until that moment.
White-labelling: three levels, measured by what the customer can still see
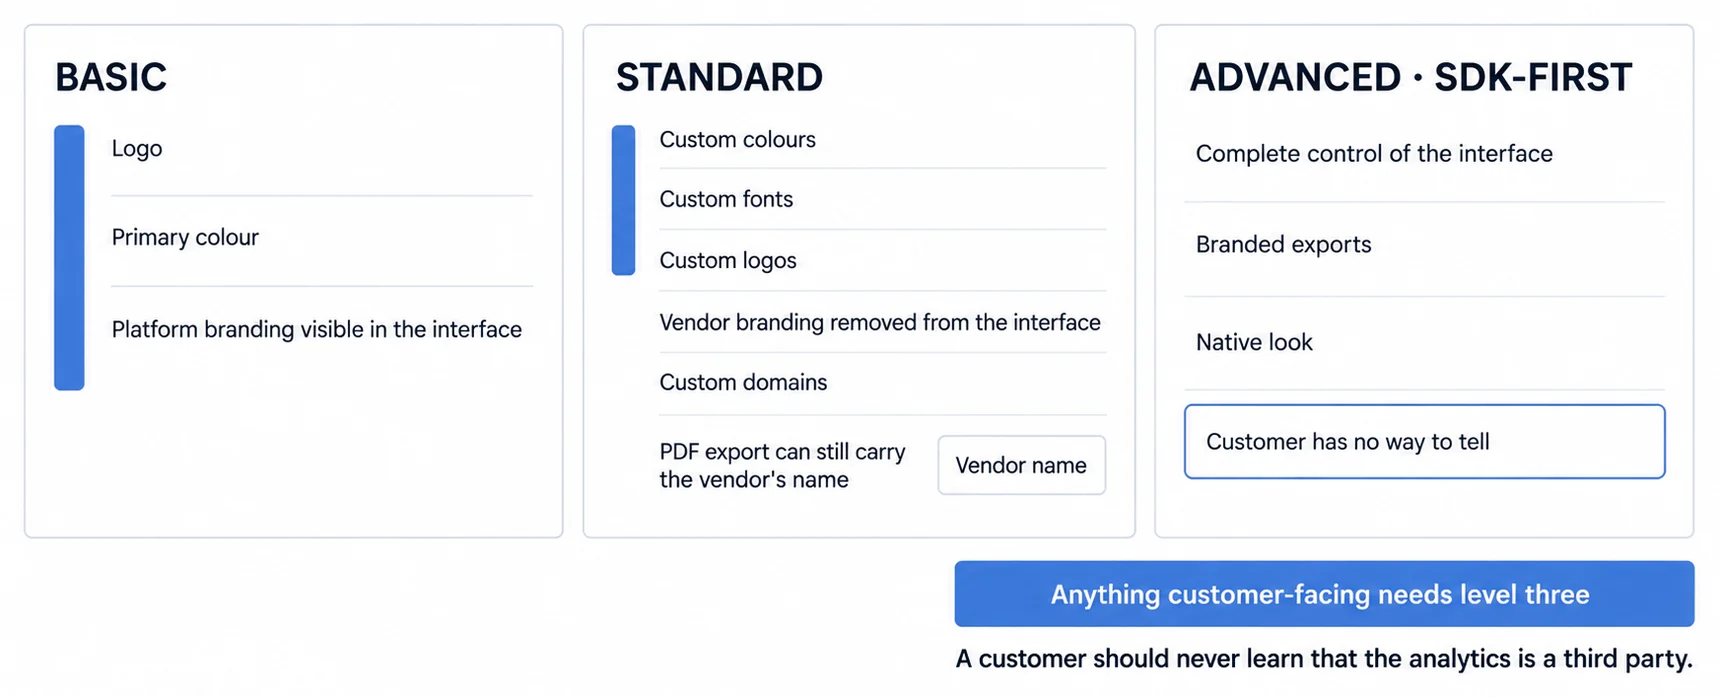
Basic is a logo and a primary colour with the platform's own branding still present, which is roughly where Power BI Embedded's customisation lands. Standard adds full theming, custom fonts, removal of vendor branding and custom domains, which covers Looker, Tableau and Luzmo. Advanced means complete control of the interface, branded PDF exports and a native feel, which is where SDK-first and headless platforms such as Sumboard and Embeddable sit.
If the analytics are internal, basic is enough and nobody cares. If they face customers, the level matters for a reason that only appears outside the dashboard: exports and scheduled emails leave your product and arrive in front of people who have never seen it. That is where basic white-labelling stops being a compromise and starts being a leak.
A Commercial Model Has Four Separate Fields, and a Price Tag Is Only One
Pricing comparisons fail when scope, meter, commitment, and evidence are compressed into one number. A monthly plan and an annual contract describe when you pay; licensed users, active users, analytical impressions, capacity, workspaces, and flat plans describe what makes the bill move. Neither says what the plan includes.
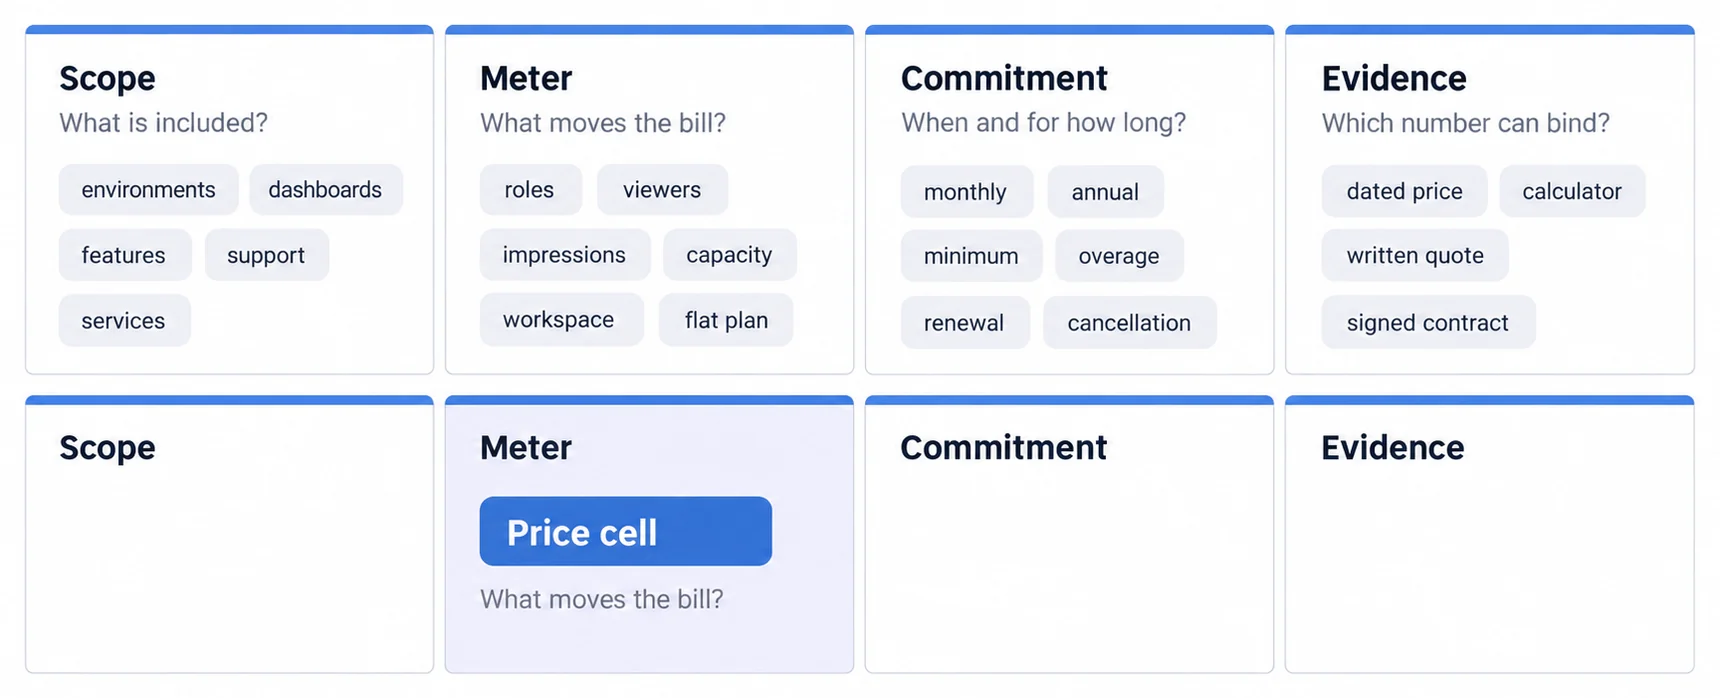
Scope records the environments, dashboards, features, support, onboarding, and professional services included in the offer. A lower rate with a required implementation package is not the same scope as a self-serve plan.
Meter records the event or unit that changes the bill. Examples include licensed roles, monthly active viewers, analytical impressions, provisioned capacity, workspaces, or a flat plan with published limits. Model that unit against the same low, expected, and high deployment scenarios for every candidate.
Commitment records billing period, minimum term, overages, renewal uplift, cancellation, and any ability to pause or resize. Annual billing is a commitment term, not a separate pricing meter.
Evidence records what can be relied on: a dated public price, calculator output with saved assumptions, written quote, or signed contract. Contact-sales is an unknown amount, not evidence of high cost. A public starting price is evidence only for the scope and meter printed beside it.
Warnings are therefore specific rather than categorical: an undefined meter, an overage without a cap, missing scope, a required fee outside the headline price, or renewal terms that were never modeled. Good evidence is similarly concrete: a dated price or quote, explicit included limits, a meter you can forecast, and written exit terms.
Time to a production slice needs one shared protocol
There is no published cross-vendor benchmark for time to a production dashboard. A tutorial render, a dashboard connected to sample data, and a tenant-safe feature released through your deployment process are different finish lines.
Use one protocol for every trial: connect representative data, establish identity and tenant authorization, reproduce one dashboard, match required brand surfaces, test loading and denial states, generate an outbound artefact, verify mobile and accessibility behavior, and deploy it through your normal release path. Record elapsed team time, vendor assistance, unresolved work, and dependencies.
The result may reflect architecture and existing skills, but it belongs to your implementation rather than to a platform category. The commercial question is whether shortening that measured path changes a launch, deal, or renewal; the customer-facing analytics guide helps identify that demand signal.
Five Ways an Embedded Analytics Choice Goes Wrong, All of Them Reasonable at the Time
Mistake one: reaching for the internal BI tool you already own
The reasoning is sound and the conclusion is wrong. You already pay for Looker or Tableau or Power BI, somebody knows it, and it draws charts. So why buy anything.
Because an internal BI workflow and a customer-facing product have different readers, identity paths, branding surfaces, mobile tasks, accessibility obligations, and performance budgets. Measure those differences on the implementation; an iframe alone does not establish a load time or user experience.
The cost side is harder to state honestly than most comparisons admit. Tableau publishes from $15 per user per month for licensed staff. Looker and Sisense publish nothing and cannot be budgeted before a sales cycle. So the true answer is that nobody, including us, can tell you the multiple. What we can tell you is that the per-user meter is the wrong shape when the users are your customers, and that is a structural point rather than a price comparison.
The workable arrangement is usually both: purpose-built for the customer-facing dashboards, and keep the internal BI for the analysts who wanted it in the first place.
Mistake two: the licence is free and nothing else is
Metabase, Grafana and Superset are free to licence, and that is the only part of the cost that is free.
The comparison is not a licence fee against zero. Record infrastructure invoices, loaded time for upgrades and incidents, backup and restore tests, security work, tenant and embedding customization, and support. Use the same scope for hosted options, where internal integration and product work also remain.
Mistake three: building it, when analytics is a feature rather than the product
The build case includes the initial product surface plus permanent ownership of query behavior, tenant controls, responsive interaction, accessibility, exports, schedules, observability, upgrades, and support. Estimate it from a named scope and a measured production slice.
Build can be appropriate when the resulting capability differentiates the product or requirements cannot be met another way. Buy can be appropriate when a platform satisfies the contract at lower total ownership cost. Customer renewal value is useful evidence, not a universal pass/fail rule.
Mistake four: the licence fee is the line that matters least
The lines teams leave out are always the same ones: ongoing maintenance, DevOps time on self-hosted, training and onboarding, integration complexity, and what it would cost to leave.
A three-year worksheet you can actually fill in
There is no three-year total per vendor here. Seven of the platforms on this page publish no price, so any total we showed you would be our guess dressed up as arithmetic, and the guess would be ours to make in our own favour. Run these five lines instead, once per shortlisted vendor:
- Licence. The published figure where there is one, the quoted figure where there is not. Ask for the renewal uplift in writing at the same time; that is the line that moves.
- The meter, projected three years out. Work out what this vendor's meter will read then rather than today, and note that the meters count different things: licensed users for Tableau and Metabase, provisioned node-hours for Power BI Embedded, metric series and active users for Grafana, monthly active users and deployed solutions for Luzmo, workspaces for GoodData, credit-consuming actions for Domo, and for Sumboard, dashboards and scheduled emails rather than viewers. Your customer count enters this line only where the vendor's own quote says it does.
- Integration. Engineer-weeks to first production dashboard, at your loaded cost.
- Running cost. For self-hosted this is hosting plus the share of an engineer who upgrades, patches and answers pages for it. For hosted platforms the infrastructure is the vendor's, but your side is not zero: someone still maintains the data connection, updates models when your schema changes, and handles support questions your customers raise about the dashboards. Count that share honestly for both.
- Exit. How much of your metric logic lives in the vendor's modelling layer, and what rewriting it elsewhere would take.
Line 2 is the one teams skip, and it is usually the one that decides the answer.
For Sumboard, read the current plan, included limits, and meter directly from Sumboard pricing on the evaluation date. Project the same three-year scenarios used for every vendor. Infrastructure operation is on our side, but your internal integration, data connection, model changes, dashboard ownership, and customer support are not zero.
Mistake five: a longer feature list is not a better embedded product
The feature-count trap is assuming that a longer checklist produces a better embedded product. Enterprise BI platforms expose far more surface than most customer-facing deployments use, and every unused modelling or administration layer still adds something to learn, configure, or maintain.
Choose by the job the platform was designed to perform:
- Customer-facing analytics: Sumboard, Luzmo (optimized for embedding)
- Internal BI: Metabase, Mode, Looker (optimized for analysts)
- Monitoring: Grafana (optimized for time-series)
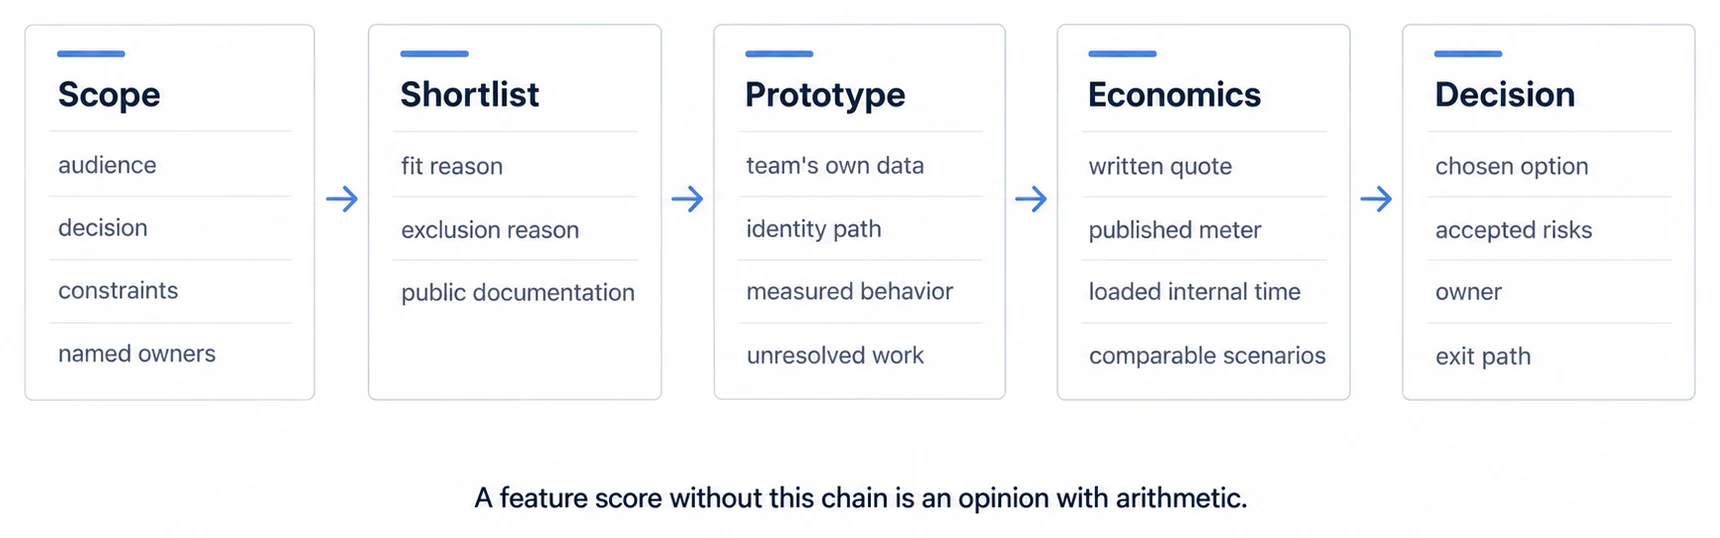
A Five-Stage Evaluation Where Each Stage Leaves Evidence the Next One Uses
Step one: write down what you actually have, not what you want
Three things decide most of this before any vendor is involved, and it is worth writing them down because they are easy to argue with later.
What the deployment is for. Name the audience, the decision or workflow analytics must support, the consequence of failure, and whether launch depends on it. Company size is only a weak proxy for those facts.
What the analytics are for. Internal use by your own team, customer-facing use inside your product, or monitoring and observability. These three want different platforms and the mistake is treating the question as one question.
What is non-negotiable technically. Define the identity and tenant path, required brand surfaces, accessibility target, performance test, export and scheduling needs, residency constraints, and release deadline. Then name who owns data modelling, dashboard changes, incidents, upgrades, and customer support.
Ownership is where many shortlists fail. A team with high maintenance tolerance on paper and no named operator in practice has not accepted the maintenance contract.
Step two: the category usually falls out of step one
If customer-facing delivery is the job and nobody owns a broad BI estate, purpose-built embedded platforms deserve the first prototype. If a governed semantic layer, existing content estate, and trained BI operators are already valuable, enterprise BI deserves one. Open source belongs on the shortlist when named owners accept hosting, upgrades, security, backup, and incident work. Monitoring workloads should begin with monitoring tools. A Microsoft identity and data estate makes Power BI Embedded operationally relevant, but it still needs the same measured prototype and commercial scenarios as every other option.
Step three: trials get wasted on tutorials, so integrate instead
Trials get wasted on tutorials. Five things are worth doing with the software rather than watching:
Integrate it, properly, with your own data rather than the sample set. Load it at production scale, because performance problems do not appear on demo volumes. Open it on a real phone. Verify multi-tenant isolation yourself, including what happens when the tenant claim is missing. And ask support a genuinely technical question, then measure how long the answer takes and whether it is any good.
Four questions are worth asking the vendor, and the value is in how they are answered as much as what is said:
"Show me your documentation right now", which tells you whether it exists in the form they described. "What is your customer churn rate", which most vendors will decline, and the declining is informative. "Can I speak to two or three reference customers." And "what is the total three-year cost at our expected scale", which is the one that separates a published price from a negotiation.
Step four: run the same five-line cost formula for every shortlisted platform
Use the same five-line formula for every shortlisted platform:
TCO = (Platform Cost × 36 months)
    + Implementation Costs
    + Training Costs
    + Maintenance Costs (monthly × 36)
    + Opportunity Cost (delayed revenue)
Fill each line with a published figure, a written quote, or your own loaded engineering cost; do not mix those evidence types without labelling them:
Option A: a quote-only platform (Looker, Sisense, GoodData, Reveal)
- Platform: the quoted annual figure × 3. You have to ask for it; none of these publish one
- Implementation: whatever professional services are quoted alongside, which for a semantic-layer platform is usually a separate line
- Training: the modelling language has a learning curve, so count the weeks
- Maintenance: whoever owns the model owns it for three years
- Ask for the renewal uplift in writing before you total this. It is the line most often left out
Option B: Sumboard
- Platform: record the current plan, included limits, meter, billing period, and renewal terms from Sumboard pricing, then apply the same three-year usage scenarios used for every option
- Hosting, platform upgrades, and uptime: ours. Your side is integration, the data connection, model changes, dashboard ownership, and customer support, so budget that share rather than entering zero
- Test plan changes at every relevant dashboard, delivery, or other published limit instead of assuming today's plan remains the right one
Option A is left for you to fill in. Without your quote, any figure there would be a guess in our own favour on a page you are reading to make a decision.
Step five: almost every good signal is about access, not about features
Choosing gets easier if you notice that almost every good signal is about access rather than about features. A published price, a trial you can start without a credit card, documentation you can read now, reference customers you can call, and security and compliance documentation that exists in written form. None of those tell you the product is good; all of them tell you the vendor expects to be checked.
The warning signs are the same list inverted, and they compound. Contact-sales as the answer to every question, no published price, documentation gated behind a call, no reference customers, a total cost nobody will help you construct, multi-year lock-in, and a refusal to discuss churn. One of those is normal. Four of them together describe a purchase you will only be able to evaluate after you have made it.
Two more that belong on the list and are usually missed: whether the pricing still fits three years out at your expected scale rather than today's, and whether the integration timeline matches when you actually need this live.
Five situations, and what actually decides each one
The five profiles below are not really about industry. Each one has a single binding constraint, and naming it explains the recommendation better than the recommendation does.
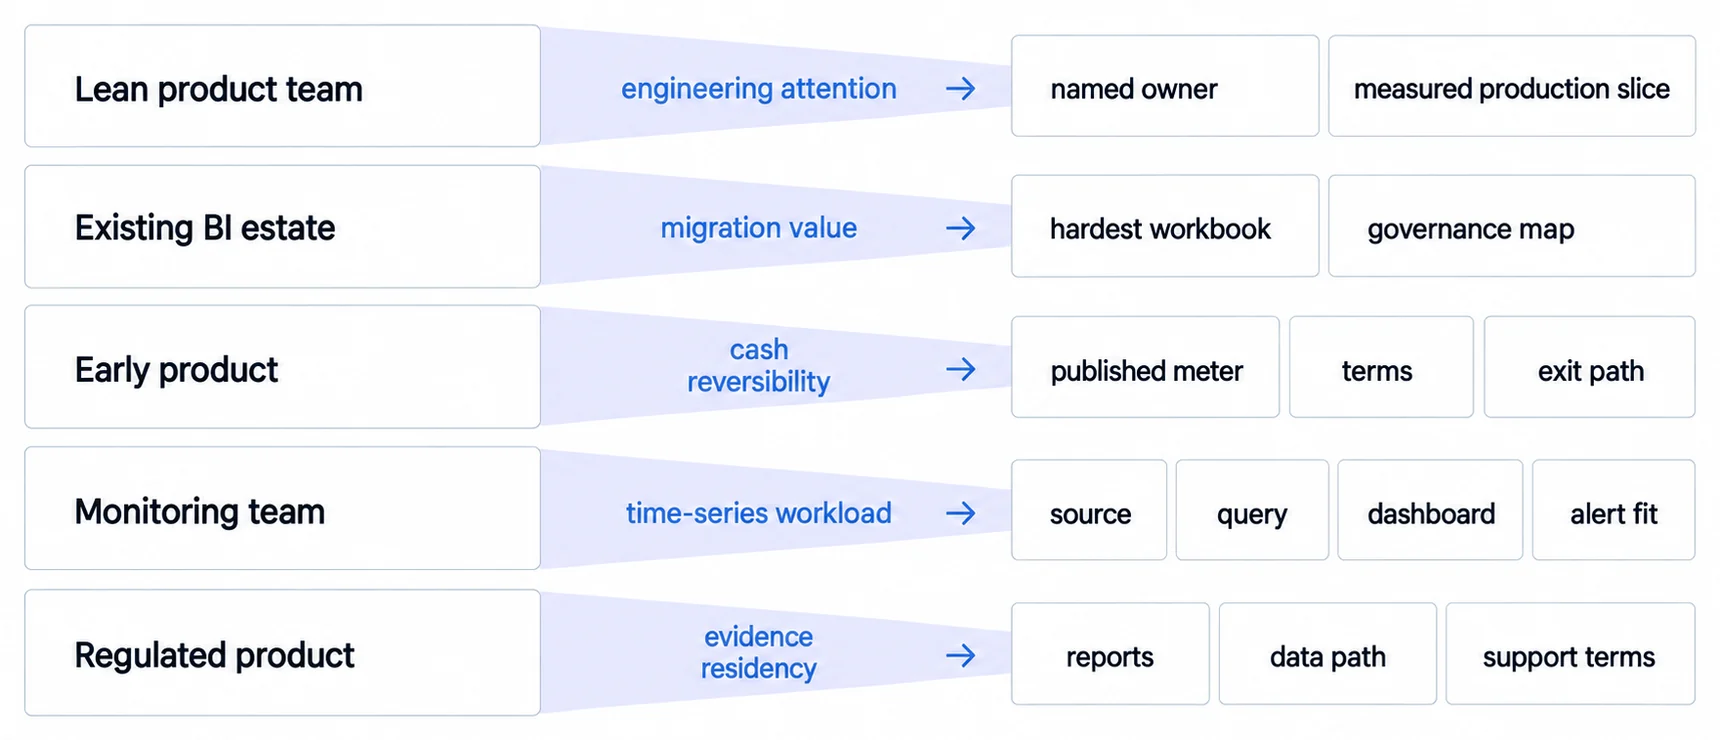
A lean B2B SaaS product team is constrained by engineering attention. Multi-tenant security and product-level brand continuity may be non-negotiable while analytics operations remain unstaffed. Purpose-built platforms deserve the first prototype; a broader modelling and governance layer belongs on the shortlist only when the team can name the value and owner for it. Quote-only pricing is an unknown, not proof that a platform is too expensive.
A company with an established BI team and content estate is constrained by migration value and governance complexity. Enterprise platforms can make sense when the semantic layer, permissions, trained operators, and existing workbooks are assets the embedded product should reuse. A purpose-built platform is still worth prototyping when customer experience and a smaller operating surface matter more than modelling depth.
An early product team is constrained by cash, attention, and reversibility. A published meter, hands-on evaluation route, clear cancellation terms, and an exit path reduce uncertainty. A sales conversation or annual commitment may still be justified, but only when the prototype and written commercial terms earn that loss of flexibility.
DevOps and SRE teams doing monitoring are constrained by the data type. Grafana is built for time series and integrates with Prometheus and InfluxDB natively, and this is the one profile where our own platform is the wrong answer along with Looker and Tableau. Business analytics tools handle monitoring badly for the same structural reason monitoring tools handle business analytics badly.
A regulated product is constrained by where data may live and what controls can be evidenced. Required reports, residency, encryption, identity, audit, incident, recovery, and support terms should be written acceptance criteria. A managed vendor supplies only the controls in its service boundary; a self-hosted platform makes your team responsible for proving the rest. Get the data path and support commitments in writing.
A Twenty-One Day Evaluation, With Five of Those Days Spent With the Product Running
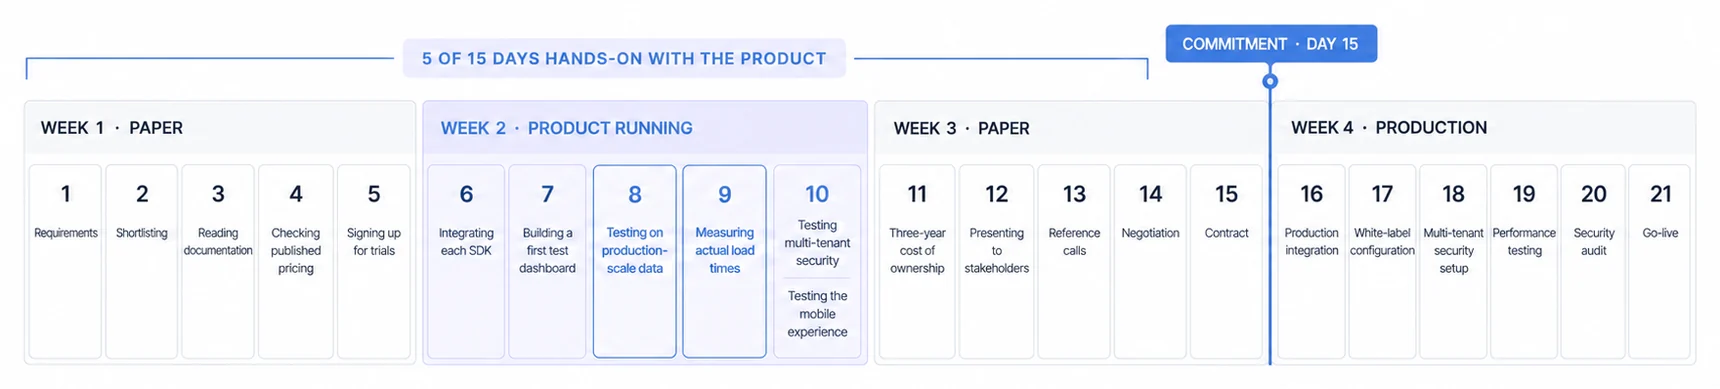
The shape of the plan below is worth noticing before the detail. Of the fifteen days that run before a decision is made, only five are spent with the software actually running. That ratio is the usual failure: evaluations fill up with documentation review, demos and internal alignment, and the part that would have told you the answer gets two afternoons.
Week one: the first two days belong to you, not to any vendor
Days one and two are yours rather than any vendor's. Decide whether this is internal or customer-facing, since that one answer removes most of the field. Write down company size, budget and the technical resource you actually have rather than the resource you could theoretically assign. List the features that are genuinely must-have, which for customer-facing work usually means multi-tenancy and white-labelling.
- Define the use case: internal or customer-facing
- Document company size, budget and real technical resource
- List must-have features, honestly
Days three to five turn that into a shortlist of two or three. Read each platform's documentation before speaking to anyone, because documentation quality is a leading indicator of what support will be like, and check what pricing is public, since that determines whether the next two weeks involve a negotiation.
- Shortlist 2-3 platforms against the requirements
- Read the documentation for each
- Check public pricing, and note who has none
- Start free trials, and book demos only where a trial is not offered
Week two: the part that decides it
This is the week that matters, and it is the one most often compressed.
- Integrate each SDK for real, not in a tutorial
- Build a first dashboard on your own data
- Load it at production scale and measure the load times yourself
- Test multi-tenant isolation, including what happens with no tenant claim
- Open it on a real phone
- Read the security and compliance documentation
- Ask each vendor a hard technical question and time the reply
Every one of those produces a fact rather than an impression, which is the difference between this week and the demos.
Week three: a three-year total only means something next to a reference call
- Work the three-year total for each option using the five lines above
- Compare it against a realistic build estimate
- Put the findings in front of the people who have to live with the choice
- Speak to reference customers
- Negotiate where there is a negotiation, and read the contract terms
- Decide, and either sign or start on the free tier
Week four: production is where the evaluation gets its real answer
- Production integration
- White-labelling configured, including PDF exports and scheduled email
- Multi-tenant security set up and verified
- Performance testing at expected load
- Security audit
- Go live, watch performance, collect what users say
Treat the four-week sequence as an evaluation protocol, not a category-wide deployment promise. Keep requirements, prototype evidence, commercial scenarios, and the decision record on schedule; derive the production date from unresolved work in the representative slice. If production exceeds the evaluation window, week four is the start of an evidenced project plan rather than a fictional go-live date.
Vendor-by-Vendor Comparisons, If You Already Have a Name in Mind
Researching specific tools? These deep-dive comparisons cover the most common vendor evaluations:
- Looker alternatives for embedded analytics
- Embedded analytics guide, if you are earlier than the shortlist stage
- Metabase alternatives, and when a switch is justified
- Sisense alternatives, with the migration and rollback path
- Tableau against Power BI, compared on licence and stack
- Power BI against Looker, compared for a product team
- Grafana against Metabase, compared on workload and ownership
- Domo alternatives for B2B SaaS analytics
Which Embedded Analytics Alternative Fits Depends on Size, Resources, and Timeline
Choosing the right embedded analytics platform comes down to three factors: your company size, technical resources, and deployment timeline.
If you're a B2B SaaS company (50-500 employees) that needs:
- Customer-facing analytics shipped this month (not next quarter)
- Predictable flat pricing (not "contact sales" or usage surprises)
- Purpose-built embedding (not repurposed internal BI)
- No infrastructure to run, so your team's remaining work is the data connection and the dashboards rather than the platform underneath
Ready to launch customer-facing analytics?
Stop losing customers to competitors with better analytics. Sumboard's customer-facing analytics platform lets you launch self-service dashboards in days, not months.