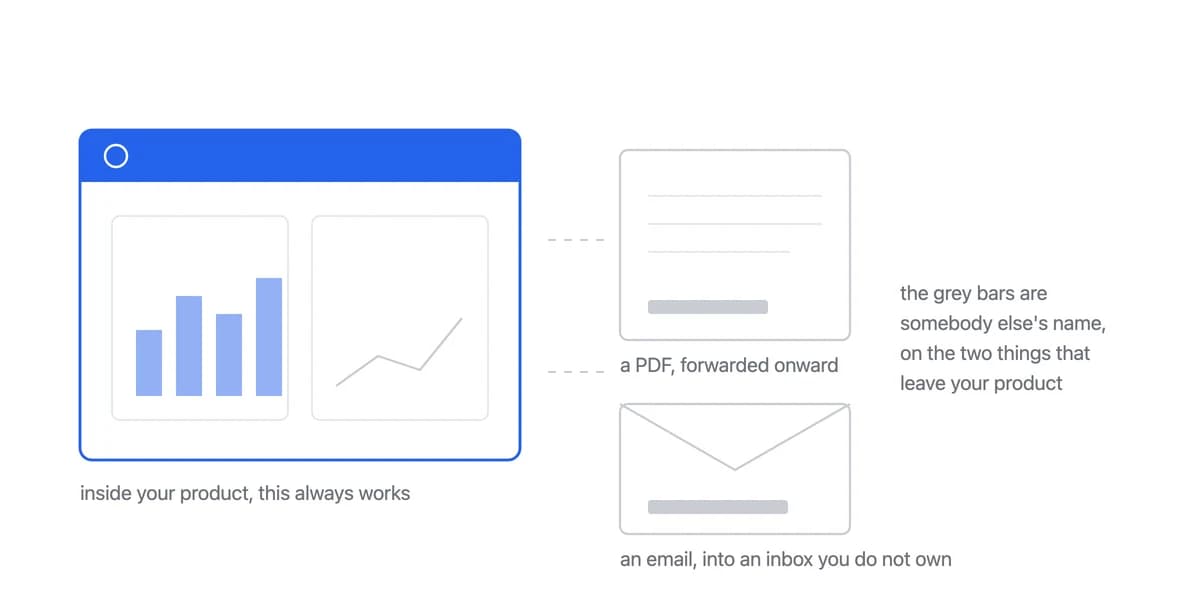
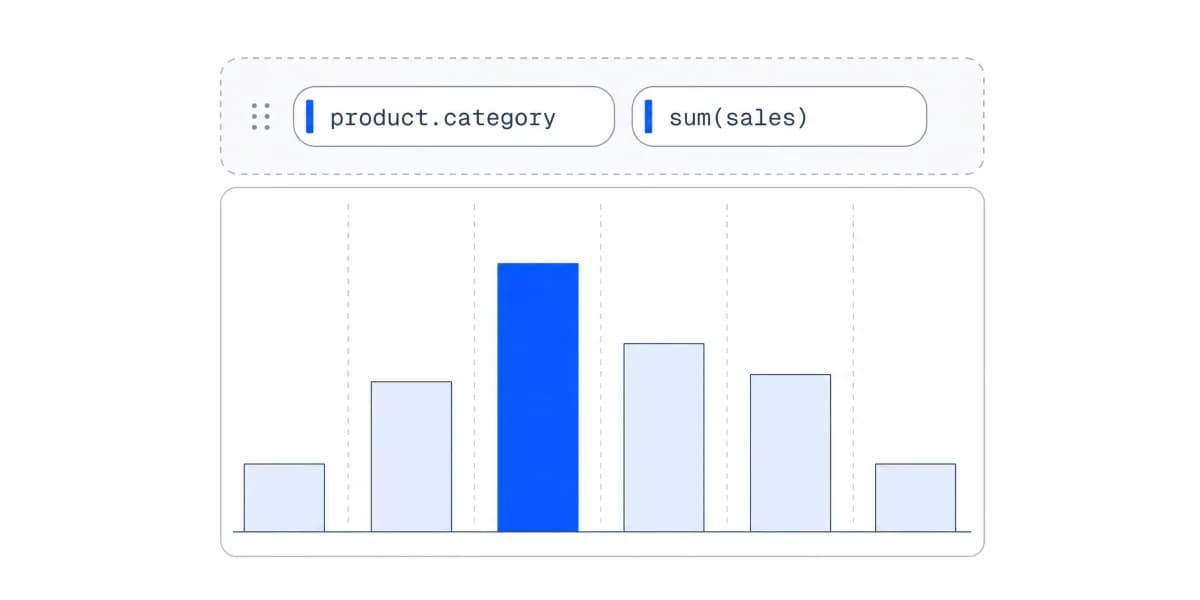
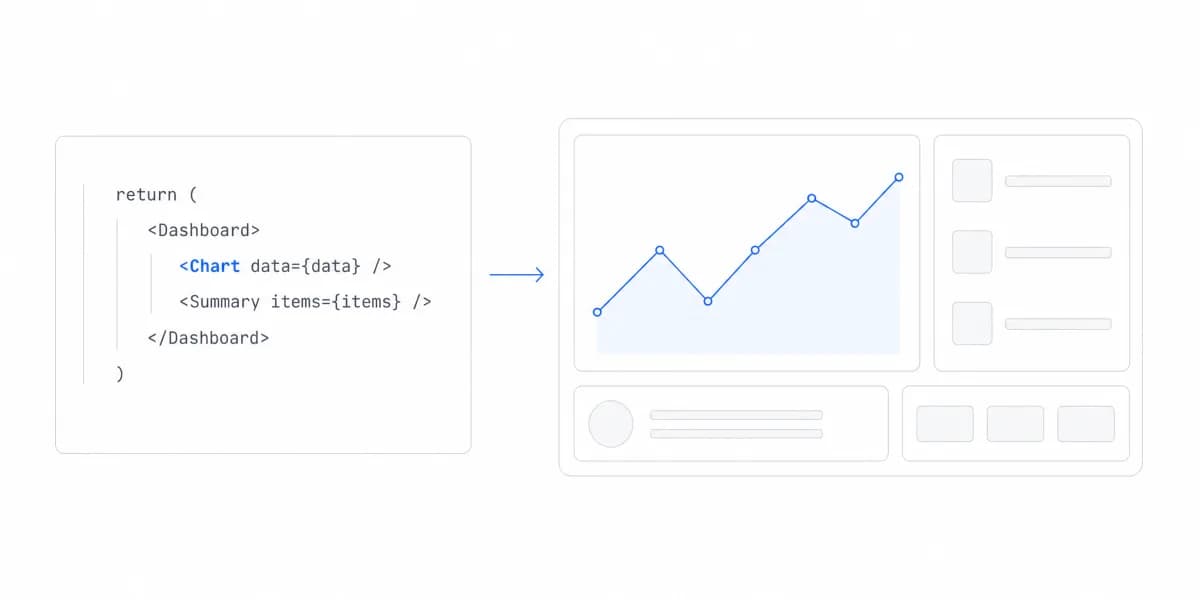
Embedded analytics is the integration of data analytics capabilities directly into your software application, making insights available to your customers within your product's interface.
This guide covers the whole decision, in the order you actually meet it: what embedded analytics is and how it differs from the internal BI your team already runs, why customers now expect it, the three types you can ship and which one to start with, the three ways to implement it and what each costs in calendar time, how to decide between building and buying, the four things that genuinely set your launch date, the criteria to screen vendors on, how the platforms compare, and a step-by-step roadmap from strategy to rollout. Every vendor price below carries a source and the date it was checked, because pricing in this category moves and an undated figure is worth nothing.
What is embedded analytics?
Think of embedded analytics as giving your customers a window into their data without forcing them to leave your application. Instead of directing users to external reporting tools or requiring them to export data for analysis, embedded analytics brings the insights directly to where your customers already spend their time. A purpose-built embedded analytics platform makes that window feel native to your product.
This is not about creating another dashboard for your internal team. Embedded analytics is specifically designed for your customers, the people who pay for your software and generate the data that makes those analytics possible. In other words, it is customer-facing analytics for SaaS.

The evolution from internal to customer-facing
For decades, business intelligence tools were built for internal consumption. Companies would analyze their data internally, then share conclusions through reports, emails, or presentations. The data insights lived in a separate world from the products that generated them.
Embedded analytics flips this model. Instead of keeping insights locked away in internal tools, it surfaces the most valuable data directly to customers as a core product feature. This transformation has become a competitive necessity for modern SaaS companies.
How it differs from internal BI
Internal BI is built for employees and analysts who understand complex data models. Embedded analytics serves external users, your customers and partners, who need a simpler and more focused experience. Four differences drive almost every design decision:
- Audience: customers rather than internal teams
- Complexity: simplified rather than full-featured
- Branding: white-labeled rather than vendor-branded
- Security: multi-tenant rather than a single organization
Why your SaaS needs embedded analytics
The question is not whether your SaaS should offer analytics to customers, it is how quickly you can implement it. Four reasons have made it table stakes for modern software products.
Customer expectations have changed
Today's software users expect data transparency. They want to understand how their business is performing, what trends are emerging, and where opportunities exist. If your product collects customer data but does not provide insights back, you are missing a fundamental value proposition.
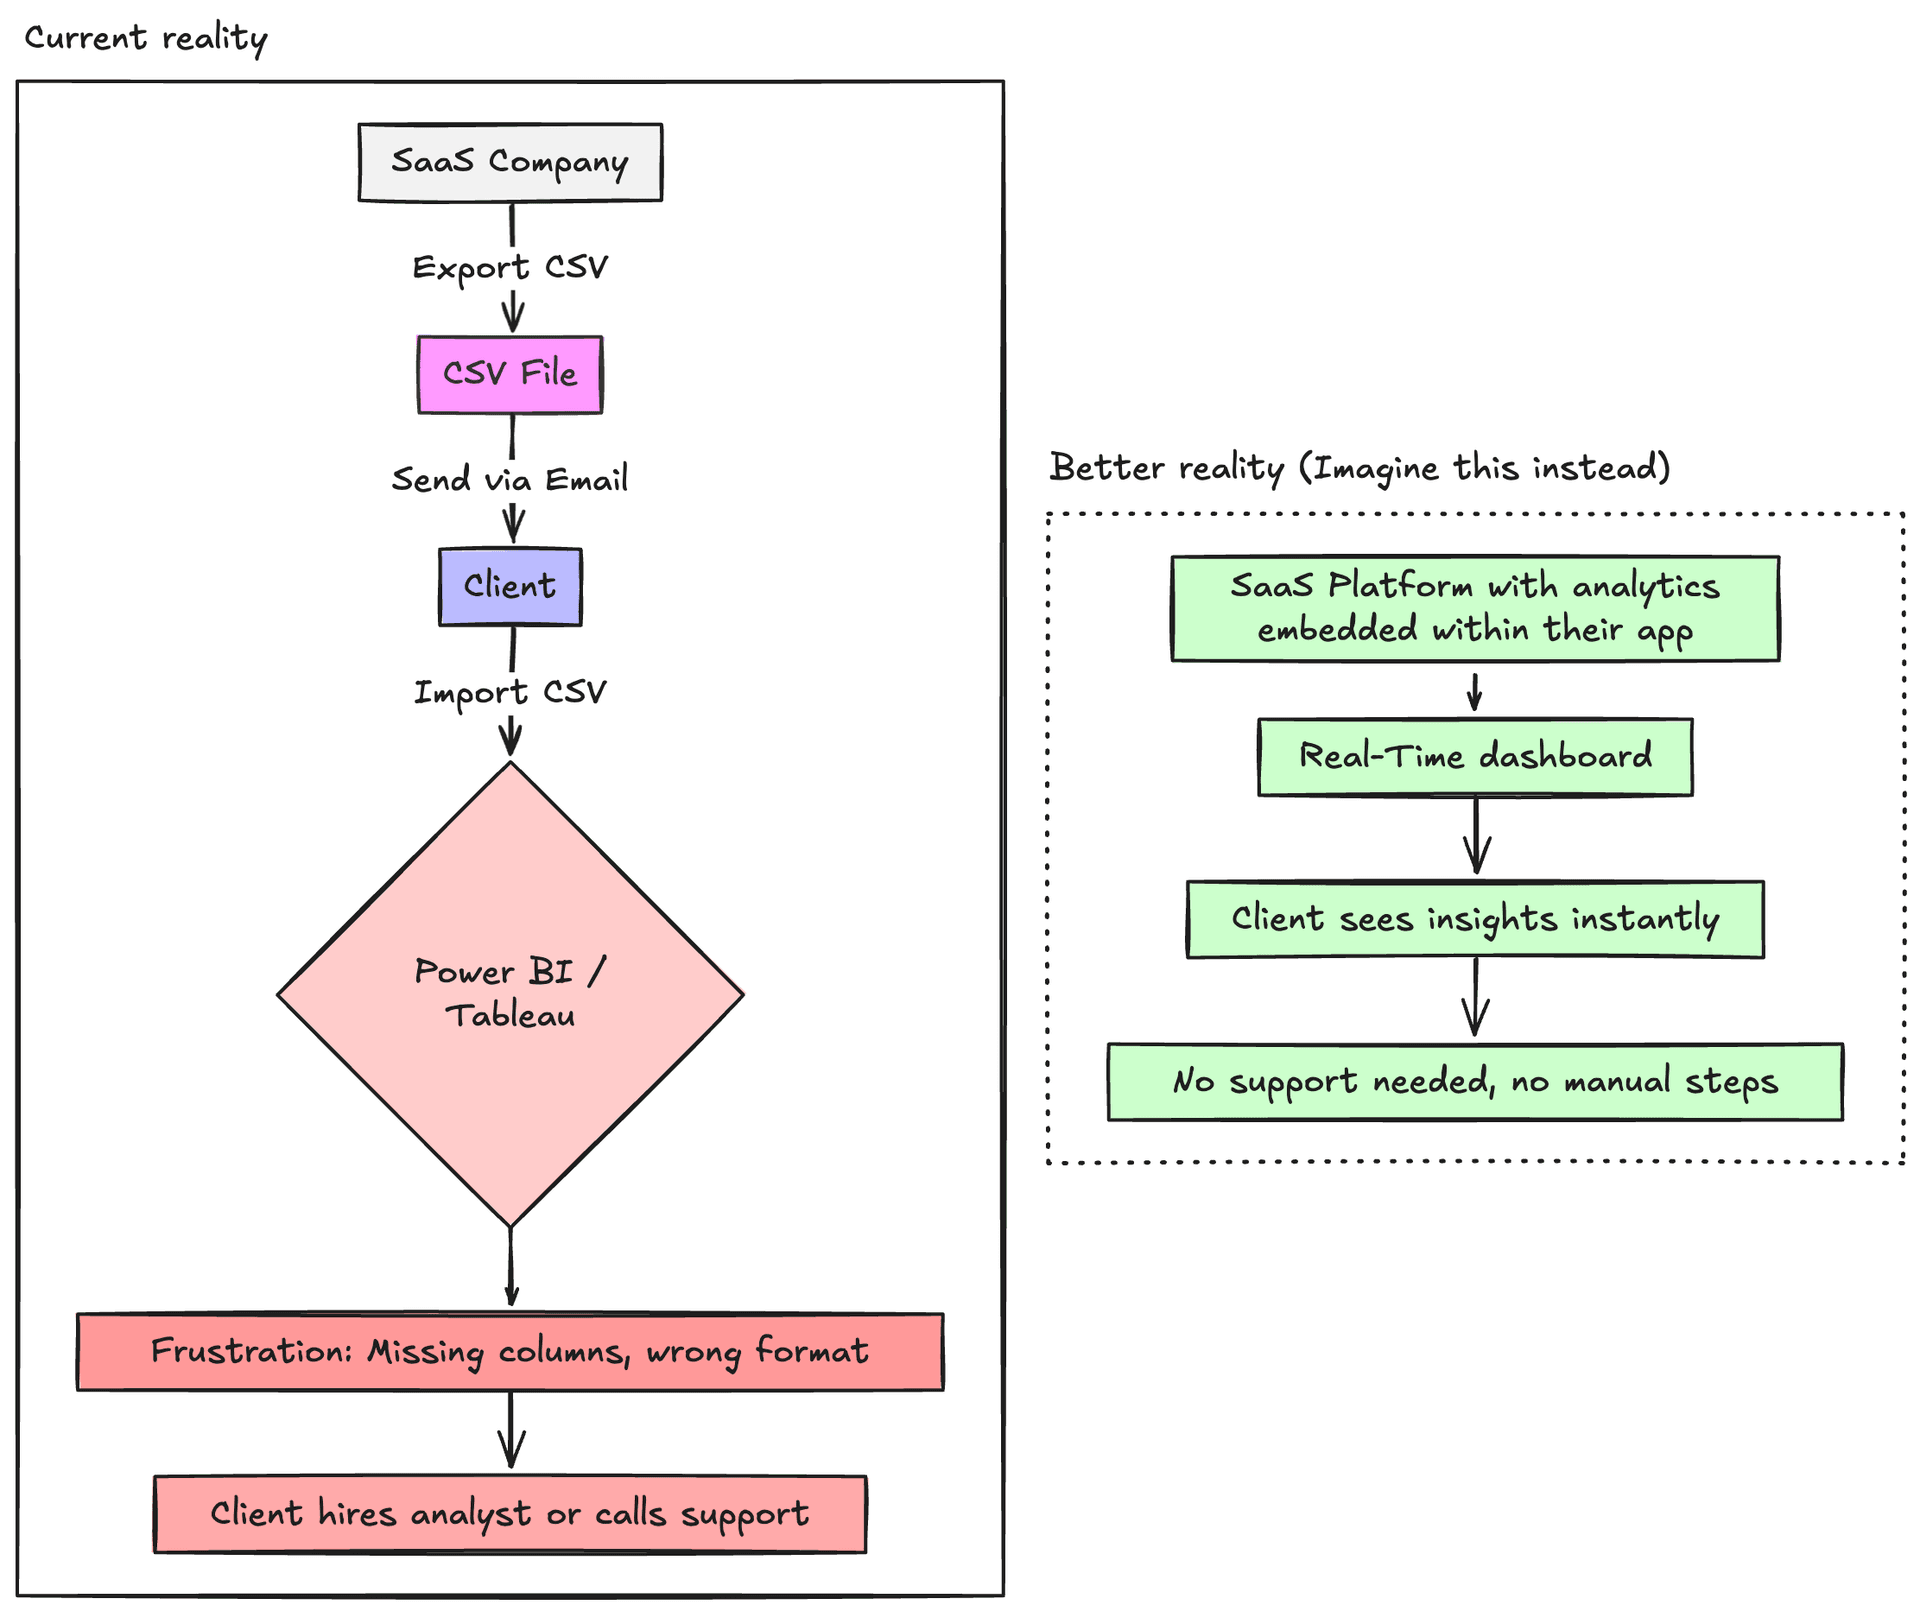
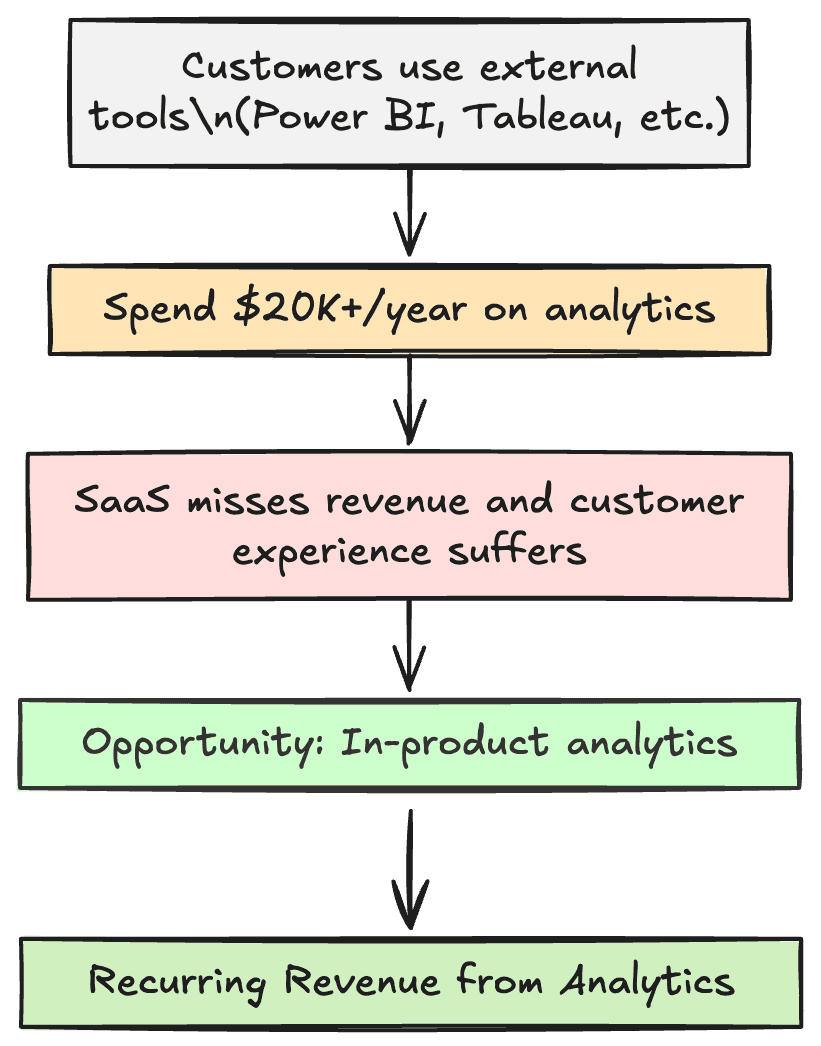
Many SaaS companies still export CSV files and email them to clients, who then import the data into Power BI or Tableau to build their own dashboards. This creates a headache on both sides: customers constantly request data exports, someone has to manually generate and send files, then clients struggle to import and visualize the data, often hiring data analysts or external services to do it. Imagine if Stripe sent you CSV files instead of their dashboards to understand your payment data. That is the reality for most SaaS customers today.
Competitive differentiation
In crowded markets, embedded analytics can be the feature that wins deals. When prospects compare solutions, the one that offers comprehensive insights alongside core functionality typically has a significant advantage.
Higher customer retention
Analytics create stickiness. When customers rely on your product not just for transactions but for understanding their business performance, switching costs increase dramatically. You become integral to their decision-making process.
Premium pricing opportunities
Advanced analytics features justify higher price points. Customers will pay more for software that provides actionable insights, especially when those insights directly impact their revenue or operational efficiency.
Types of embedded analytics
Not all embedded analytics are created equal. Understanding the different approaches helps you choose the right strategy for your product and customer needs.
Operational analytics
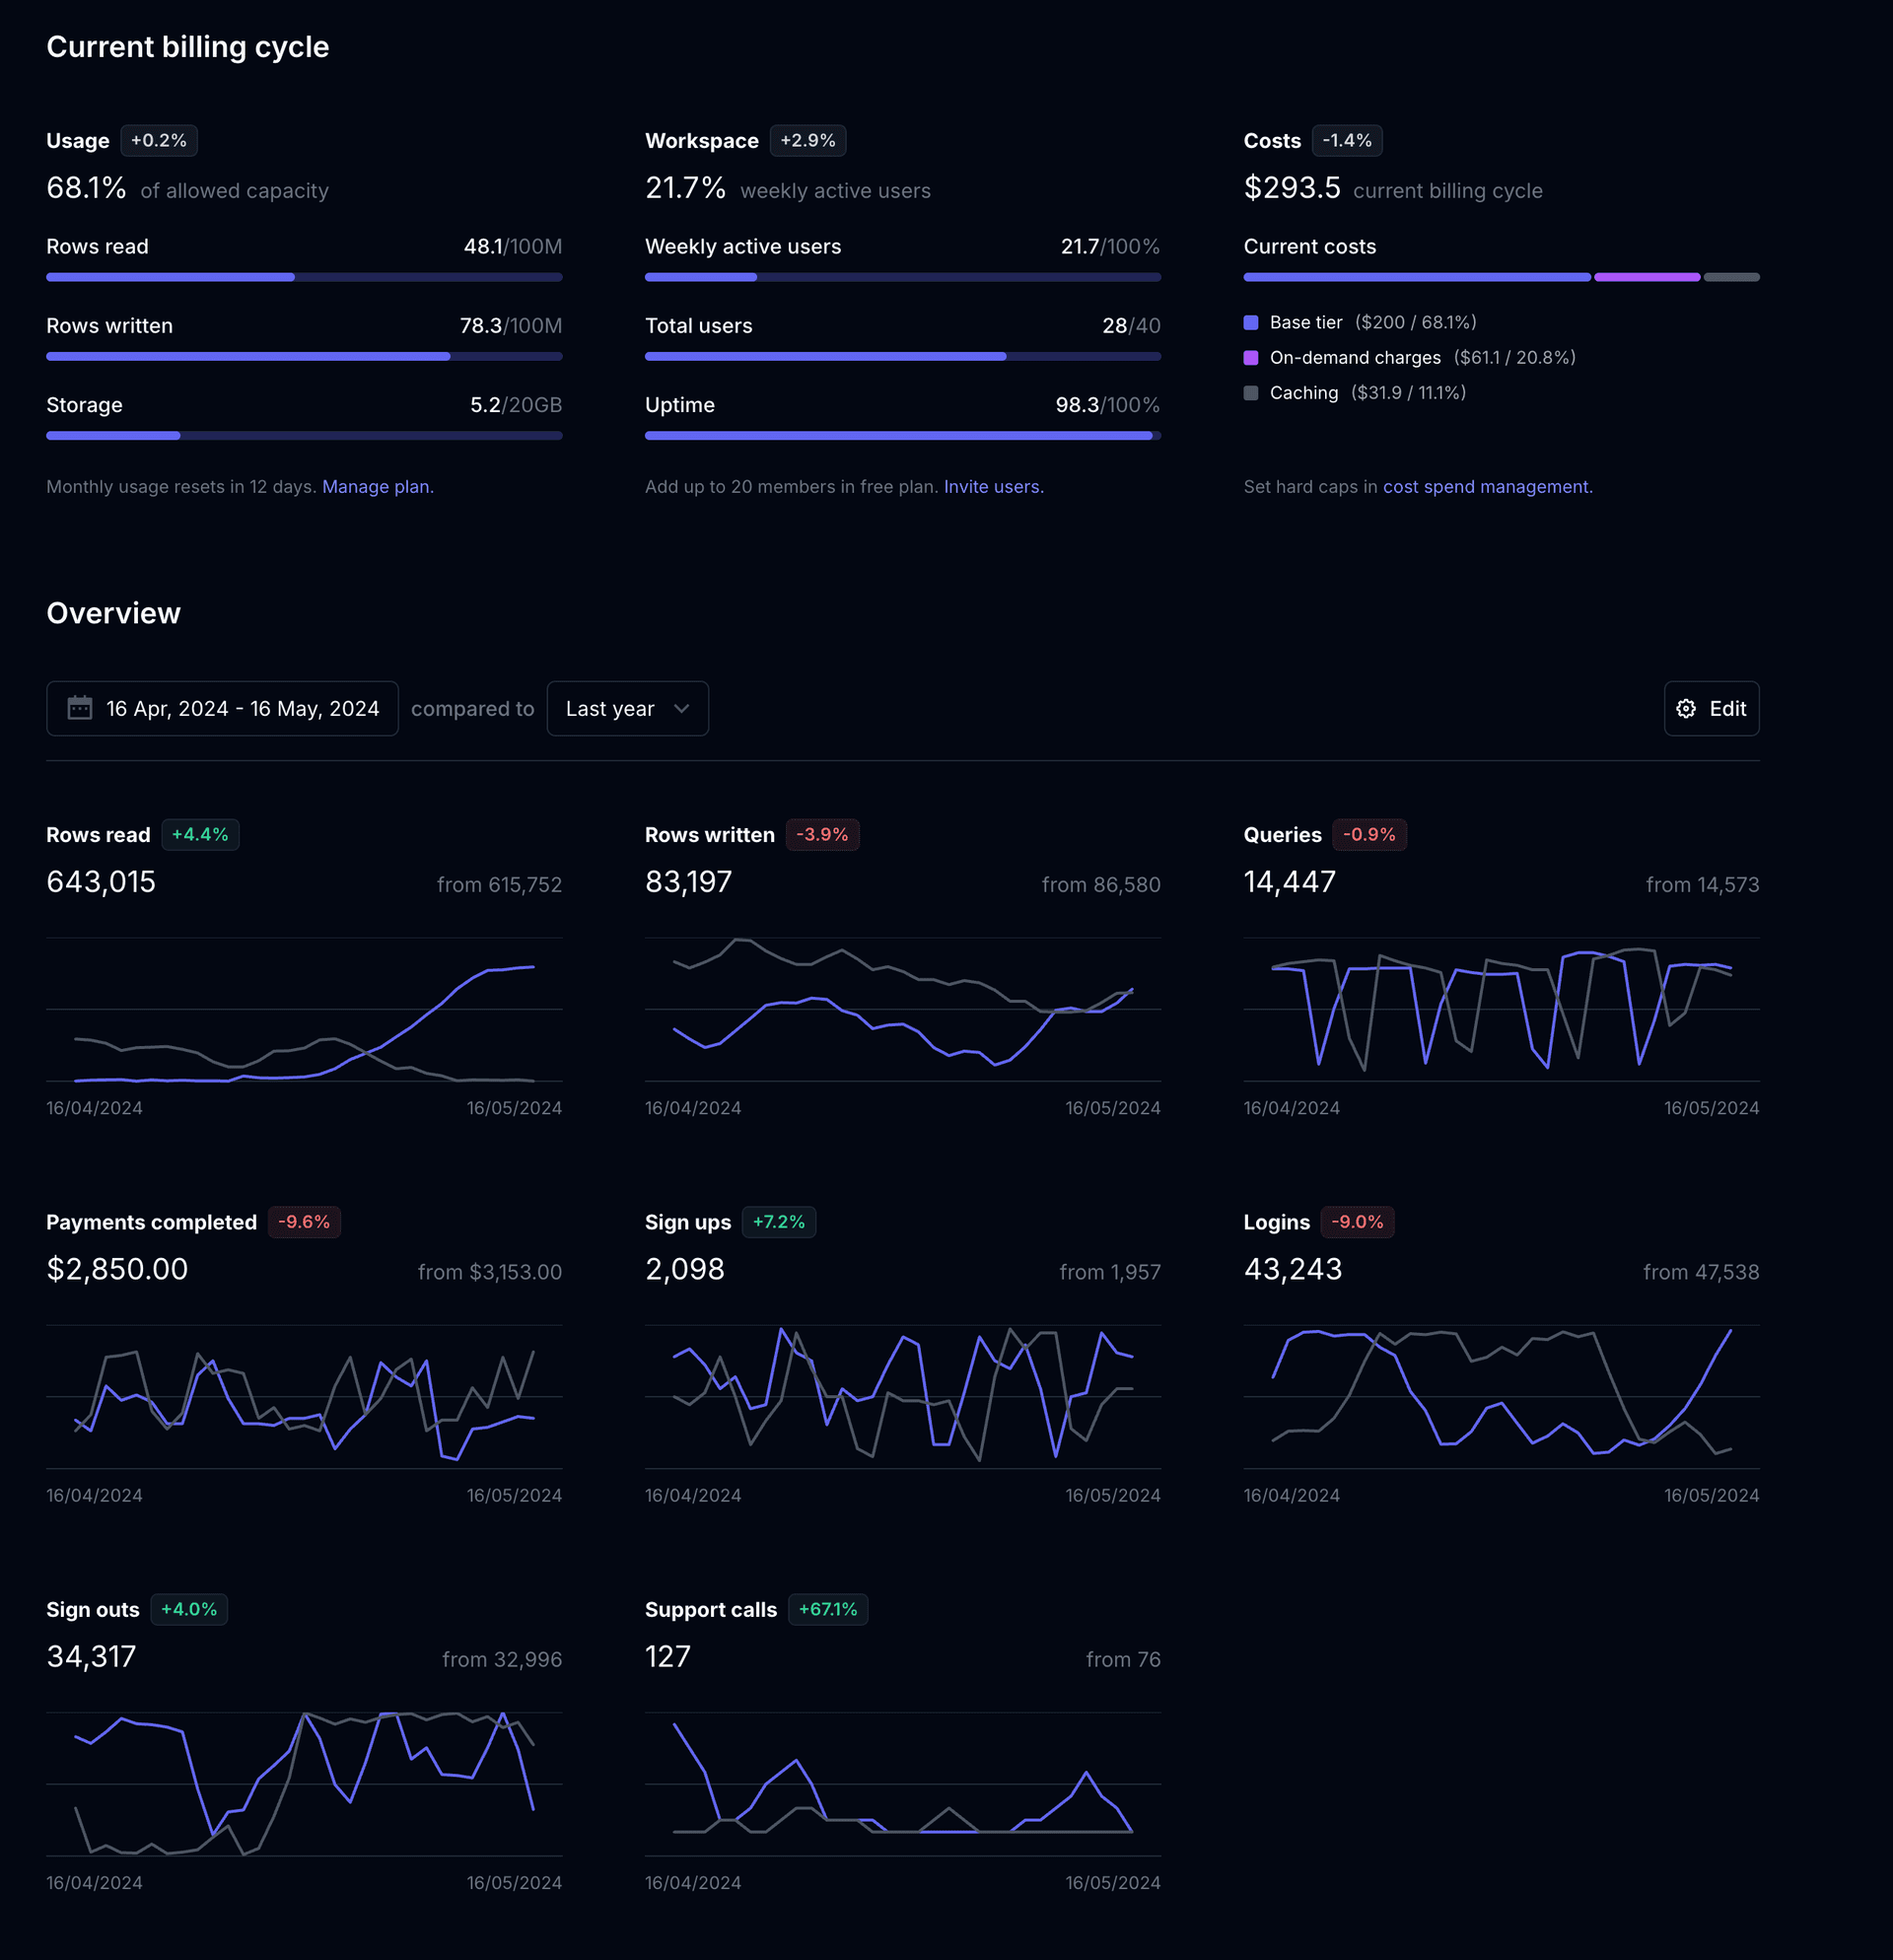
These are real-time metrics that help customers understand current performance and take immediate action. Think of Shopify's merchant dashboard showing today's sales, traffic sources, and top-performing products.
Common operational analytics:
- Real-time performance dashboards
- Usage statistics and trends
- System health and uptime metrics
- Current period versus previous period comparisons
Strategic analytics
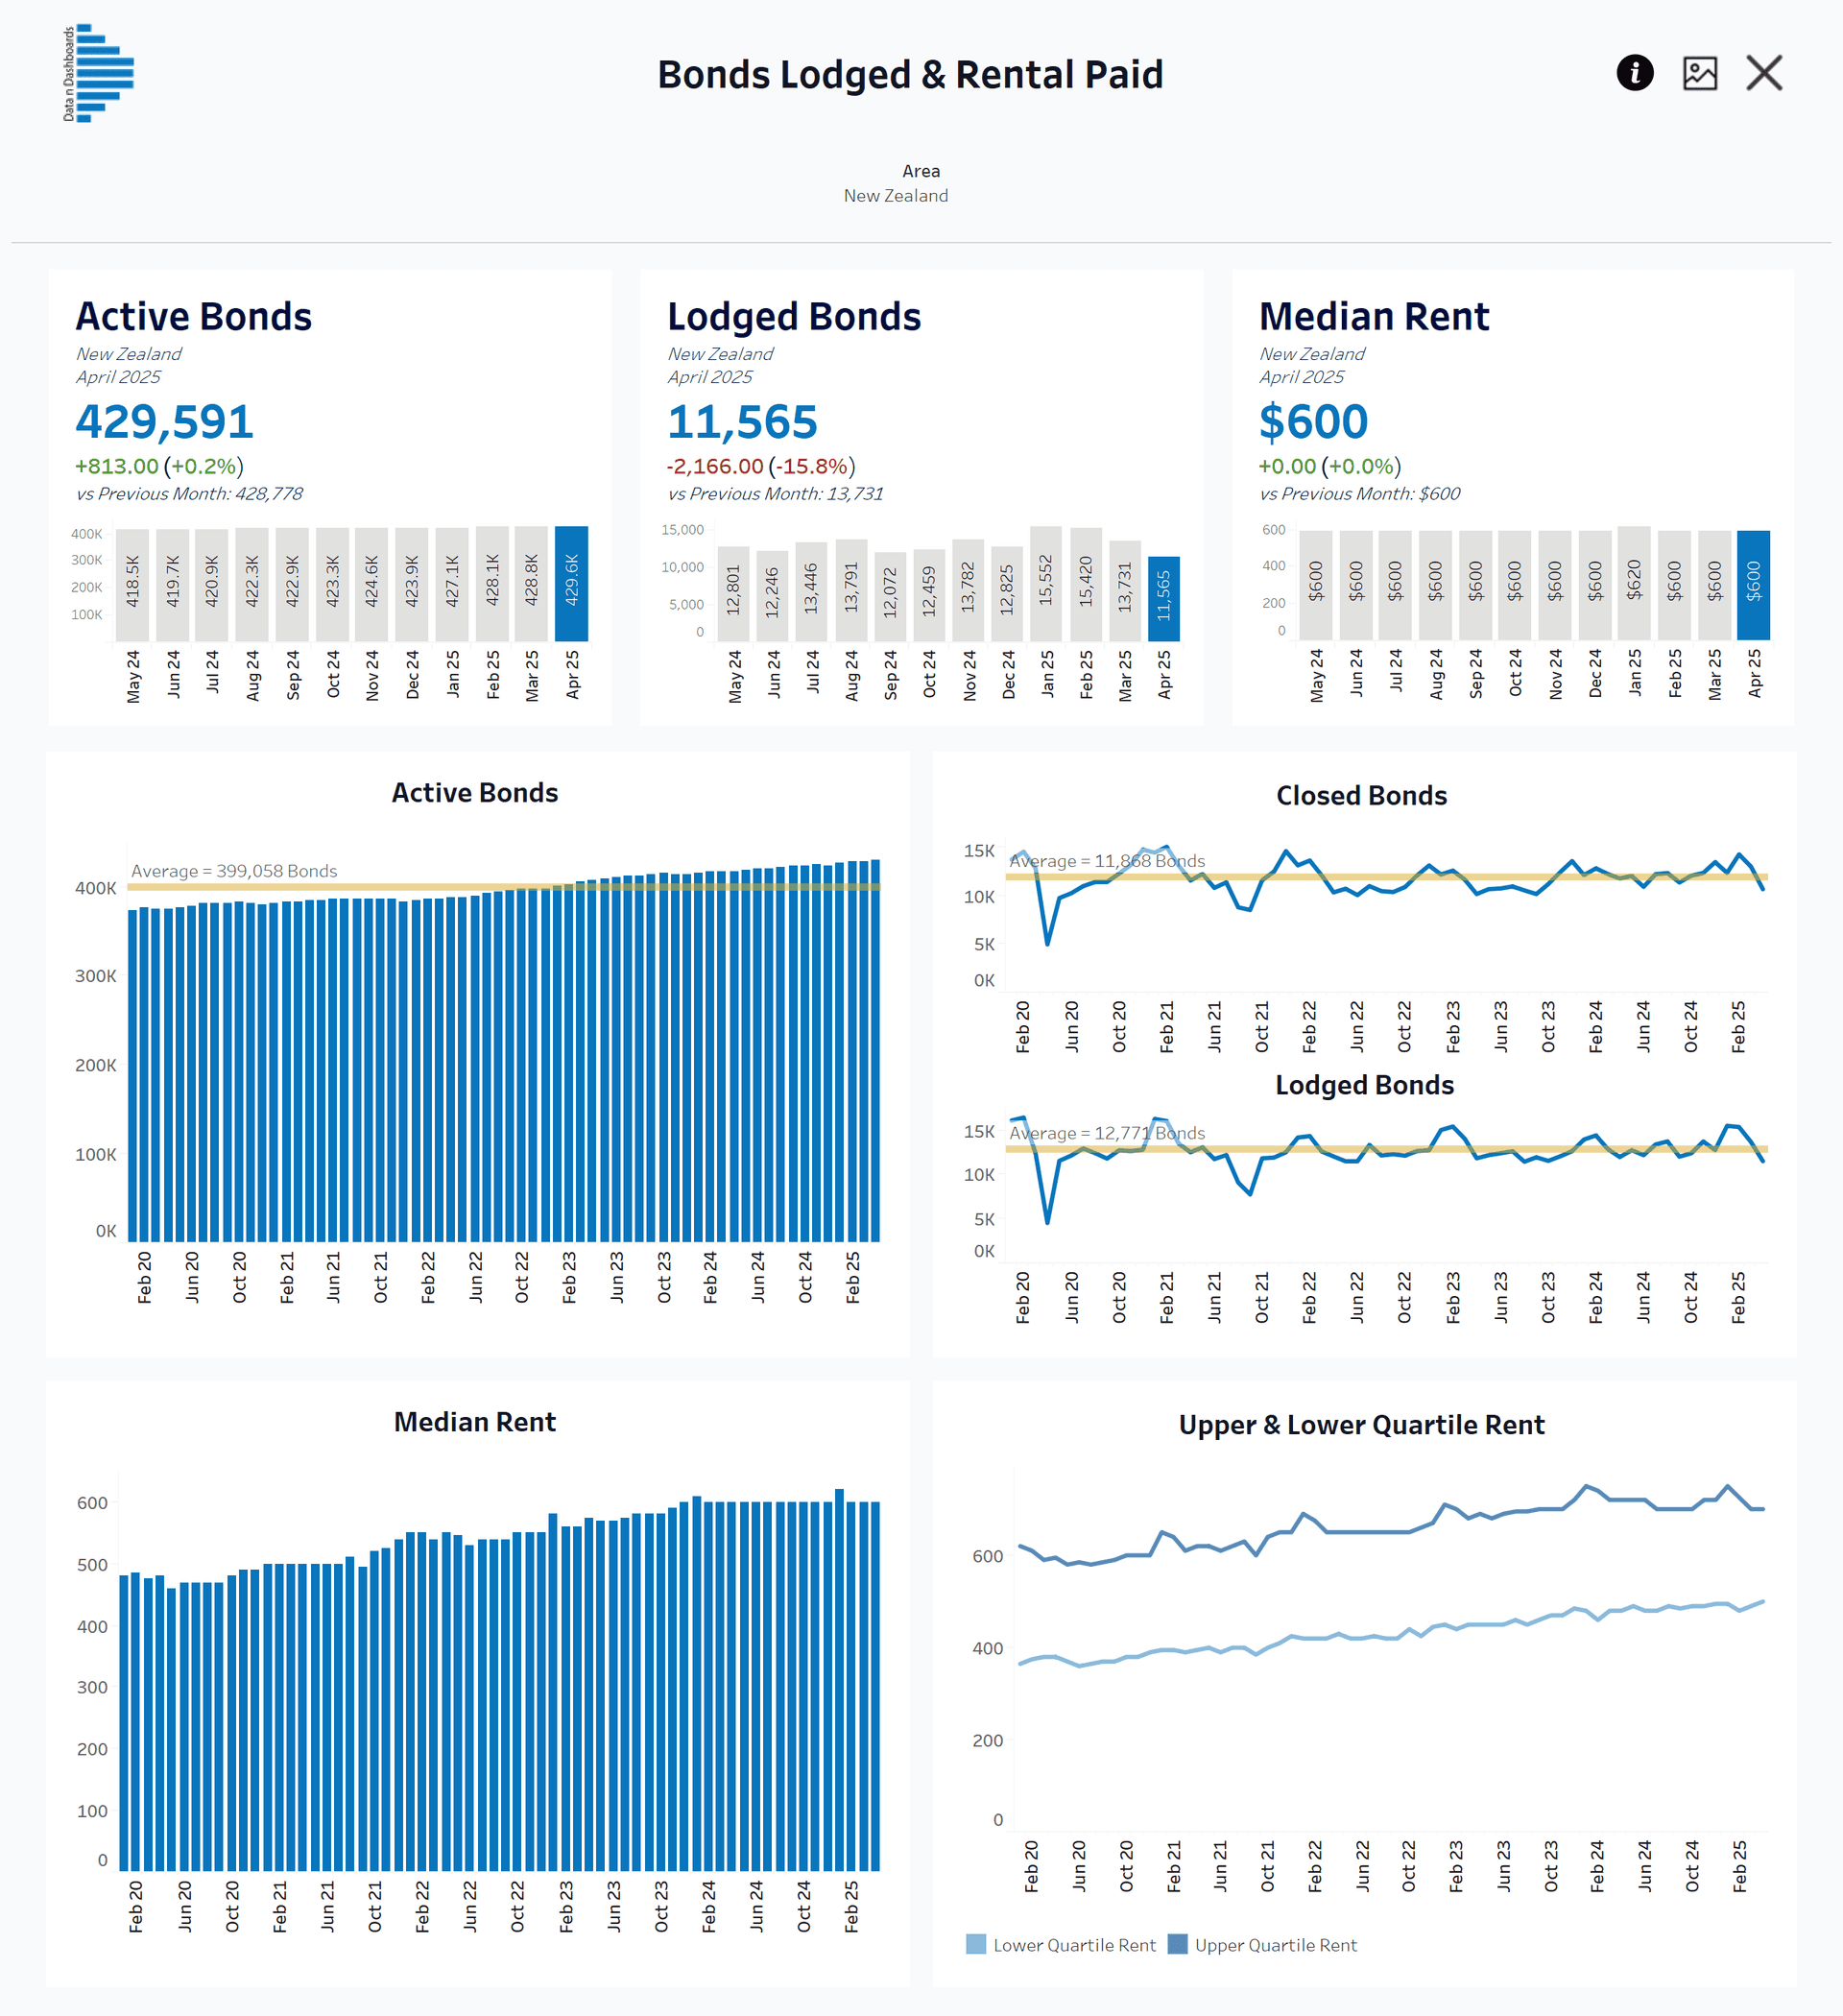
These provide longer-term insights that inform business strategy and planning. They typically involve historical data analysis, trend identification, and predictive modeling.
Common strategic analytics examples:
- Monthly and quarterly reporting
- Cohort analysis and customer lifetime value
- Market trend analysis
- Forecasting and predictive insights
Self-service analytics
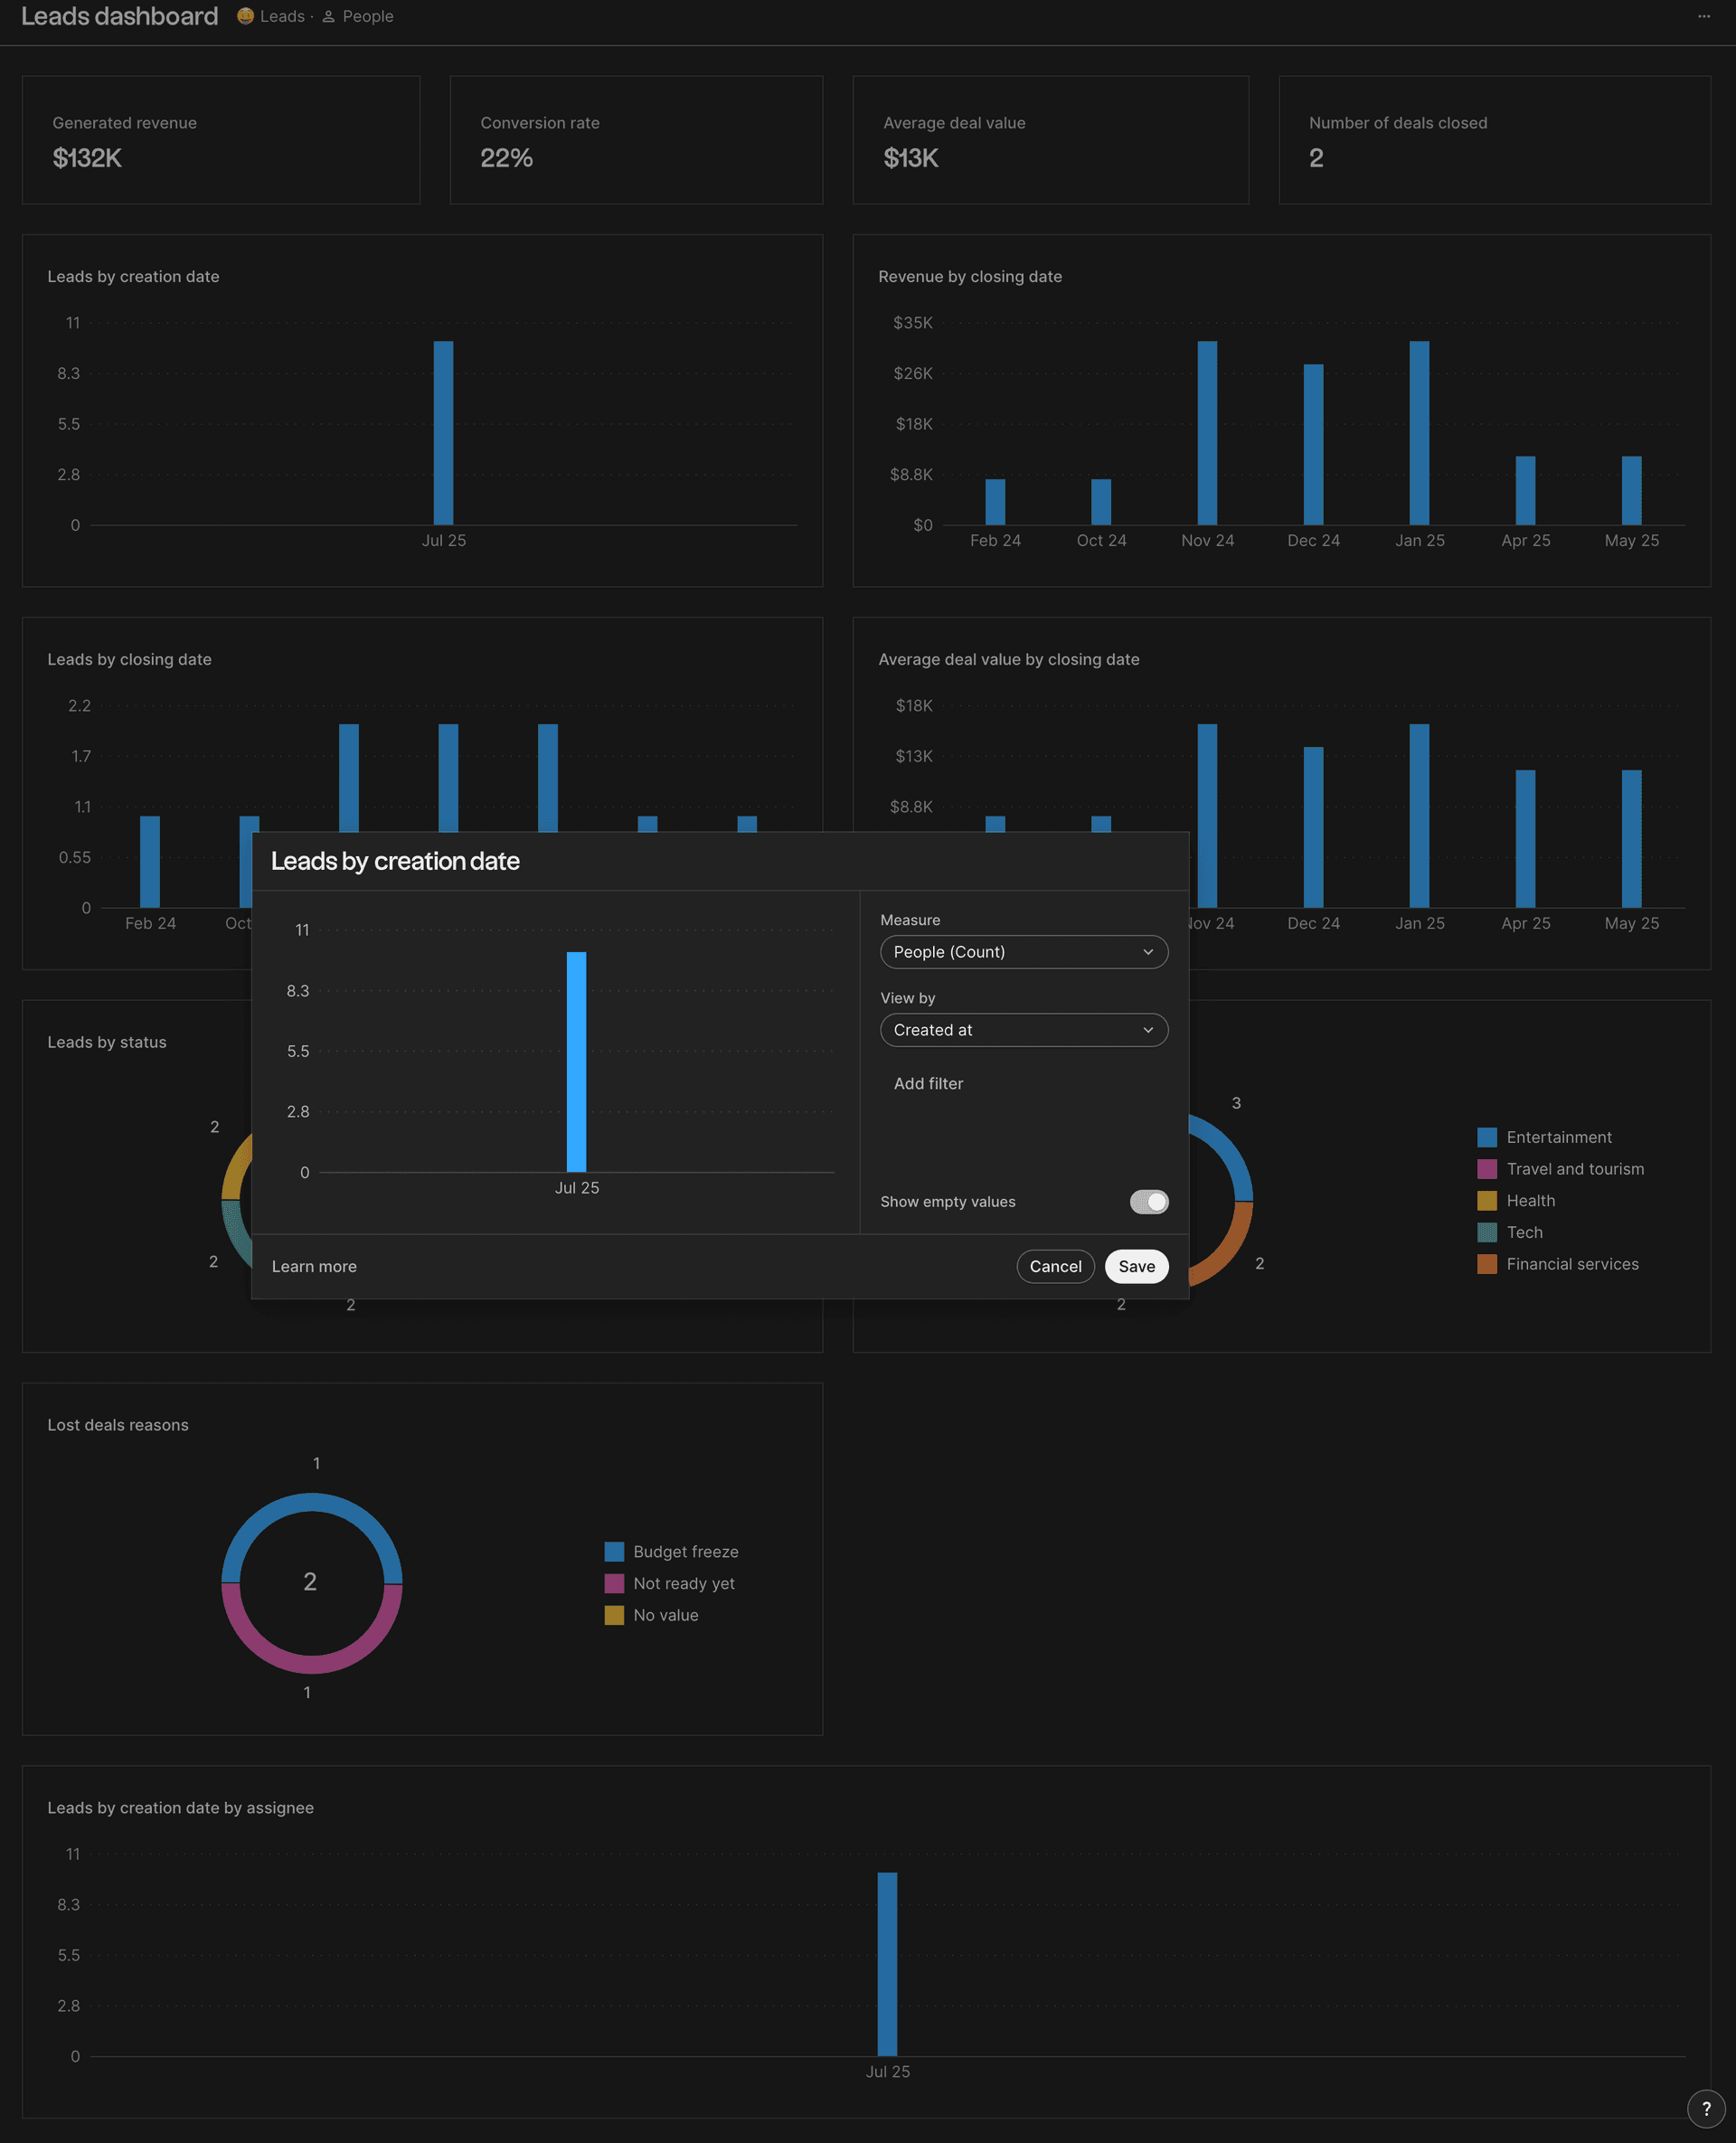
This empowers customers to create their own reports and explore data independently. It is the most sophisticated level but offers the highest customer value.
Self-service features:
- Custom report builders
- Drag-and-drop chart creation
- Custom date ranges and filters
- Export capabilities, typically PDF and Excel
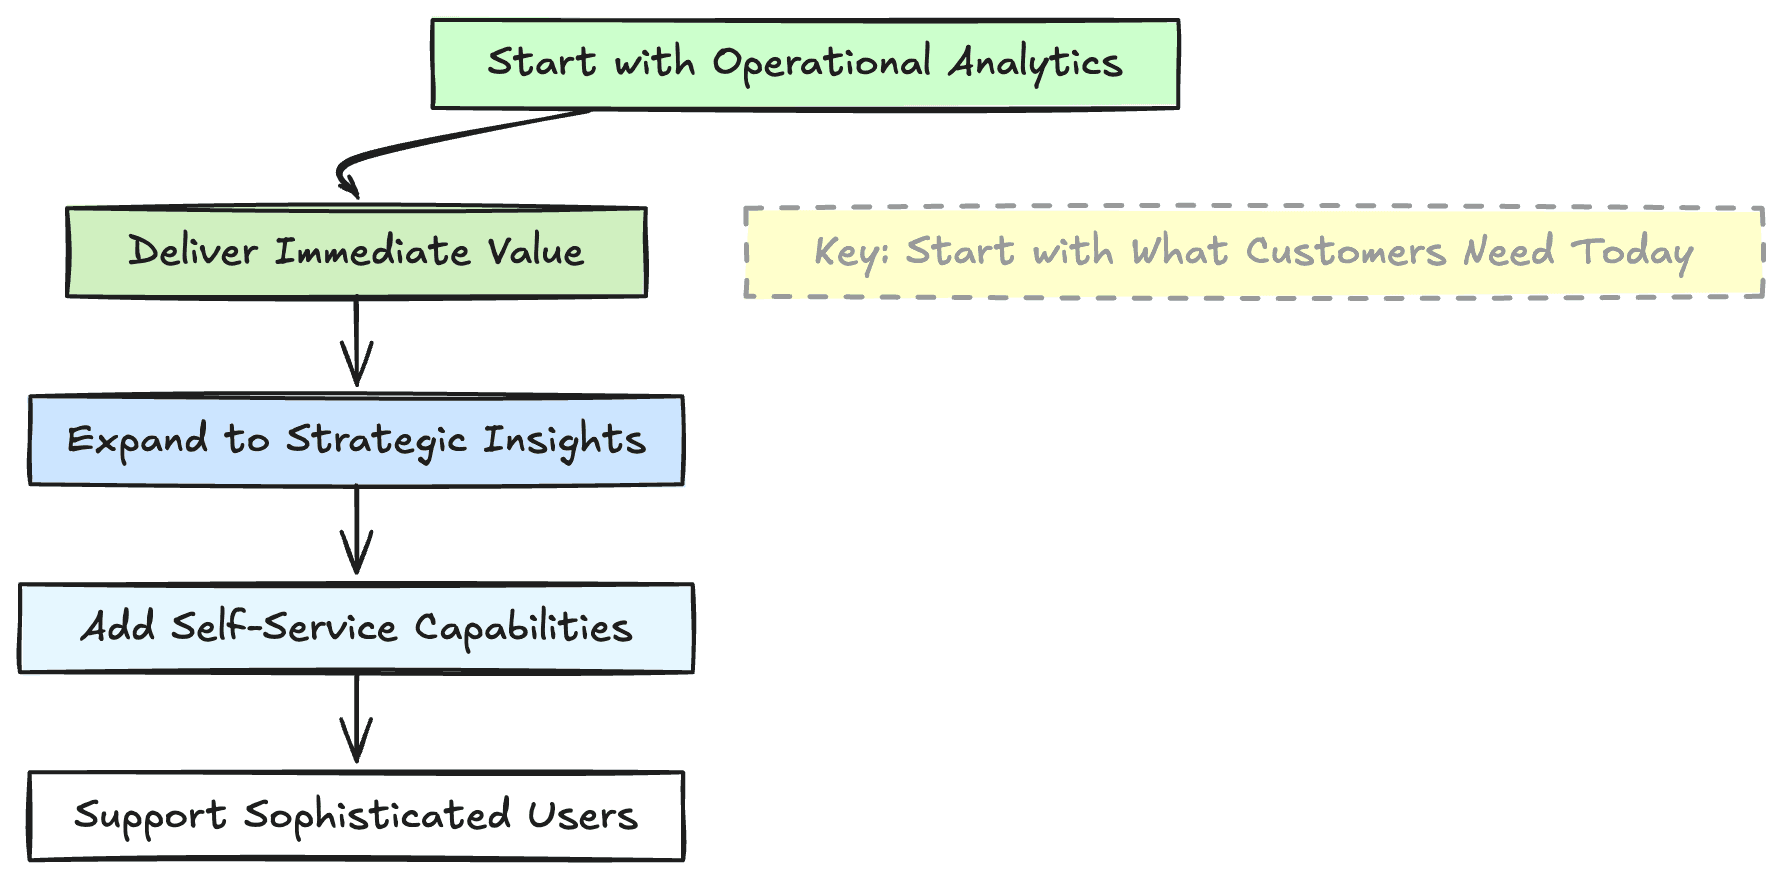
Most successful implementations start with operational analytics for immediate value, then expand to strategic insights, and finally add self-service capabilities as customers become more sophisticated. The key is beginning with what your customers need most today.
Check how many of these signals apply to your business. The more you check, the higher priority embedded analytics should be for your SaaS.
- Customers frequently request reporting features or data exports
- The support team spends significant time creating manual reports for customers
- Competitors include analytics capabilities that influence deal outcomes
- The customer success team needs better visibility into usage patterns
- The product team is seriously considering building analytics features in-house
- You are looking for ways to justify higher pricing tiers or premium plans
- You need features that increase platform stickiness and reduce churn
Scoring: 0 to 2 checked is a future consideration, 3 to 4 is a good opportunity, 5 or more is high priority. Take the complete assessment with detailed scoring
Implementation approaches
There are several ways to add embedded analytics to your product, each with different trade-offs in development time, customization, and ongoing maintenance.
Build from scratch
Creating a custom analytics solution gives you complete control but requires significant engineering resources. This approach makes sense for companies with unique requirements or substantial development capacity.
Building from scratch means your team will need to develop every component: data processing pipelines, visualization engines, user management, and security controls. You will need dedicated frontend and backend teams, plus data engineers to handle performance optimization.
Building in-house tends to make sense in one specific situation: analytics is not a feature alongside the product, it is a large part of what the customer is paying for. Where that is true, the reporting surface is itself a competitive asset, and a team can justify staffing it permanently rather than treating it as a one-off project. The test is whether you would still fund that team in a year when nothing is on fire, because that is the real commitment an in-house build asks for.
Pros: complete customization, perfect brand integration, full data control, no vendor lock-in.
Cons: 6 to 18 month development time, high engineering costs, ongoing maintenance burden, complex scalability challenges.
Embedded analytics platforms
Purpose-built platforms like Sumboard offer the fastest path to production-ready customer-facing analytics. They handle the complexity while allowing customization.
These platforms are specifically designed for embedding analytics into SaaS products. They provide pre-built components for everything from data connections to interactive dashboards, multi-tenancy, and white-labeling. Your engineering team only needs to handle the integration, which typically takes days instead of months.
Most successful SaaS companies choose this route because it offers the best balance of speed, cost, and functionality. You get professional analytics capabilities immediately while your engineering team stays focused on your core product features.
Pros: days to production, pre-built components, scalable infrastructure, regular updates and features.
Cons: ongoing subscription costs, some customization limits, vendor dependency.
Traditional BI tools embedding
Tools like Tableau or Power BI offer embedding capabilities, but they were not designed primarily for customer-facing use cases. These are powerful internal business intelligence tools that have added embedding as an afterthought.
The main challenge with traditional BI tools is that they are built for data analysts, not end-users. Their interfaces are complex, requiring training to use effectively. While they offer robust analysis capabilities, the user experience often feels disconnected from your product.
Some companies try this route because they are already using these tools internally. However, the licensing costs, integration complexity, and limited white-labeling options often lead to a suboptimal customer experience and a higher total cost of ownership.
Pros: powerful analysis features, familiar for internal teams, established vendors.
Cons: not designed for customer-facing use, complex licensing models, limited white-labeling, high per-user costs.

The build vs buy decision
This is perhaps the most critical decision you will make. The right choice depends on your team's capabilities, timeline, and specific requirements. We run the full numbers in build vs buy: the $400K decision, and you can compare embedded analytics vendor pricing before committing.
When to build
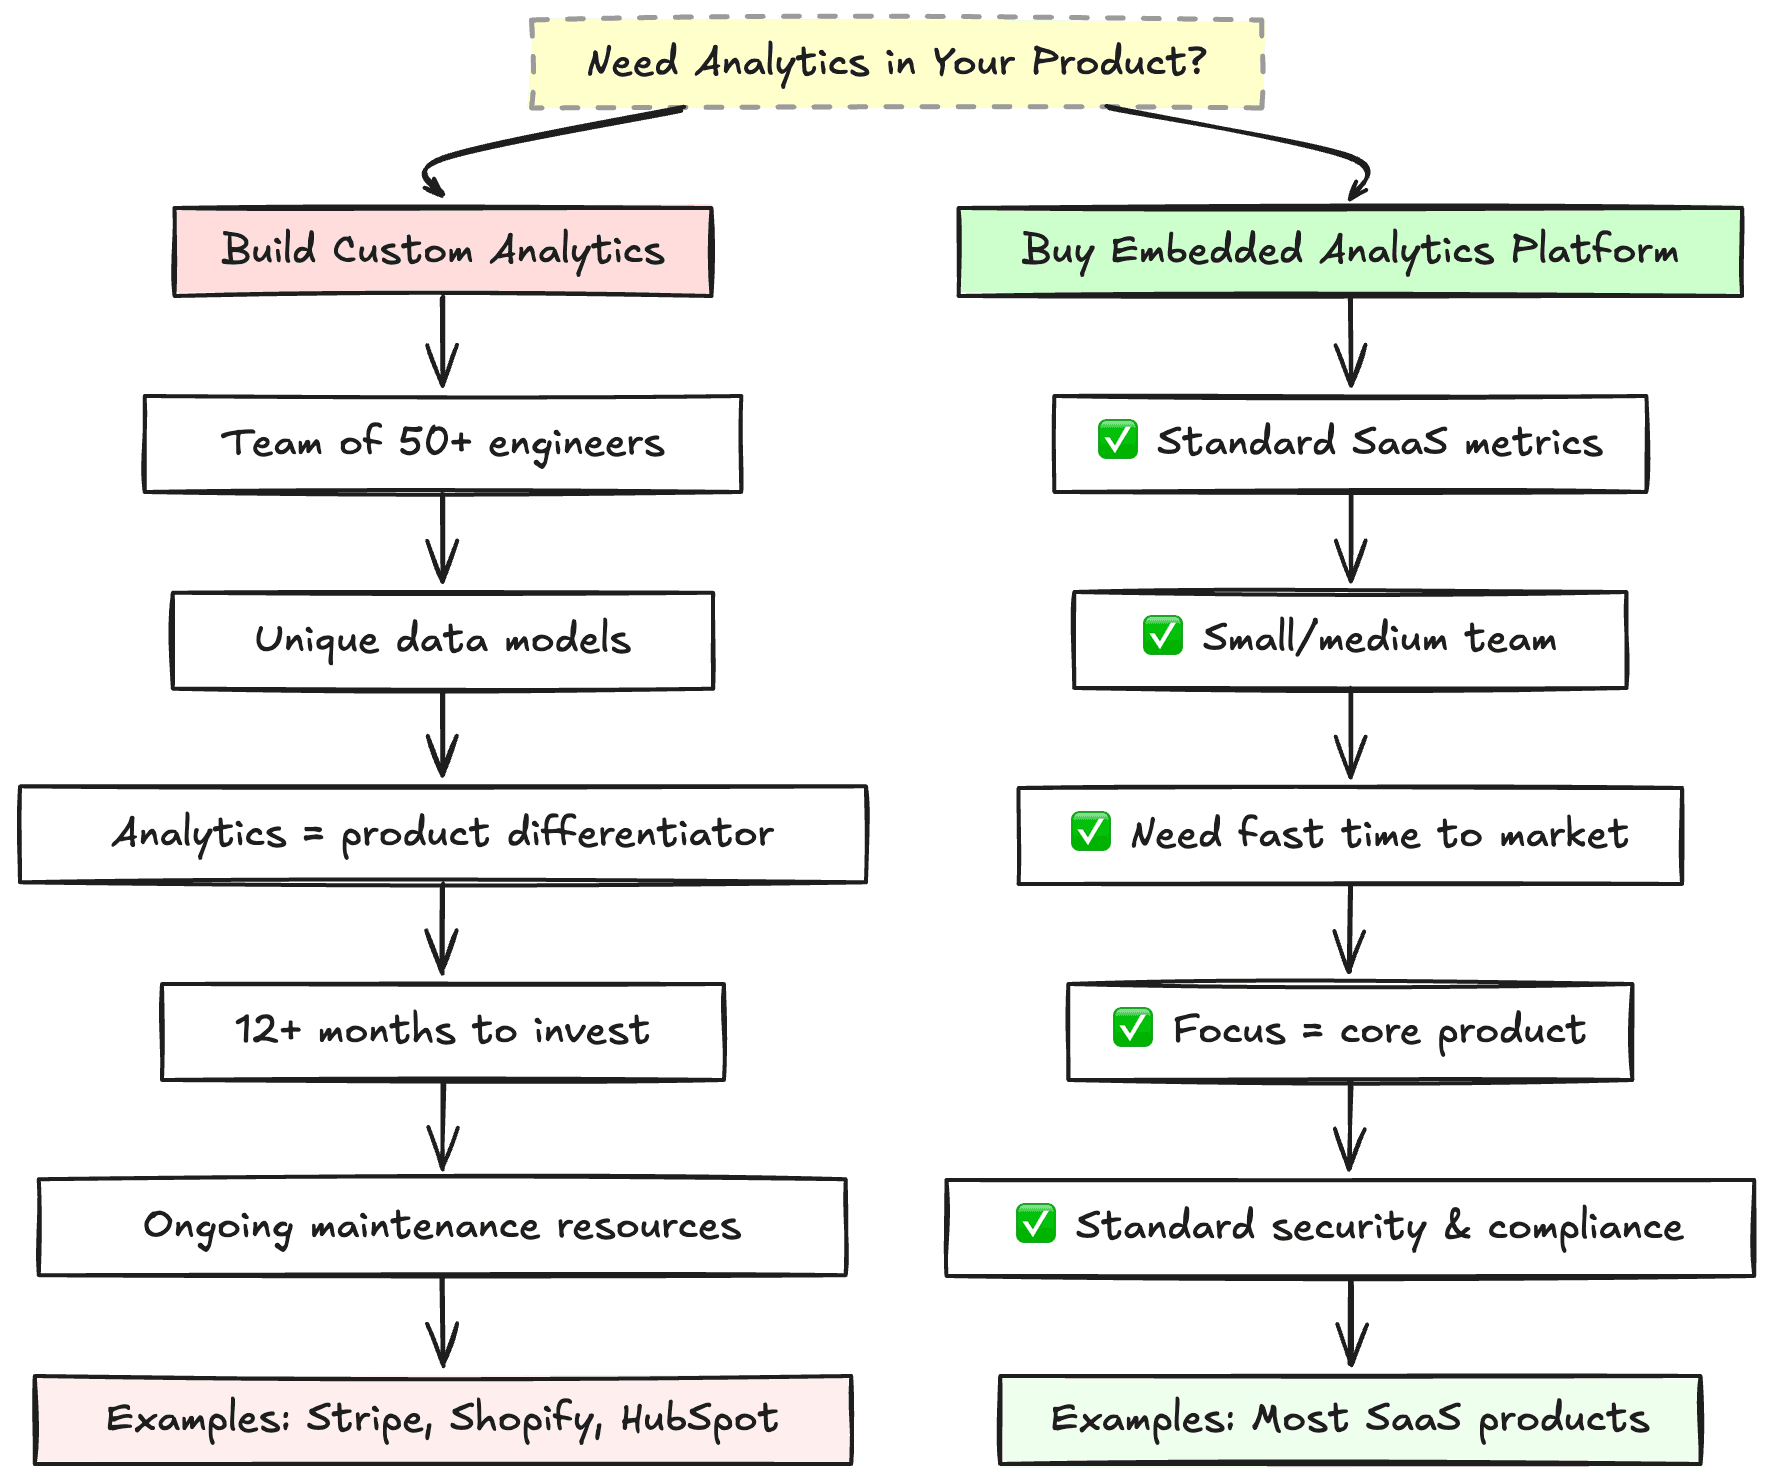
Consider building if you have a large engineering team, unique data requirements, and analytics are core to your product differentiation.
Companies like Stripe, Shopify, and HubSpot built custom analytics because their requirements were so specific and central to their value proposition that off-the-shelf solutions could not deliver the experience they needed.
Build if you have:
- A team of 50 or more engineers with dedicated data and analytics expertise
- Unique data models that do not fit standard patterns
- Analytics as a primary product differentiator
- 12 months or more to invest in development
- Ongoing resources for maintenance and scaling
When to buy
Choose a platform if you want to ship analytics quickly and focus your engineering resources on your core product.
Most SaaS companies fall into this category. Analytics are important but not the primary reason customers buy your product. You want professional, customizable dashboards without the complexity of building from scratch.
Buy if you have:
- Standard SaaS metrics and data patterns
- Limited engineering bandwidth
- Pressure to ship analytics quickly
- Standard security and compliance requirements
- A preference to focus on core product development
How long it takes to launch
Of everything people search for before choosing a platform, this question puts more impressions in front of this page than any other. The honest answer is that a demo will not tell you. A demo shows the happy path: connect a database, drop in a chart, look at a result. Your real timeline is the work between that and your customers safely seeing their own data, and how much of that work the platform absorbs versus leaves with you.
The four things that set the date
Authentication and tenant isolation. Every customer must see their rows and no one else's. Whether row-level security arrives as configuration or as something you build is, in the projects we have watched, where the largest share of the difference in timeline sits. Ask the question early, because it is also the hardest to retrofit.
Embedding method. There are three, not two, and they carry different timelines. A basic iframe ships fastest with the least styling control. A direct SDK gives source-level control over typography, interaction and state, and asks for real frontend work up front plus version upkeep afterwards. An SDK-managed iframe sits between them: the SDK initialises the frame and drives user context and filters, while branding is configured once. The iFrame versus SDK comparison sets the three side by side, and argues against picking on the SDK-good, iframe-bad reflex.
Theming to your product. Two separate questions hide here: whether the platform can match your design system, and how far you decide to take it. In the projects we have watched, the second question and its sign-off consume more calendar time than the first.
Your data. If the metrics your customers want do not exist in a queryable shape yet, the analytics timeline is really a data-modelling timeline. Worth checking first, since it is the one item here that no platform choice can shorten.
From our own customer conversations, which is experience rather than published data: where a platform already handles tenant isolation and white-labelling as configuration, teams reach a first customer-visible dashboard in days. Where those have to be assembled around the tool, the same teams report weeks, and the authentication layer is usually where the time goes. An in-house build runs to months, and unlike the other two it does not end at launch, because someone owns it permanently afterwards. Check any specific platform against its own documentation rather than against this grouping; what matters is which of the four items above it covers, not the label on the category.
We are giving ranges rather than a number on purpose. Any specific figure, ours included, describes somebody else's data model and somebody else's sign-off process. The useful exercise is to take the four items above and put a real estimate against each one for your product, then ask a vendor to talk you through the same four rather than through the demo.
Not "how fast can we go live" but "which of these four do you handle, and which stay with my team?" Answers to that can surface differences a feature list leaves out, because a feature list tells you something exists without saying who configures it.
What to consider before choosing a solution
Before diving into specific platforms and vendors, it is worth understanding the factors that will determine which solution works best for your situation. These criteria help you quickly identify what might be perfect, or a complete showstopper, for your project.
Data source compatibility, and why the connector count is the wrong number
Connector count is the figure this category advertises. Domo lists over 1,000, Strategy BI 200+, Power BI Embedded over 120 and Tableau more than 100. Every one of those numbers is real and almost none of it applies to you, because you are connecting to one warehouse rather than shopping a catalogue.
The number that decides the build is where the query executes. A connector that copies your rows into the vendor's store has turned a reporting choice into a data-residency and processing-agreement decision, and that conversation usually starts after the contract is signed. A connector that queries your warehouse in place leaves the rows where your agreements already cover them.
The second question is whether the connection carries tenant scope. A connector authenticates as one service account, so the filter that separates your customers has to be applied somewhere below it. If that filter is applied in the dashboard layer rather than in the query, the connector is fine and the isolation is not.
Questions to ask a vendor: does this connector read in place or extract, which credentials does it hold, and where is the per-tenant filter applied. Ask for the answers in the documentation rather than the demo, because the first two are architecture and the third is where isolation actually holds.
Integration method
How analytics get embedded affects development speed and user experience. Modern iframe embedding offers security, fast deployment, and cross-platform compatibility. Other methods like web components or direct API integration provide more control but require significantly more development time.
Consider: development timeline versus customization needs. Iframes enable rapid deployment with professional results, while custom integrations offer maximum flexibility at higher cost.
Native look and feel
If you need analytics that perfectly match your design system and feel truly native, you have limited options: build custom, or use headless analytics platforms.
Pro tip: get specific designs approved by vendors before committing. Many tools have customization limits that are not obvious from demos.
Performance requirements
Loading speed depends on both the tool and your database. Look for configurable caching options and test with real data volumes during proof-of-concept.
Test scenarios: large datasets, concurrent users, complex queries, and mobile device performance.
Essential features
Beyond basic charts and dashboards, identify must-have features early to avoid surprises later in the evaluation process.
Common requirements: self-service report building, AI-powered insights, email scheduling, advanced filtering, white-labeling.
Security and compliance
Data sovereignty requirements can quickly eliminate cloud-only providers. Check with your compliance team early to understand hosting restrictions.
Consider: data residency requirements, SOC 2 compliance, GDPR considerations, and self-hosting capabilities.
Pricing model alignment
Costs vary dramatically based on number of users, features, white-labeling, and support levels. Get ballpark figures early to avoid wasting time.
Pricing factors: per-user versus flat-rate, viewer versus editor licenses, data volume limits, and premium feature costs.
Implementation timeline
Consider both initial setup time and ongoing maintenance requirements. Some solutions are quick to start but complex to scale.
Timeline factors: integration complexity, data preparation, customization requirements, and team training needs.
Create a requirements checklist with your must-haves, nice-to-haves, and deal-breakers. This will help you move quickly through vendor conversations and focus on solutions that actually fit your needs, rather than getting distracted by impressive demos that do not address your core requirements.
How to Evaluate One Named Vendor, Which Is a Different Job From Comparing Eight
The section above gives you criteria. Criteria are what you carry into a demo, and a demo answers all of them yes. This section is the part that produces a verdict about a named vendor, and it works because every step of it starts in a document rather than a meeting. One of the four finishes in a conversation, and that is the reason to open it early rather than late.
The reason it needs its own procedure is structural, and a thread title on Reddit compresses it into one line: "Power BI / Looker felt great for internal BI, less so for". The post opens by saying the product grew up on internal BI and that "both are fine for analyst dashboards", then says the trouble started when they tried something else. Both the title and the excerpt are cut off at that point, so what came next is not quoted here. Internal BI and customer-facing analytics are not the same product with a different audience. The internal audience usually shares a data model, a support channel and some patience with a slow query, because those colleagues can ask someone. Your customers can do none of that, and a dashboard that is slow or wrong reads to them as a defect in your product rather than a defect in a reporting tool. That is our position rather than a finding from the thread above, which is one team's account and stops where the excerpt stops.
A vendor page will rarely say a product is weak at one of the two, so the claim to do both is not by itself information. Four checks turn it into information.
Test one: the vendor's own documentation tells you which case is first-class
Open the developer documentation and look for two separate paths, one for embedding to your own organisation and one for embedding to your customers. Separate documentation for the two is evidence rather than a requirement: a vendor could cover both well in one page. It is useful evidence because the two cases can differ in how a viewer is authenticated, in whether that viewer needs a licence, and in how tenants are separated, and a vendor that has worked through those differences usually ends up writing them down apart.
Microsoft does this explicitly. Its embedded analytics documentation separates "embed for your customers" from "embed for your organization" and states the consequence in one line: in the customer-facing case "App users don't need a license", and in the organization case "Each app user needs a Power BI license". That is the shape you are looking for. It is not an endorsement of the product, and the same page states that to embed in a production environment you must use a capacity. It is evidence that the vendor has thought about your case as its own case.
When the only embedding page describes sharing a dashboard with colleagues, you have your answer, and you have it in ten minutes.
Test two: the billable-user definition is where a good demo turns into a bad invoice
Ask what a billable user is, and get the answer in writing before the pilot rather than after it. The definition is the whole economics of the deal, because in a customer-facing deployment the billable population is drawn from your customers rather than your staff, and it moves on a curve you do not set. How much of that population is billable is exactly what the definition decides: it may be every person with a login, only those who opened a dashboard in the month, or only the seats you provision.
The definitions genuinely differ. Metabase states that "Both your internal team developing analytics and users of your embeds accessed through your product count as users", which means the billable population is the set of people who actually open an embed, not your headcount and not your customer list either; the pricing page records the date that wording was checked. Whether that set is closer to a tenth of your customers or to all of them is a fact about your product, and it is the number to model before signing. Microsoft's documentation describes the opposite arrangement for the customer-facing case, where app users need no licence and the cost sits in reserved capacity instead. Neither is cheaper as a rule, and the second is not free of growth either. The cited page states that to embed in a production environment you must use a capacity, so under that model the question moves from how many people to what capacity your workload needs, and the vendor's own sizing guidance is the document to read next. The first model rises with each additional billable person. What the second costs, and when, is not something this page can tell you from the documentation alone.
The embedded analytics pricing page carries a dated read of nine vendor pricing pages, and it found that six of them publish no price for a plan you could buy. That is exactly why the billable-user question belongs in the first conversation rather than the fourth.
Test three: ask where the tenant boundary is enforced, not whether it exists
Multi-tenancy is a weak signal on a feature list, because the word covers several different arrangements and a checkmark does not say which one you are getting. The question that separates one answer from another is which layer refuses to return another tenant's rows when something upstream is wrong.
There are three places the boundary can live: a database row policy, a semantic-layer policy, or service-layer authorization. They are not interchangeable, and the paths they cover are different: a drill-down can reach the source without passing through a semantic layer, an export or a scheduled email can leave through a path that never carried the viewer's context, and a cached result can outlive the session that produced it. The row-level security page sets out which delivery path each enforcement point actually covers.
The failing answer to this test is "you pass a tenant filter in the query". That is not a boundary, it is a convention, and it holds exactly as long as every future query is written by someone who remembers it.
Test four: look at what the vendor's customers shipped, not what the vendor shipped
Ask for case studies where the end user is somebody else's customer, and where the product is live enough that you can go and look at it. A vendor whose reference customers all built internal reporting has told you where its product is strong, whatever the embedding page says.
This test is easy to nod at, because the answer arrives as a link rather than as a number. Read two of them properly instead. If the dashboards in the screenshots are the vendor's own interface with a logo changed, that is a fact about how much of the surface you will actually control.
What the four tests produce
Run in order, the four are mostly reading rather than meeting, and the reading can start the day you add the vendor to the list. What comes out is not a score. It is a sentence you can defend in a roadmap review: this vendor does or does not treat our case as its own case, its meter does or does not track a number we control, its tenant boundary sits at a layer we can name, and its customers have or have not shipped what we are about to ship. That sentence is a diagnosis rather than a verdict on quality: a vendor can fail test one and still be the right answer if you are embedding for your own organisation, which is a different job from the one this guide is about.
A shortlist assembled this way is short, and the demos that follow it are useful, because by then you are watching for how something works rather than whether it exists.
Best embedded analytics tools to consider in 2026
The embedded analytics landscape has transformed. From purpose-built platforms to traditional BI tools adding embedding capabilities, the market offers more choices than ever. With that variety comes the challenge of finding the right fit for your specific needs.
Key market trends in 2026:
- A shift from traditional BI tool embedding to purpose-built platforms
- Focus on developer experience and rapid implementation
- Emphasis on white-labeling and native integration
- The rise of AI-powered analytics capabilities
We have compared the top solutions across two categories. Purpose-built embedded analytics platforms are designed specifically for customer-facing analytics, offering faster implementation and a better user experience. Traditional BI tools with embedding are established platforms that added embedding capabilities, often preferred by companies already using those tools internally.
For each tool we look at implementation (setup time, technical requirements, integration methods), features and flexibility (customization options, white-labeling, capabilities), and pricing model (cost structure, scalability, included features).
Purpose-built embedded analytics platforms
Sumboard
Sumboard offers the fastest path to production-ready customer-facing analytics. It is built specifically for SaaS companies who want professional dashboards without the complexity of building from scratch.
Use Sumboard if you want to ship analytics in days rather than months, you need white-label customization with your branding, you want to focus engineering resources on the core product, and you need reliable, scalable infrastructure.
What comes with it:
- Custom PDF builder. Branded PDF reports that match your product's design and feel native to your customers.
- Translate and localize. Serve global customers with dashboards in their own language and time zone automatically.
- Share and embed. Embed dashboards in your product or share via secure links, so customers stay in your ecosystem.
- Interactive filters. Let customers explore and drill down into their data with filtering controls.
- Email schedules. Keep customers informed with automated report delivery on their preferred schedule.
- Export in PDF and Excel. Give customers the data in the formats they want, with full white-label branding.
- White-label. Customize chart colors, add your logo, and match your brand so analytics feel native.
- Compare over period. Help customers spot trends and track progress with built-in period comparison.
Core capabilities:
- Drag-and-drop chart builder
- Multi-tenant architecture
- Database and API data sources
- Cloud and self-hosted options
- 10-minute integration
Pricing starts at €199 per month with unlimited users and all core features, and there is a free forever Startup plan with one dashboard and unlimited viewers for validating the idea before you commit. See the pricing page for the full breakdown.
Skip the 6 to 12 month build cycle. Sumboard lets you launch customer-facing dashboards in days rather than months:
- 10-minute SDK integration
- White-label customization
- Multi-tenant architecture built in
Start a free trial, or book a demo if you would rather see it against your own data model first.
Embeddable
A developer-first tool with headless architecture for fast customer-facing dashboards and complete control over the user experience.
Best for maximum customization and performance. Embedding is via web component or React SDK, with no iframes. Pricing is not disclosed.
Embeddable's own product demo
Qrvey
An end-to-end embedded analytics platform built specifically for multi-tenant SaaS applications.
Best for multi-tenant SaaS with self-service needs. Embedding is via JavaScript widgets, with no iframes. Pricing requires contacting sales.
Qrvey's own product demo
Luzmo
A Belgian embedded analytics platform with a drag-and-drop interface and an API-first approach.
Best for API endpoint data with self-service BI. Embedding is via web component. Pricing starts at $995 per month for 100 monthly active viewers.
Luzmo's own product demo
Explo
A YC-backed startup providing a cloud-only service designed for fast market entry with a modern UI.
Best for startups wanting fast time-to-market. Embedding is via iframe or web component. Pricing starts at $795 per month for 3 embedded dashboards.
Explo's own product demo
RevealBI
A purpose-built solution that pivoted from traditional BI to customer-facing analytics.
Best for fixed annual pricing with a fluctuating user base. Embedding is via iframe or SDK. Pricing requires contacting sales.
RevealBI's own product demo
BI tools with embedding features
Traditional business intelligence tools that have added embedding capabilities. While powerful for internal use, they often have limitations when used for customer-facing scenarios.
BI tools excel at internal decision-making but were not built for customer-facing experiences. Common limitations include restricted customization, slower loading times, and complex multi-tenant workarounds.
Power BI Embedded
Microsoft's mature BI platform with iframe-based embedding. Enterprise-grade with high security, but it requires workarounds for multi-tenancy and customer-facing use cases.
Best for the Microsoft ecosystem and a mix of internal and customer BI. Embedding is iframe only. Azure capacity pricing starts at $735.913 per month for an A1 node and runs to $23,542.938 for A6 (Power BI Embedded pricing, checked 7 August 2026).
Microsoft's own Power BI Embedded demo
Looker Embedded
Google Cloud's enterprise-grade BI platform with real-time capabilities. Very powerful, but expensive with limited customization options.
Best for the Google Cloud ecosystem and enterprise budgets. Embedding is iframe only. Looker does not publish a price and routes you to sales.
Google's own Looker embedding demo
Tableau Embedded
Powerful data exploration with a high learning curve, and a swiss-army-knife approach to analysis.
Tableau publishes edition prices rather than a quote-only model: Tableau Standard at $15 per user per month and Tableau Enterprise at $35 per user per month, both billed annually, with Tableau Cloud+ and the bundle routed to sales (Tableau pricing, checked 7 August 2026). Every deployment requires at least one Creator license.
Tableau's own embedding demo
Metabase Embedded
A popular open-source BI tool with full tool embedding capability.
Pro is $575 per month with 10 users included, then $12 per additional user; embedding and multi-tenant embedded analytics start at Pro, and Enterprise starts at $20,000 per year (Metabase pricing, checked 7 August 2026).
Metabase's own embedding demo
Sigma Embedded
Cloud-first BI with iframe embedding and live query capabilities. Sigma does not publish a price and routes you to sales.
Sigma's own embedding demo
GoodData Embedded
One of the few BI tools offering web component embedding rather than iframe only. GoodData does not publish a price and routes you to sales.
GoodData's own embedding demo
Qlik Embedded
A suite of analytics tools with enterprise-grade embedding features. Published pricing starts at $200 per month for 10 users.
Qlik's own embedding demo
Getting started: your implementation roadmap
Ready to add embedded analytics to your product? Here is a practical roadmap that works regardless of which approach you choose.
Step 1: define your analytics strategy
Before touching any code or evaluating platforms, define what success looks like.
Key questions to answer:
- What are the top five metrics or reports your customers ask about most?
- How do customers currently access this data?
- What decisions will these analytics enable?
- How will you measure the success of embedded analytics?
Step 2: audit your data infrastructure
Understanding your current data setup determines implementation complexity and timeline.
Infrastructure checklist:
- Where is customer data currently stored?
- How clean and consistent is the data?
- What are your data security and compliance requirements?
- Do you have existing APIs for data access?
Storage location and data quality do not settle the decision that shapes the first dashboard: whether the model your customers query can be the model your own team queries. It usually cannot, because an internal model encodes vocabulary your team agreed on and your customers do not carry that context.
Luzmo states the structural version of the same point: "As opposed to a data infrastructure built around 'transactions', client-facing dashboards require a different data structure" (Luzmo, checked 4 September 2026).
Three modeling decisions belong in this audit:
- Where the tenant key lives. A column every query filters on, a schema per tenant, or a database per tenant — the trade is isolation against operational cost, and it is worked through in multi-tenant analytics architecture.
- Whether a metric is defined once or per surface. A semantic layer computes a metric the same way for every frontend; without one, the same number drifts between your product and your reports.
- Whether aggregation happens before the query or during it. Pre-aggregated tables buy a response time customers tolerate and pay for it in freshness, so the acceptable lag belongs in the requirement rather than in the tuning phase.
Step 3: choose your implementation approach
Based on your requirements and resources, select build versus buy and specific platforms.
- Fast track, 2 to 4 weeks: use a purpose-built platform like Sumboard
- Custom build, 6 to 12 months: chart libraries plus a custom backend
- Hybrid, 2 to 4 months: a headless platform plus a custom frontend
Step 4: start with a pilot
Launch analytics for a subset of customers or features to validate your approach.
Pilot strategy:
- Select 10 to 20 engaged customers for beta testing
- Focus on 3 to 5 core metrics or reports initially
- Gather feedback before broader rollout
- Measure usage patterns and customer satisfaction
Step 5: scale and optimize
Based on pilot results, expand features and roll out to your entire customer base.
Scaling considerations:
- Performance optimization for larger datasets
- Advanced features based on customer requests
- Integration with customer workflows
- Training and onboarding processes
Step 6: measure and iterate
Continuously improve based on usage data and customer feedback.
Success metrics to track:
- Analytics feature adoption rates
- Time spent in analytics sections
- Customer satisfaction scores
- Support ticket reduction
- Revenue impact through upsells and retention
Now that you understand the landscape and its trade-offs, the next step is your implementation plan. Whether you decided to build custom, buy a platform, or take a hybrid route, the roadmap above works the same way: define the metrics, audit the data, pick the approach, pilot it with a small group, then scale on what the pilot taught you.
Where to go next
Each of these answers a different question, so pick by the one you are stuck on.
Still choosing between vendors. The embedded analytics tools landscape sets the platforms side by side on the criteria in this guide, with the trade-offs written out rather than scored.
Deciding whether to build. Build vs buy: the $400K decision runs the real numbers on a from-scratch build, including the part most estimates leave out, which is the permanent maintenance commitment after launch.
Deciding how to embed. The iFrame versus SDK comparison sets the three embedding routes side by side and argues against choosing on reflex.
Comparing what things cost. Embedded analytics pricing models explains why per-user pricing built for internal BI misfires when the users being counted are your customers.
Working out whether you are ready. The customer-facing analytics guide carries the full build-or-buy assessment with scoring.
Wanting to see it shipped. The case studies show what other SaaS teams launched and what changed afterwards.
Needing a definition first. Embedded analytics in the glossary is the short version, and multi-tenancy plus iframe embedding cover the two terms that come up most often in vendor conversations.
Add embedded analytics to your product
Skip the 6 to 12 month build cycle. Sumboard lets you launch customer-facing dashboards in days: 10-minute SDK integration, white-label customization, and multi-tenant architecture built in.