
Healthcare analytics inside your product.
Clinical and revenue-cycle reporting, per provider, without moving protected data.
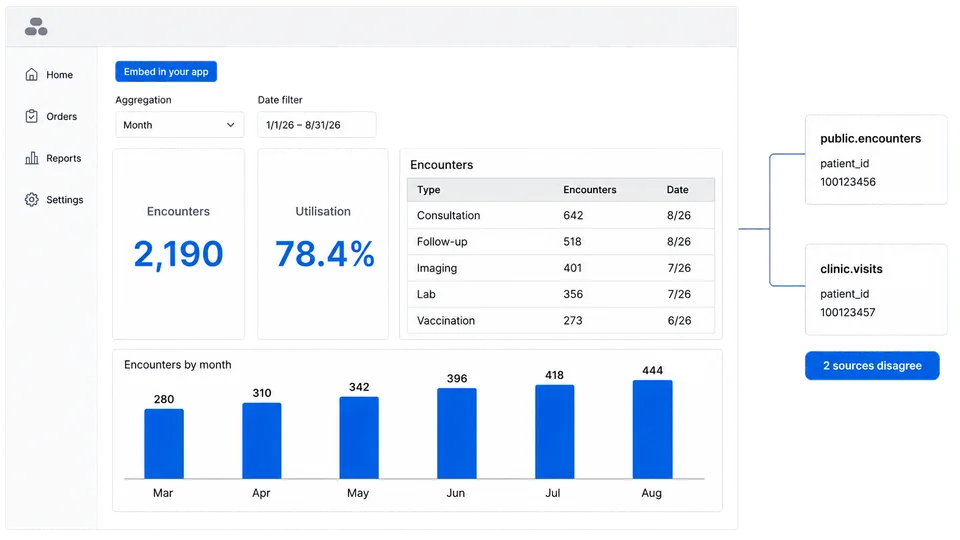
Experience Sumboard
Builder view and customer view.
Switch between the workspace where your team builds and the branded dashboard your customer sees.
- 01Create data insights
- 02Customize with your brand
- 03Embed in your app
What goes wrong in Healthcare dashboards.
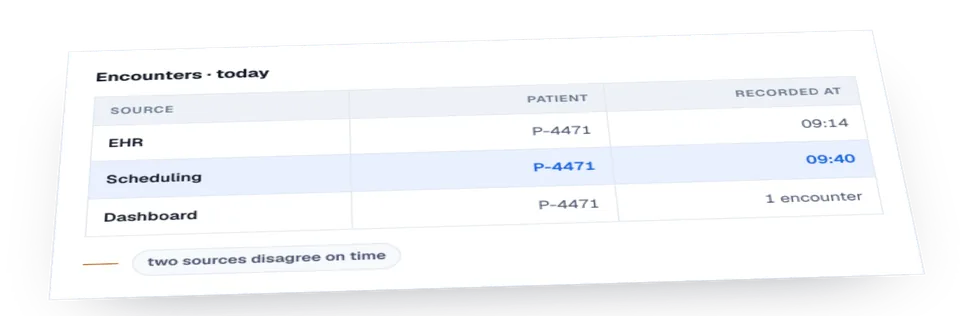
Two source systems can disagree about who a patient is and when an encounter happened, and the dashboard is where that disagreement becomes visible.
Clinical and billing systems resolve patient identity and encounter timing differently, so a join on an assumed key produces a clean-looking number built on the wrong rows. Reconciliation belongs in the model; unresolved conflicts are shown rather than hidden.
Permission resolution at query time.
Access is decided by role and by care relationship, not by role alone: a clinician sees their own patients, a department head sees the department, and revenue-cycle staff see billing without seeing clinical detail. Two people with the same job title often need different rows.
One metric definition, shared across teams.
Encounters
Completed visits in a period, by the source system's own definition of completed. Systems differ on whether a cancelled-then-rebooked visit is one encounter or two, and the dashboard states which definition it uses.
Capacity utilisation
Booked time against available time for a stated resource. The dashboard states whether blocked and administrative time counts as available.
Days in accounts receivable
Average days from service to payment. It rises for reasons unrelated to performance, such as a payer changing its adjudication window, so it is shown with its period.
Denial rate
Claims denied as a share of claims submitted. The dashboard states whether it counts claims or attempts, since resubmissions change both.
Three failure modes in production.
Identity treated as solved
Two source systems can hold different identifiers for the same person and different timestamps for the same encounter. Joining on an assumed key produces a number built on the wrong rows.
Protected data copied to reach the dashboard
Tools that require an extract into their own store turn a reporting decision into a data-residency and processing-agreement decision.
Restatement shown as a correction
Numbers move as claims settle. Settled and provisional figures are presented differently.
How fresh the numbers need to be.
Clinical and billing systems settle at different speeds, so a figure read today will move for days afterwards as claims adjudicate. Provisional figures are marked as provisional.
Further reading for Healthcare engineering teams.
Healthcare Dashboards: When Your Sources Disagree on Who and When
Healthcare dashboards pull from sources that disagree about who a patient is and when something happened. The six components that recur, where the connectors carry the compliance risk, and what HIPAA changes.
HIPAA-Compliant Analytics: The Search Results Answer a Different Question Than a Product Team Is Asking
Search for HIPAA-compliant analytics and every result on the first page is about web or marketing analytics. That is a real problem and it is not the one a healthcare SaaS has when its product shows a customer a dashboard built on patient data.
Patient Analytics Dashboard: A Safe Product Framework
Define patient metrics, authorization, provenance, presentation, and release evidence before embedding a healthcare dashboard.
Healthcare KPI Dashboards: Measure Specification First
Turn healthcare KPI labels into versioned measure contracts with defined populations, sources, adjustment, authorization, and permitted decisions.
Frequently asked questions.
Does our data have to move to you?
No. Queries run against your own source and only results are returned; Sumboard keeps no copy beyond cached results.
How do you handle two systems disagreeing about a patient?
By showing the disagreement. Where the identity match is uncertain, your model can flag the row.
Can billing staff see revenue without clinical detail?
Yes. Your query selects the columns per role, so billing staff can see a claim's value without its diagnosis.
Is the audit trail sufficient for a compliance review?
Which access records your framework requires is for your compliance team to judge. Ask us for the current logging documentation before relying on it.