
Sales and CRM analytics inside your product.
Pipeline and performance reporting, per customer.
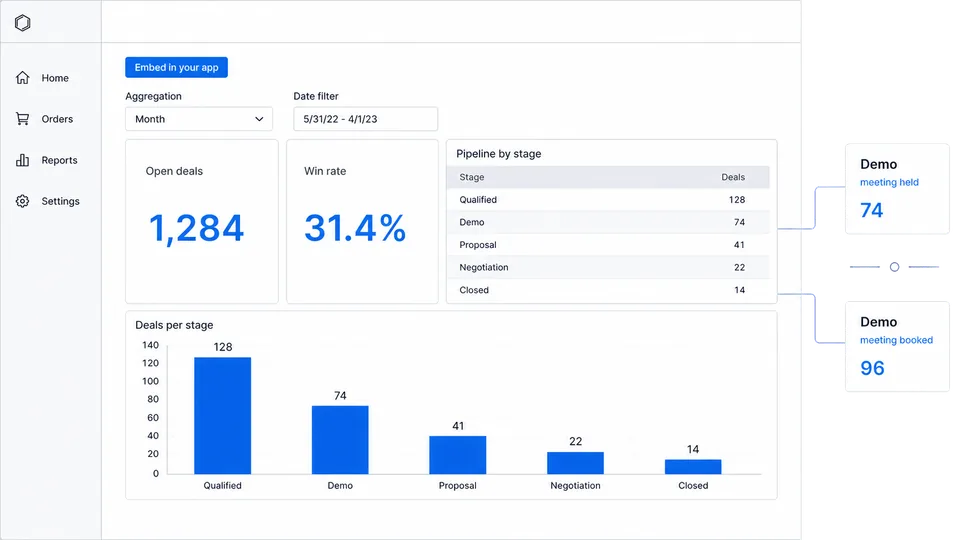
Experience Sumboard
Builder view and customer view.
Switch between the workspace where your team builds and the branded dashboard your customer sees.
- 01Create data insights
- 02Customize with your brand
- 03Embed in your app
What goes wrong in Sales and CRM dashboards.
Pipeline numbers move all day and two teams rarely define a stage the same way, so a shared dashboard has to carry the definition with the number.
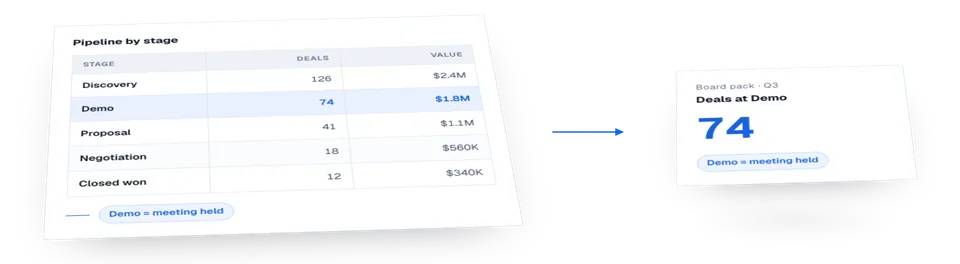
A stage name is not a definition. One team writes the row when a meeting is booked and another when it is held, so the definition is delivered with the number.
Permission resolution at query time.
Reps see their own opportunities, managers see their team's, and leadership sees the whole book. What makes this harder than HR is that ownership changes without anybody transferring: an opportunity is reassigned mid-cycle and both the old and new owner have a claim to the history.
One metric definition, shared across teams.
Pipeline value
Open opportunity value in stated stages. The dashboard states whether the earliest stage is included.
Win rate
Closed-won divided by all closed in a period. Counting from opportunities created in the period gives a different number; the dashboard states which one it uses.
Sales cycle length
Median days from creation to close for won deals. A mean is distorted by a few long enterprise cycles.
Stage conversion
Opportunities advancing from one named stage to the next. Stage names are local conventions, so the definition is shown with the metric.
Three failure modes in production.
Stage names shipped as universal
A packaged sales dashboard assumes its own funnel. Your customers named their stages themselves.
Reassignment rewrites history
When an opportunity changes owner, a model that moves every past event with it changes last quarter's attainment after the quarter closed.
Currency handled at display time
Multi-region pipelines carry several currencies. Converting at display time gives two dashboards different totals for the same data, using rates from different days.
How fresh the numbers need to be.
Pipeline changes all day. A stated snapshot time lets a sales leader quote the same number in a meeting that they saw on the dashboard.
The platform.
Tenant isolation, white-label theming, exports and scheduled reports.
Frequently asked questions.
Can each customer keep their own stage names?
Yes. Stage labels are read from your model, with the definition alongside the label.
How do you stop a closed quarter from moving?
By modelling events rather than current state in your source. Attainment for a closed period is computed from what was true then; a later reassignment changes today's ownership only.
Can a rep see the team total without seeing other reps' deals?
Yes. Your query can return an aggregate without the underlying rows.
Does this replace our CRM's reporting?
It is for what you show your own customers inside your product. If your product is the CRM, it is the reporting layer; if not, it runs alongside the CRM.