

Embedded AnalyticsSeptember 12, 2026•7 min read
Embedded Analytics for Energy Platforms
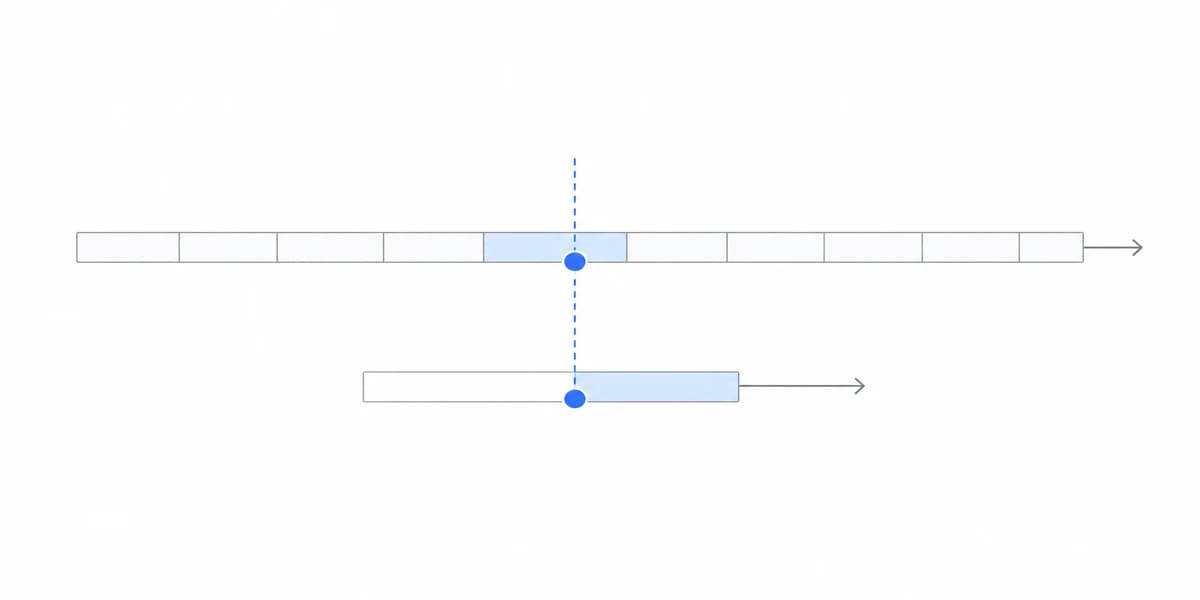
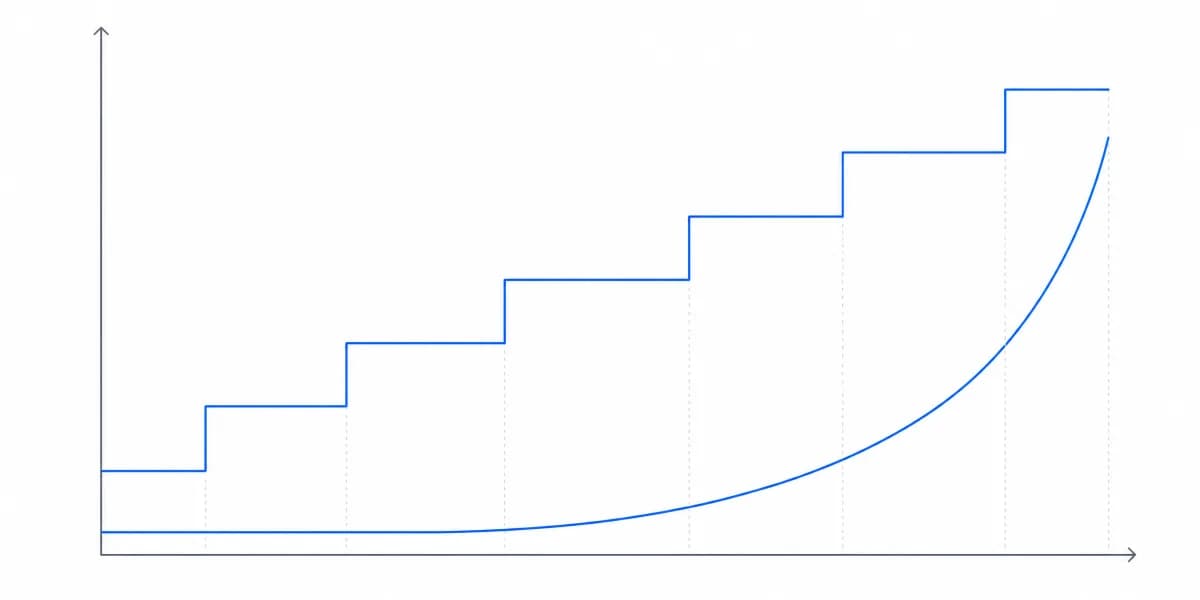
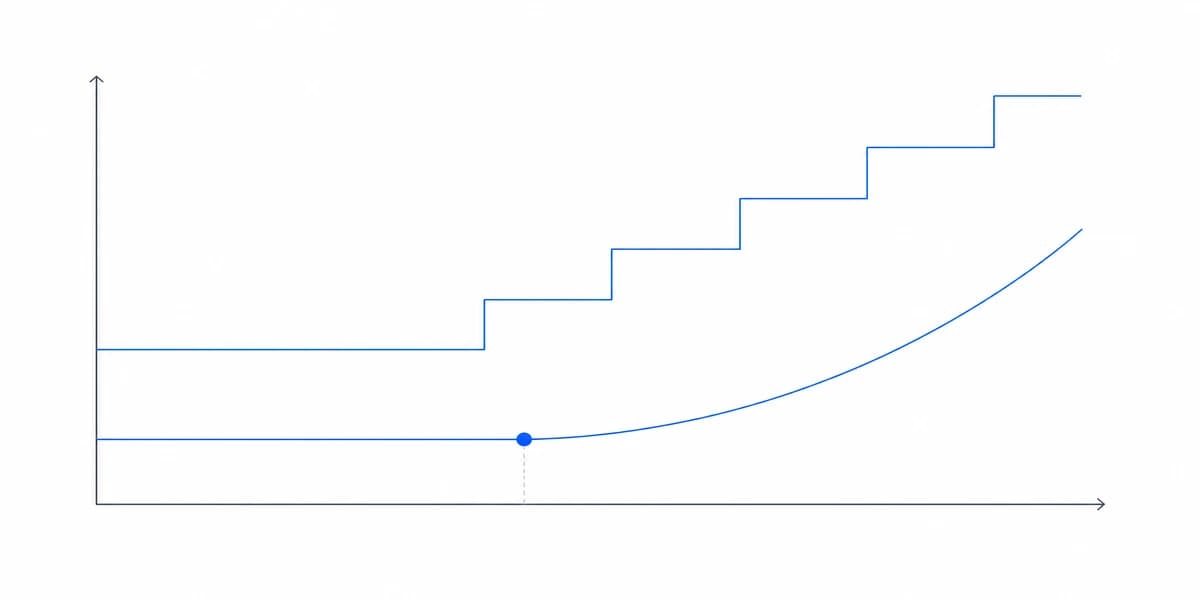
Interval meter data has to be reduced before it can be drawn, and the ordinary reduction deletes the number the customer is billed on.
Blog
Technical analysis, implementation guidance, and product strategy for teams building customer-facing analytics into SaaS applications.
Showing 116 of 116
Interval meter data has to be reduced before it can be drawn, and the ordinary reduction deletes the number the customer is billed on.

In education reporting a permitted aggregate can still identify a student, the threshold that decides it is set by each customer rather than by your product, and hiding one cell is not enough.

Construction platforms break three assumptions embedded analytics usually makes: the tenant is a project, the headline number's denominator is an estimate, and the data arrives after the day it describes.

Setting a relationship to filter in both directions does not make the security filter travel both ways. Microsoft documents that as a separate checkbox with its own default, and it documents separately what a viewer is shown when a report references a row that row-level security has configured. Reading the two together is what changes the decision for anyone whose dashboard sits inside another product.

One widely-circulated guide says give customers six to twelve months notice before a breaking change. We read what two embedded analytics vendors actually publish, and neither commits to a window. They publish two different kinds of promise instead.

Search this term and the first page is data and advisory firms. If you build CRE software the data is already yours to hold, and the hard part is that an owner, a property manager and an asset manager open the same dashboard and must see different rows.

Search for HIPAA-compliant analytics and every result on the first page is about web or marketing analytics. That is a real problem and it is not the one a healthcare SaaS has when its product shows a customer a dashboard built on patient data.

Article 32 gives four examples of appropriate measures and encryption is half of the first. The harder engineering problem is listing the copies a deletion request would have to reach, and a precomputed aggregate does not record which rows produced it.

The four things that kill embedded analytics in production are all invisible in a demo dataset. One published POC repository shows what its author built alongside the reports, and the list is longer than a chart.

Published build estimates run from $150,000 to $350,000. Two of the three name the team they price, and once you divide, those two agree closely. The third names nothing.

An alert has to fire when nobody is looking at the chart, and everything else about embedding assumes somebody is. Four vendor documentation pages say where alerting lives, and three of them never mention embedding at all.
Define comparable store metrics, reconcile their data, isolate operational drivers, and connect every signal to an owner and review decision.
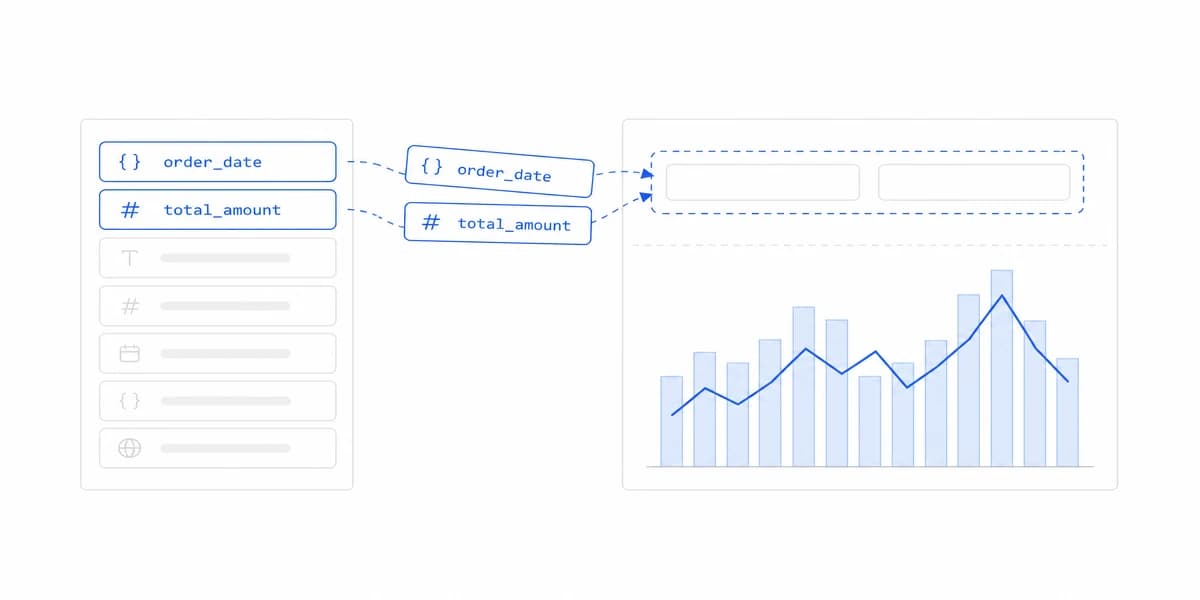
Design retail dashboards around reconciled sales, accepted inventory movements, store-local time, customer scope, and the decision window.
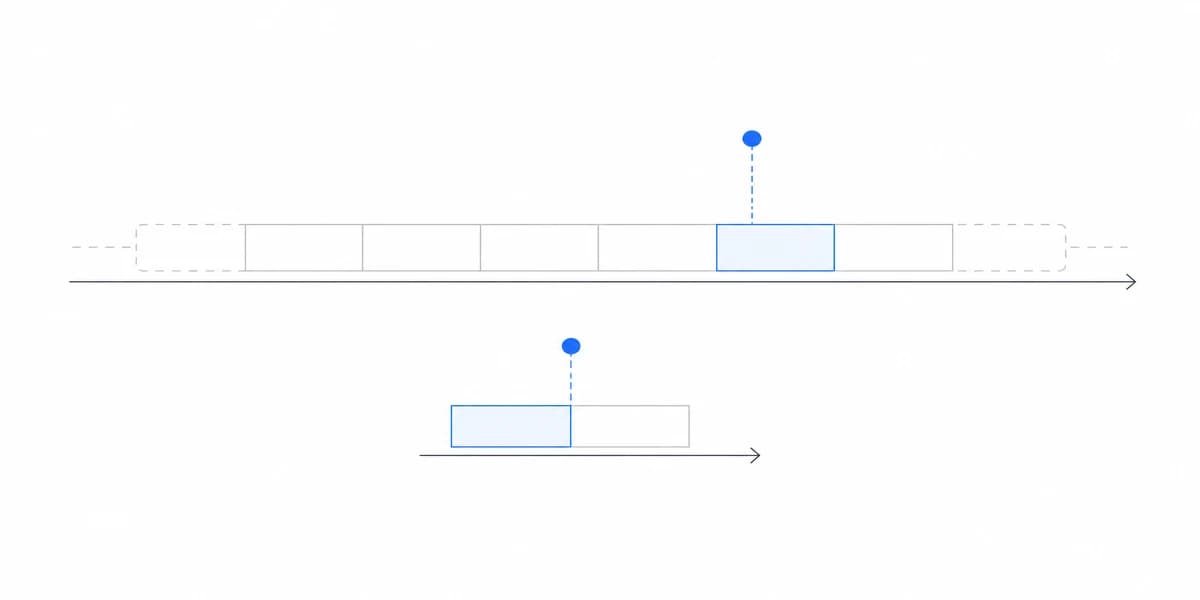
Not every business goal fits neatly into 'strategic long-term' or 'operational real-time.' Here's how tactical dashboards track the middle layer.
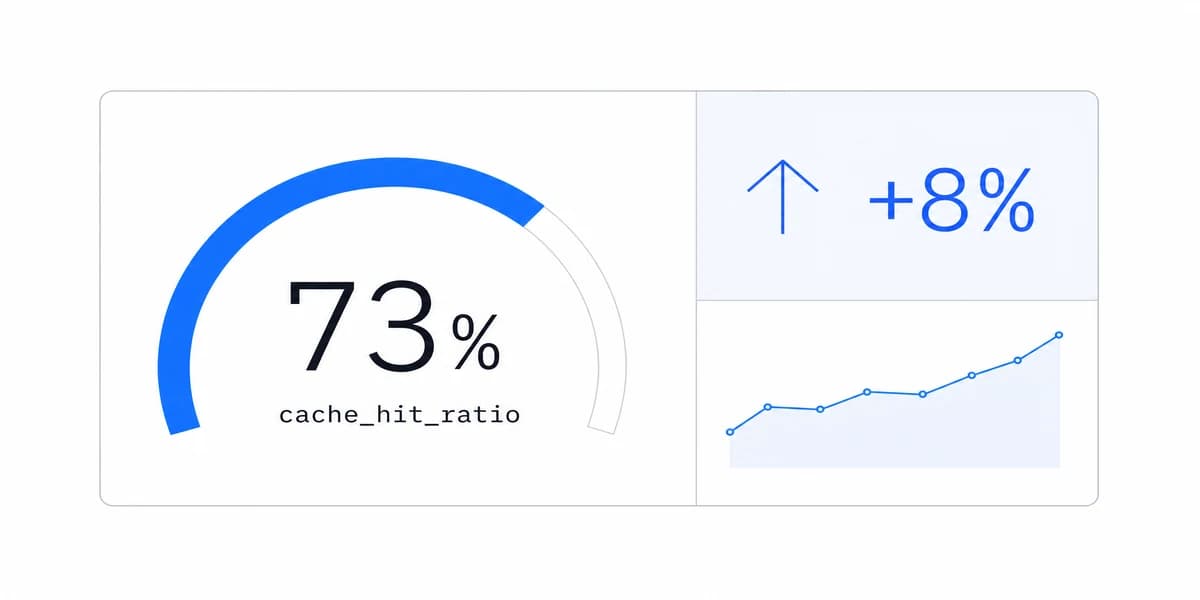
Manufacturing customers now expect interactive production analytics rather than CSV exports. How B2B SaaS companies deliver real-time visibility without a twelve-month build.
Comparing Tableau and Power BI? Most articles miss the real question: are internal BI tools even the right choice for customer-facing analytics?
Tableau works for internal BI, but customer-facing analytics need something different. Here's what product teams are choosing.
Comparing two enterprise BI platforms that many SaaS teams evaluate, and why most end up looking elsewhere.
Build marketing dashboards from reconciled source data, explicit attribution and currency rules, tenant scope, freshness, and a decision-led customer task.
Compare Sisense alternatives by embedding route, semantic results, identity, product experience, operations, commercial terms, and a recoverable cutover.
Choose and test the exact Qlik deployment route before comparing alternatives: authenticated customer analytics, Anonymous Access, and no-auth snapshots have different contracts.
Build logistics dashboards from governed shipment milestones, explicit SLA clocks, correction-aware metrics, and an owned exception response.
Power BI and Looker take fundamentally different approaches to business intelligence. Here's what matters when choosing between them.
Build supply-chain dashboards from governed order, shipment, inventory, supplier, and cost contracts instead of borrowed thresholds.
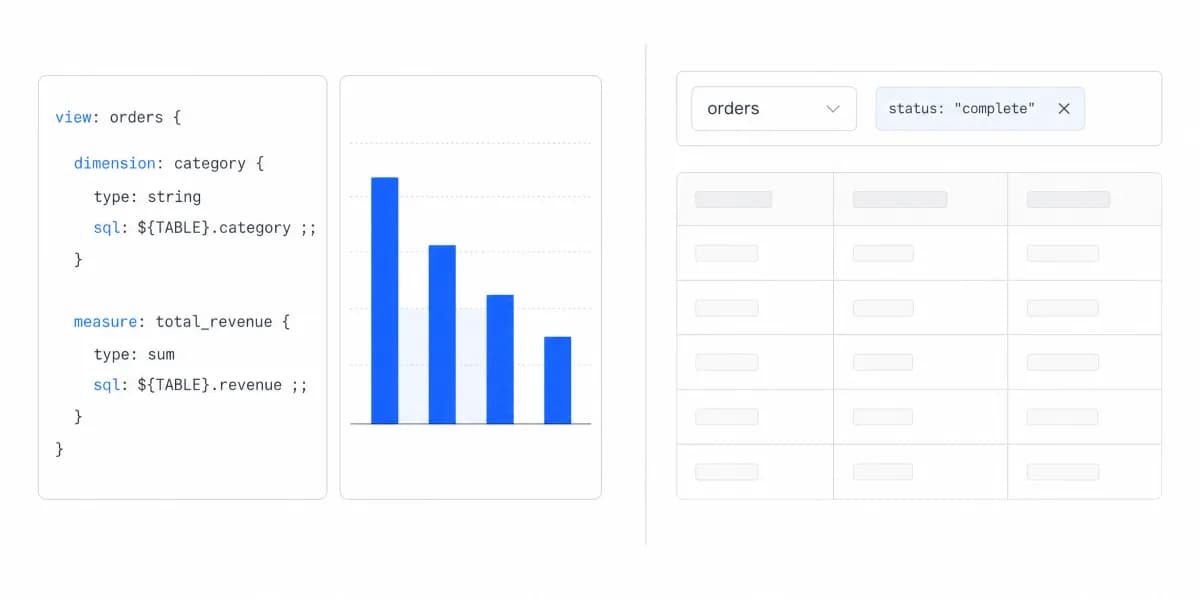
Comparing Power BI and Looker for embedded analytics? Here's what product teams miss when choosing between enterprise BI tools.
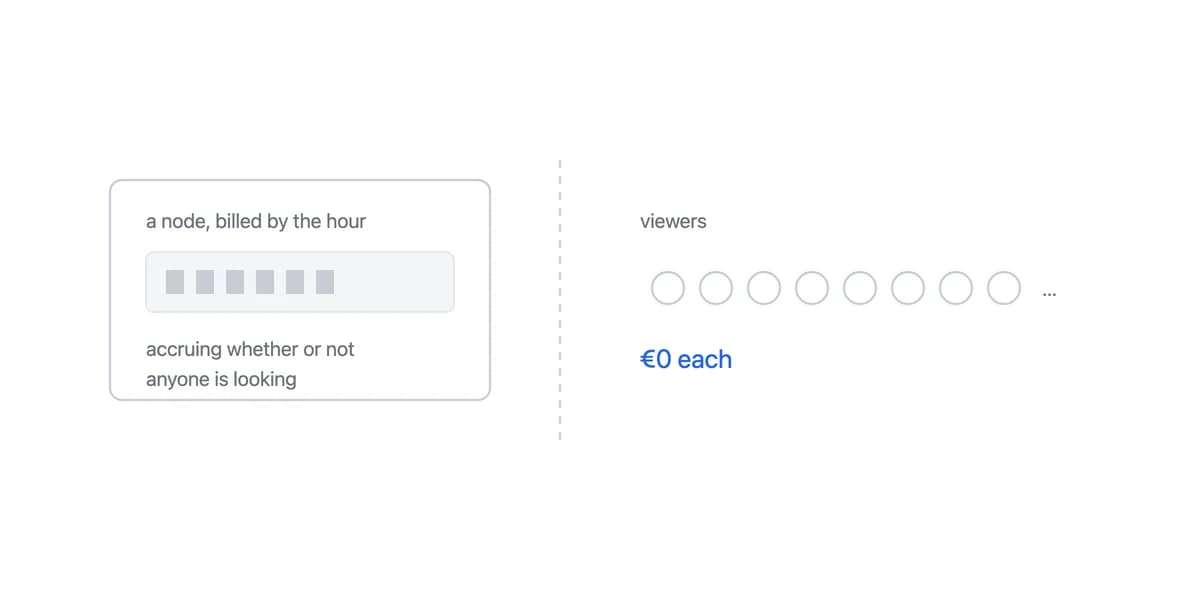
Power BI Embedded works for Microsoft shops, but SaaS teams hit Azure costs and integration complexity fast. Here's what to look for instead.
Compare Metabase with embedded-first analytics using architecture, branding, tenancy, operating cost, and current pricing evidence.
Most campaign dashboards show you data. The best ones show you what to do next.
Build a revenue dashboard that separates subscription metrics, recognized revenue, and cash, then reconciles each number to its source and policy.
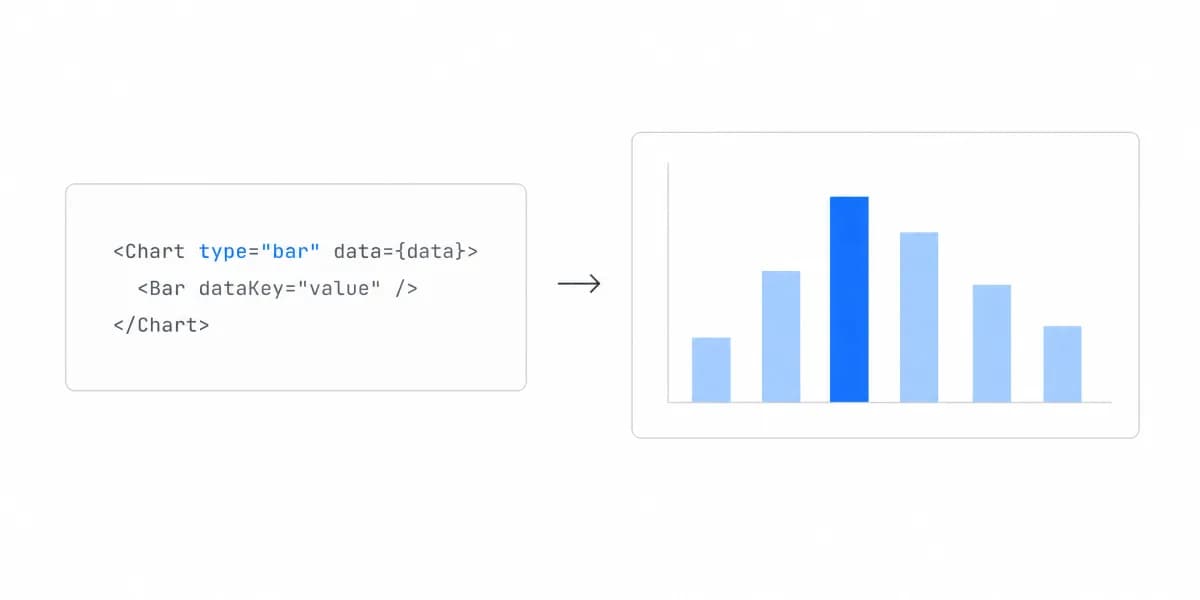
Compare Recharts and Victory by web API, maintenance signals, measured performance, accessibility, and the separate Victory Native path.
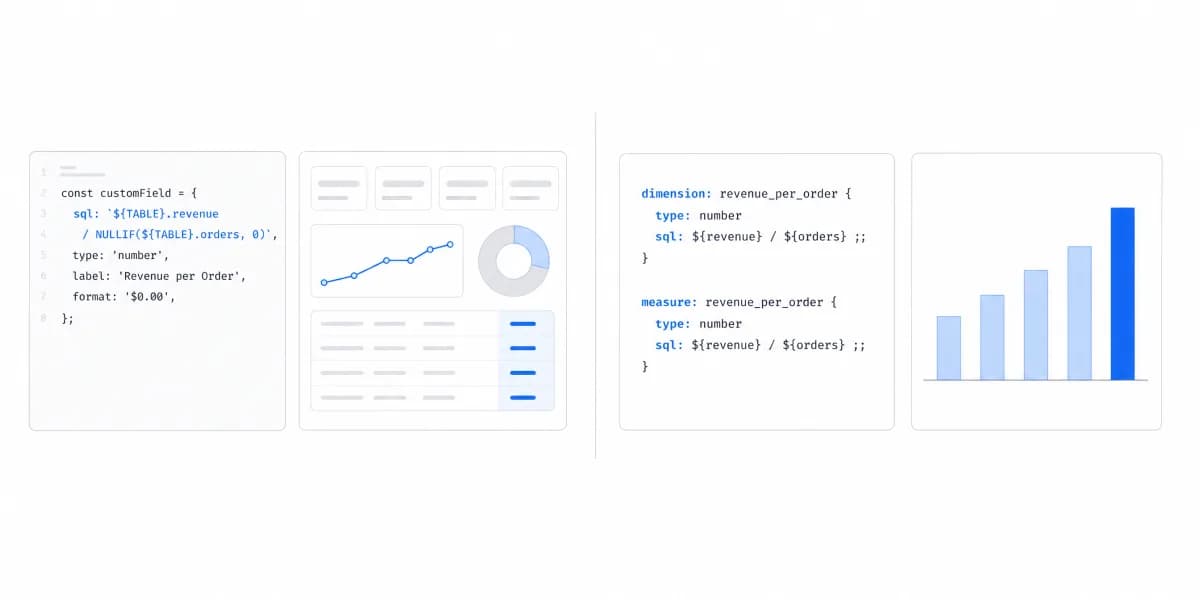
Looker and Metabase both support embedded analytics. Compare their semantic models, identity routes, operations, commercial terms, and exit evidence.
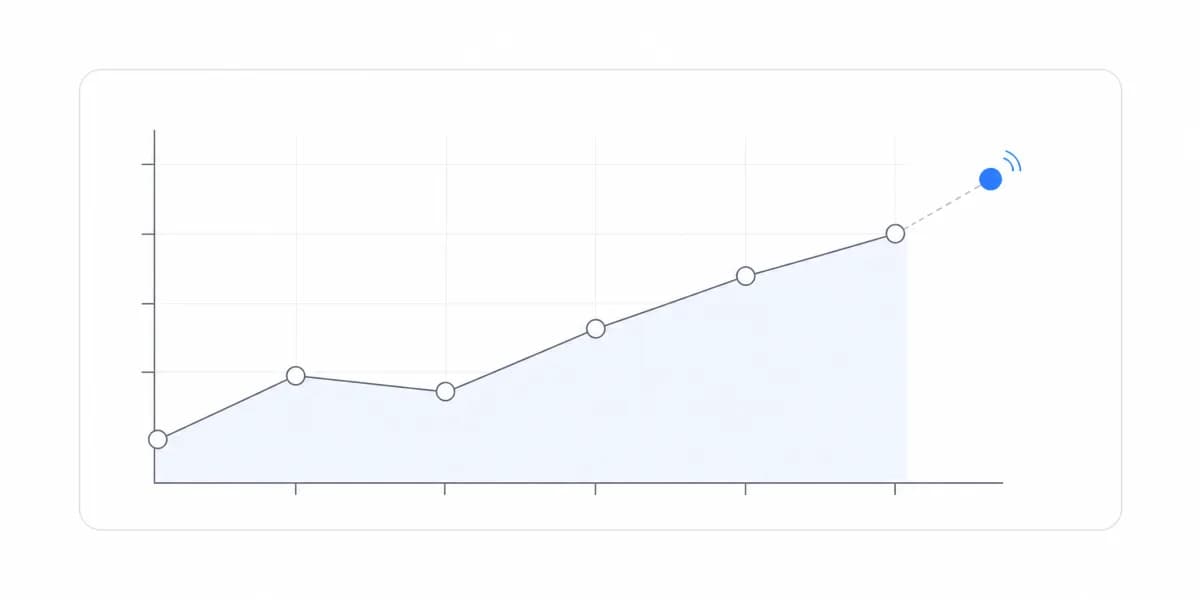
Choose streaming from decision latency, then define event time, watermarks, late data, corrections, backpressure, serving state, and recovery.
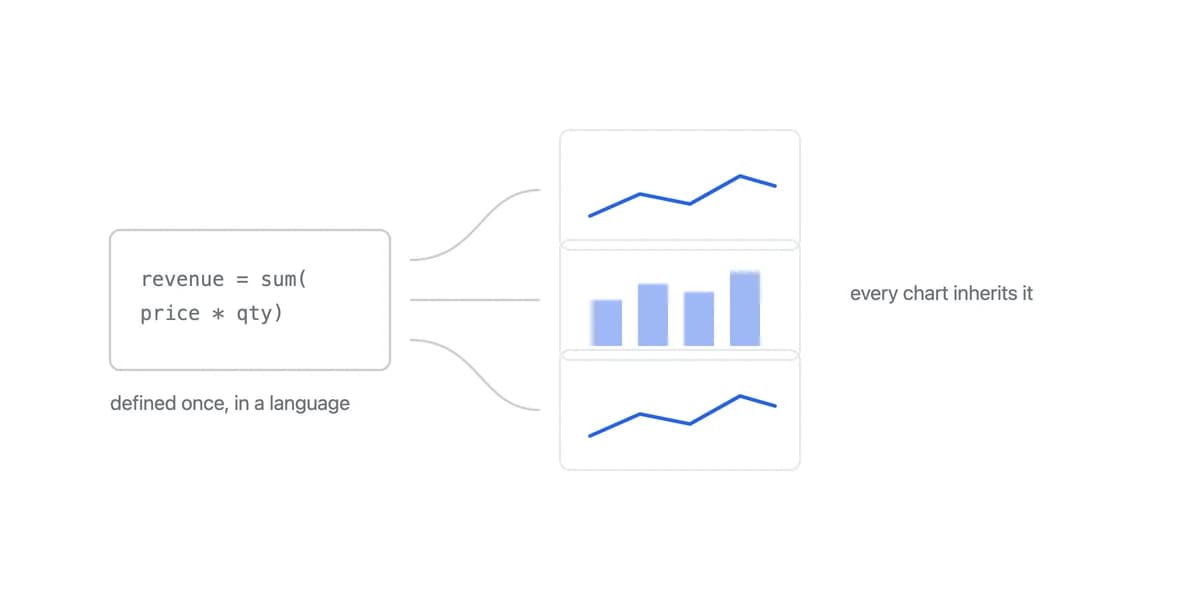
A Looker replacement decision should inventory semantics, access, embedding, artifacts and commercial terms, then prove a bounded candidate slice.
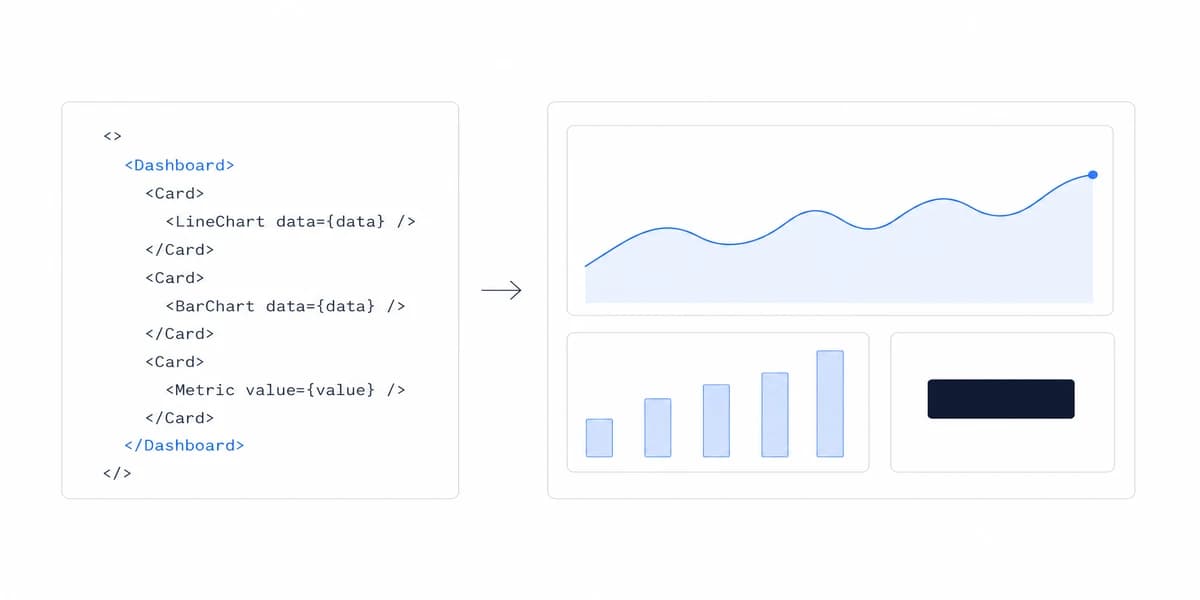
Most React component libraries are built for admin panels. Here's what changes when you're building customer-facing analytics.
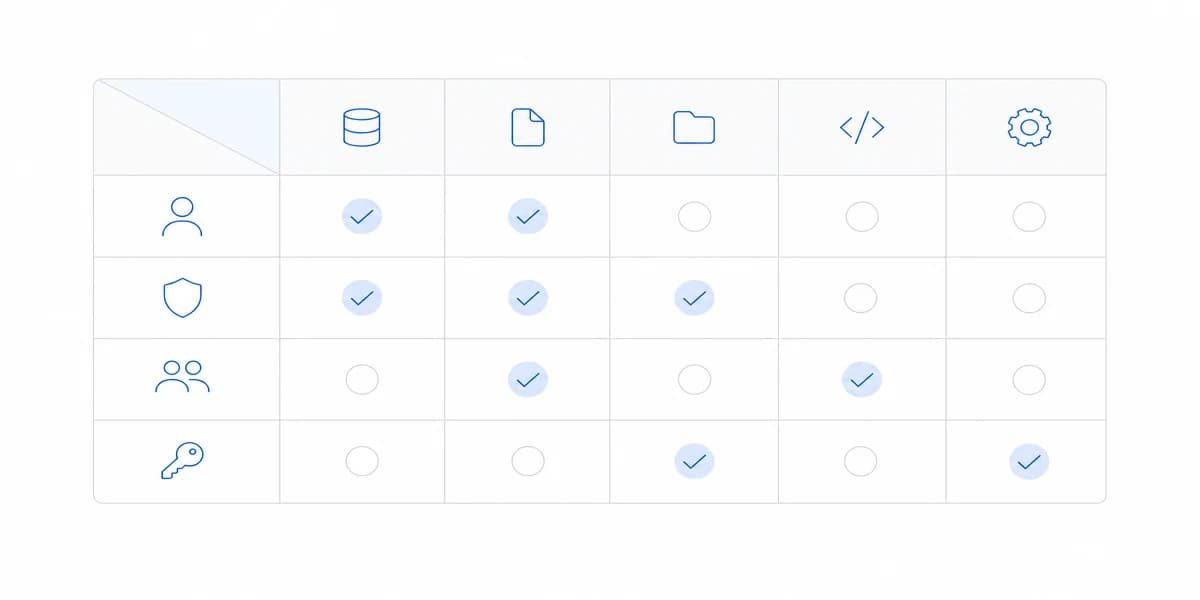
Define patient metrics, authorization, provenance, presentation, and release evidence before embedding a healthcare dashboard.
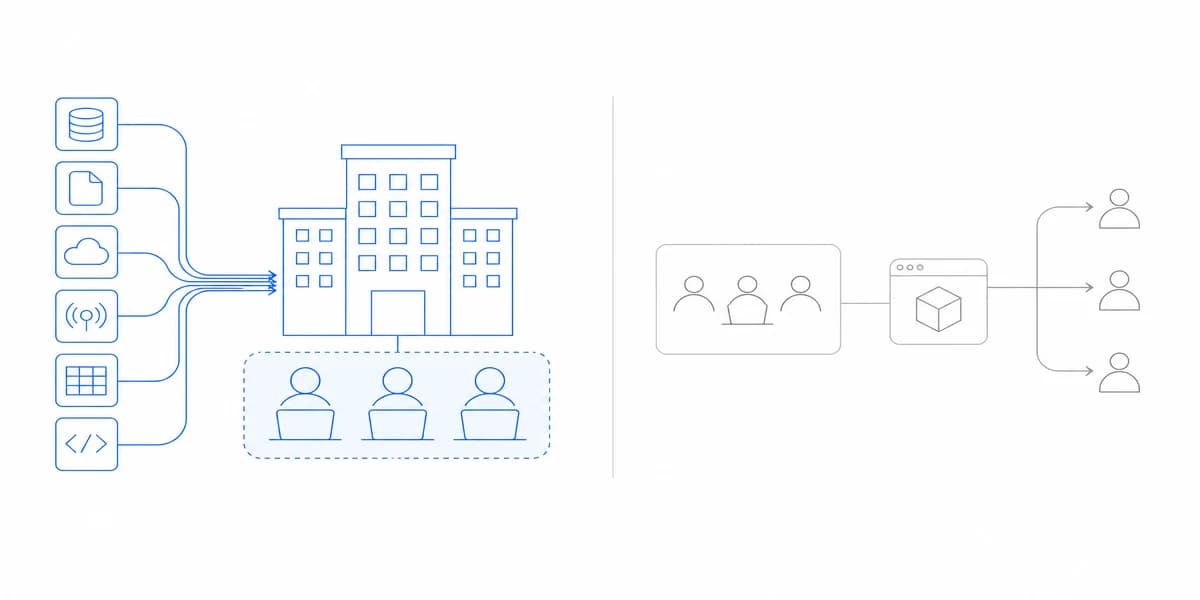
Grafana and Metabase overlap at dashboards but differ in workload, access, delivery, and operations. Use a production-shaped test to choose.
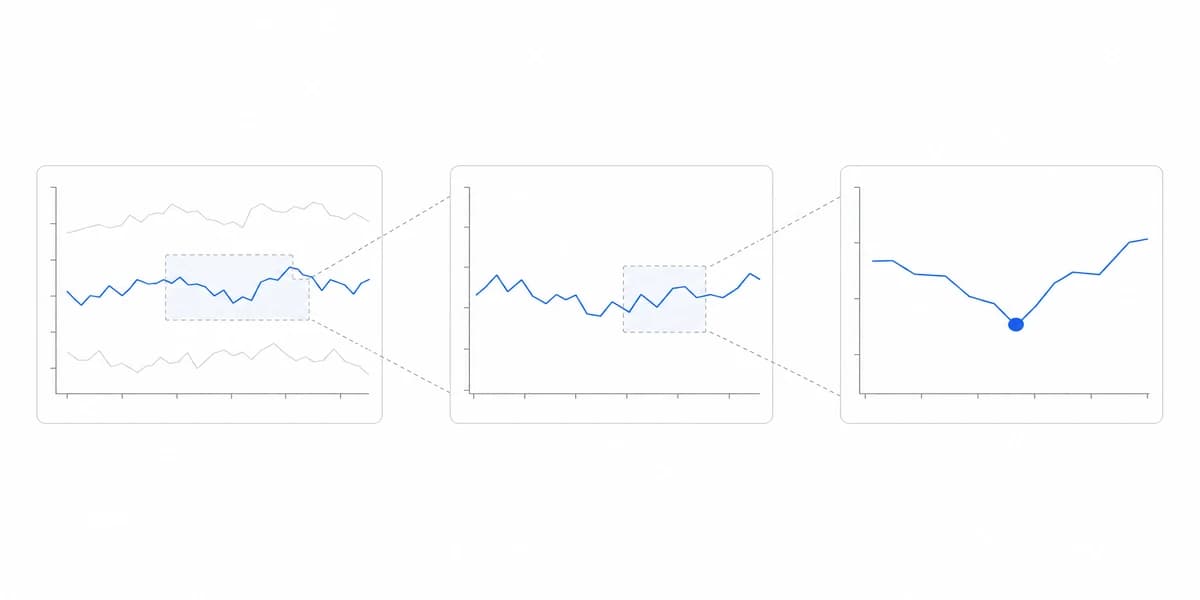
Design analytical dashboards as a governed loop from a decision question through comparison, drill-through, evidence, action, and saved context.
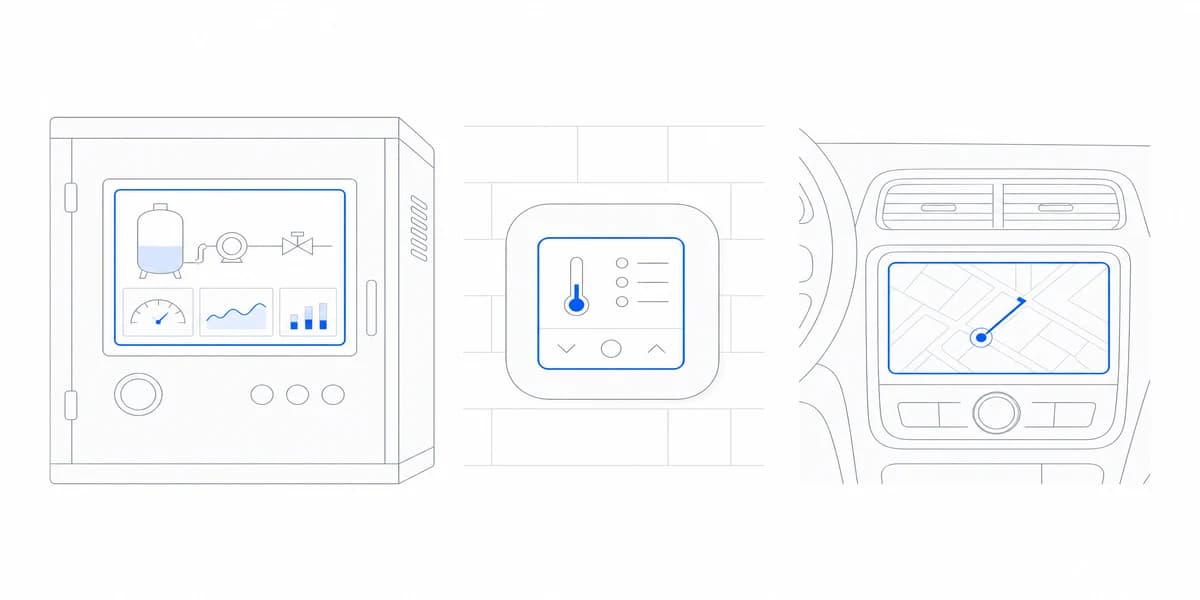
Define manufacturing metrics from eligible events, reconcile their sources, apply tenant and role scope, and connect every signal to an owner.
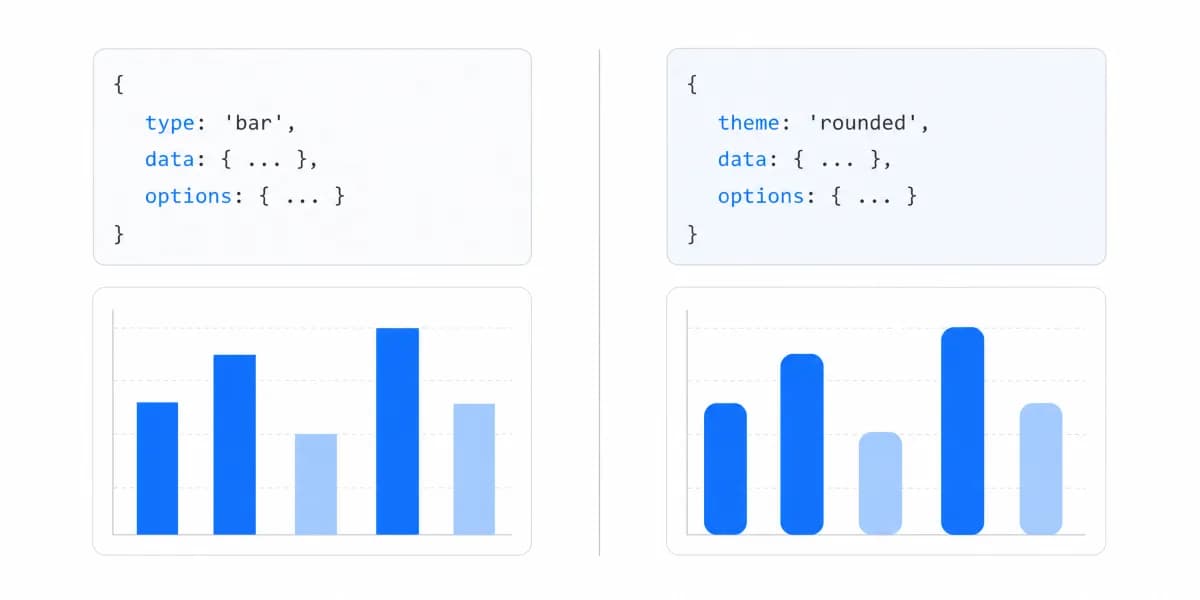
Compare Chart.js and Highcharts by licence scope, rendering model, export, accessibility, performance evidence, and the product work both leave behind.
Grafana visualizes far more than infrastructure metrics. The right alternative depends on identity, tenancy, workflow, and branding requirements.
Most SaaS products don't need true real-time analytics. Here's how to know when you do, and what it takes to deliver it.
ECharts handles complex visualizations well, but building production customer-facing dashboards requires more than a charting library.
Looking beyond Domo for customer-facing analytics? Here's what SaaS product teams are choosing instead.
Turn healthcare KPI labels into versioned measure contracts with defined populations, sources, adjustment, authorization, and permitted decisions.
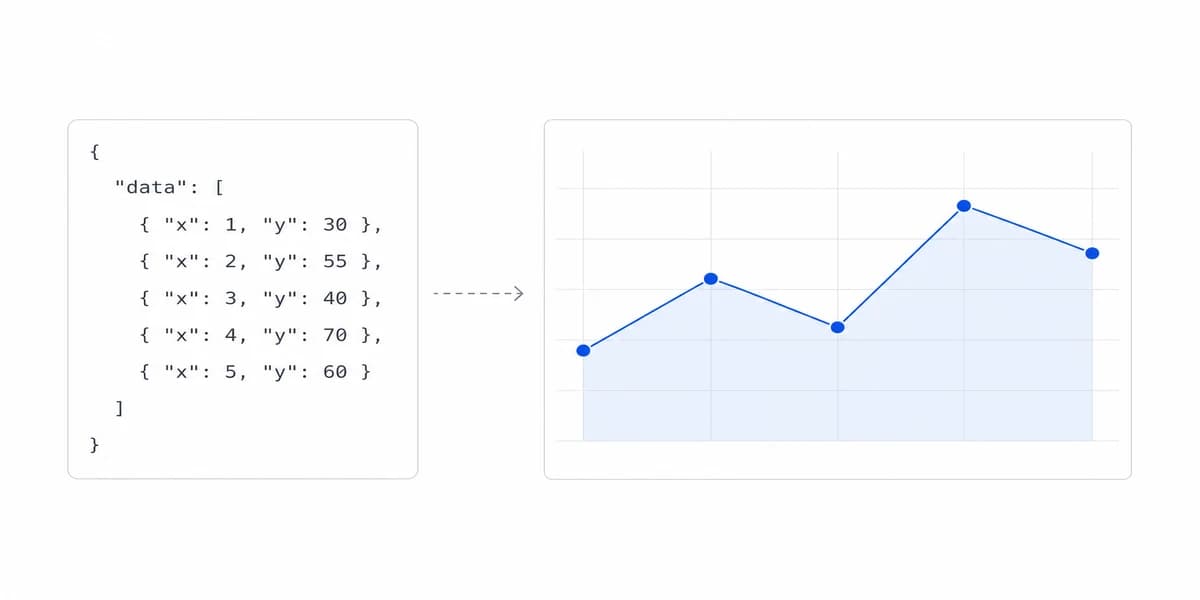
D3 provides low-level visualization building blocks. Use this decision framework to separate custom rendering value from the dashboard capabilities your team still owns.
Choose live-dashboard refresh, caching, alerting, and audience views from decision latency and measurable system constraints.
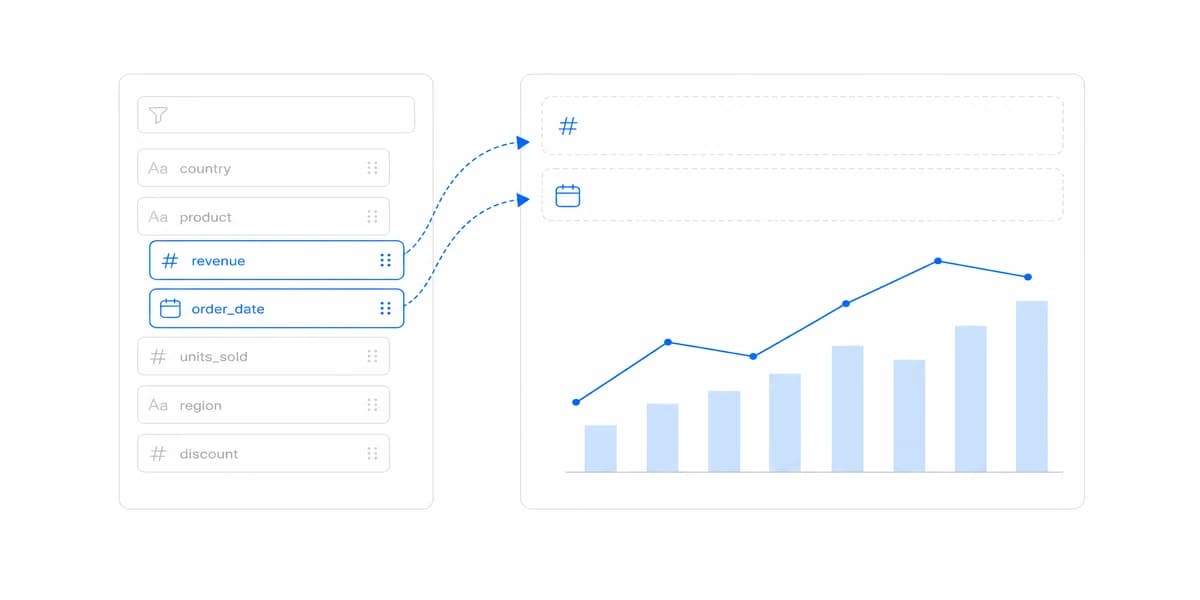
Design customer-facing financial metrics across subscription activity, accounting policy, cash timing, tenant scope, close, and reconciliation.
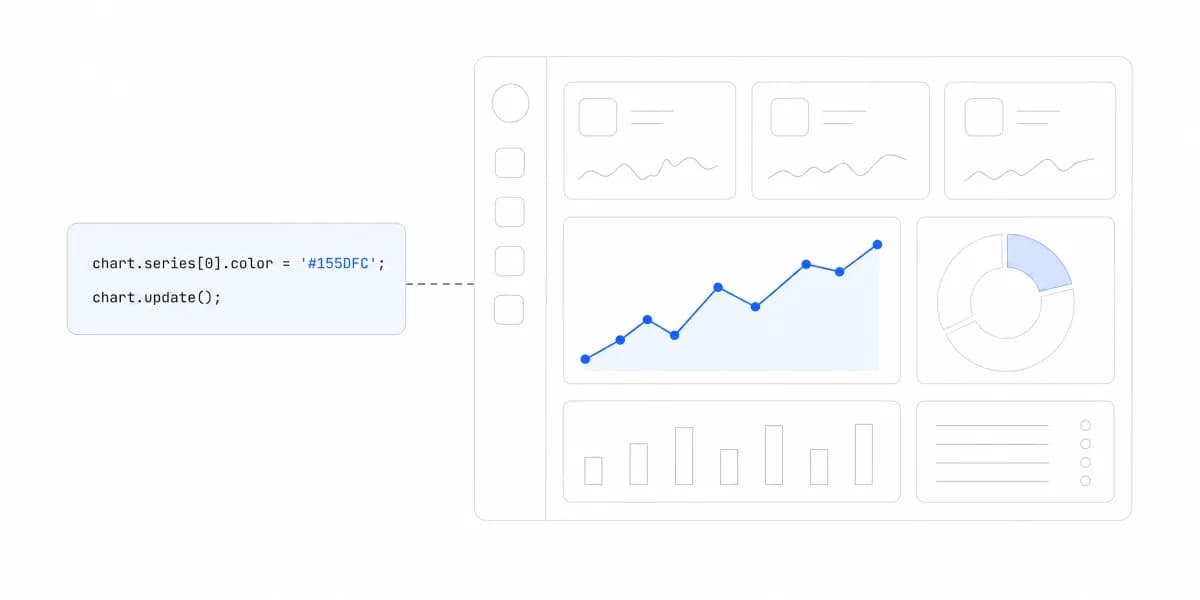
Chart.js renders to canvas, and that one decision drives everything after it: responsive containers, lifecycle cleanup, accessibility, and what performance you can actually measure.
Most cash flow dashboards show you what happened last month. The best ones help you make decisions about next month.
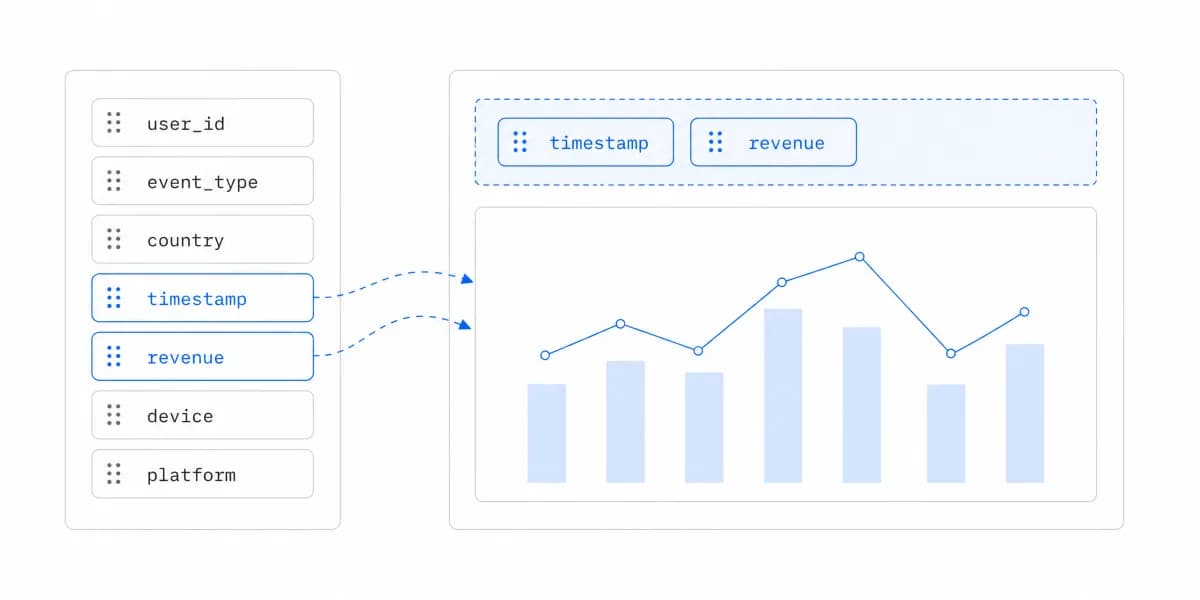
Most self-service analytics tools are built for internal BI teams. If you're building customer-facing analytics, here's what actually matters.
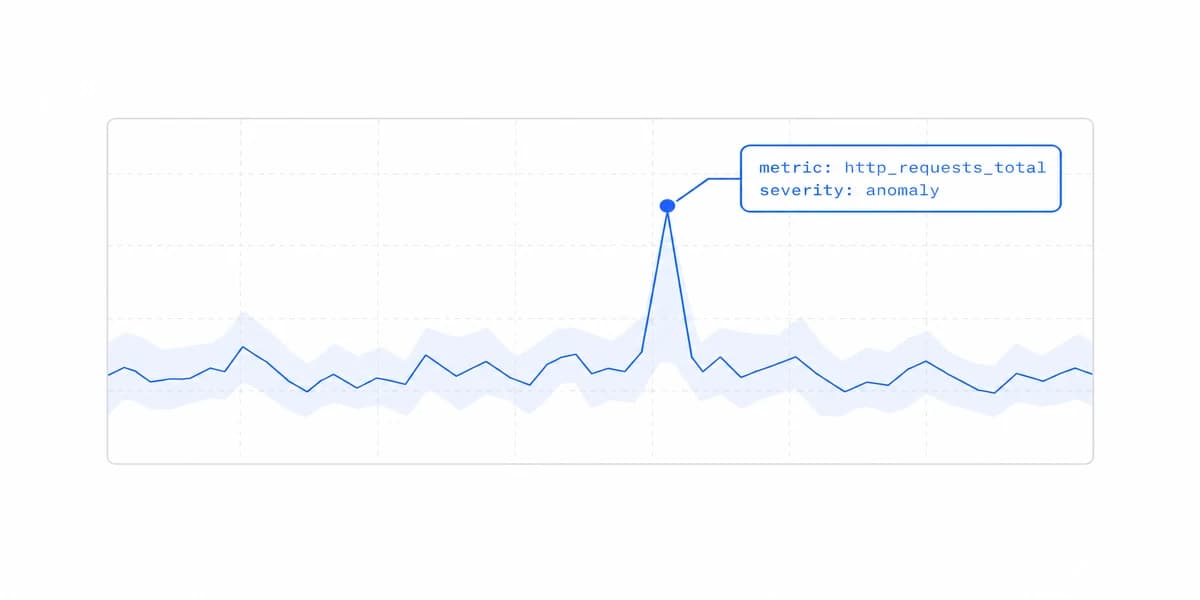
AI agents that don't just surface insights, they decide and act. Here's what agentic analytics means for embedded platforms.
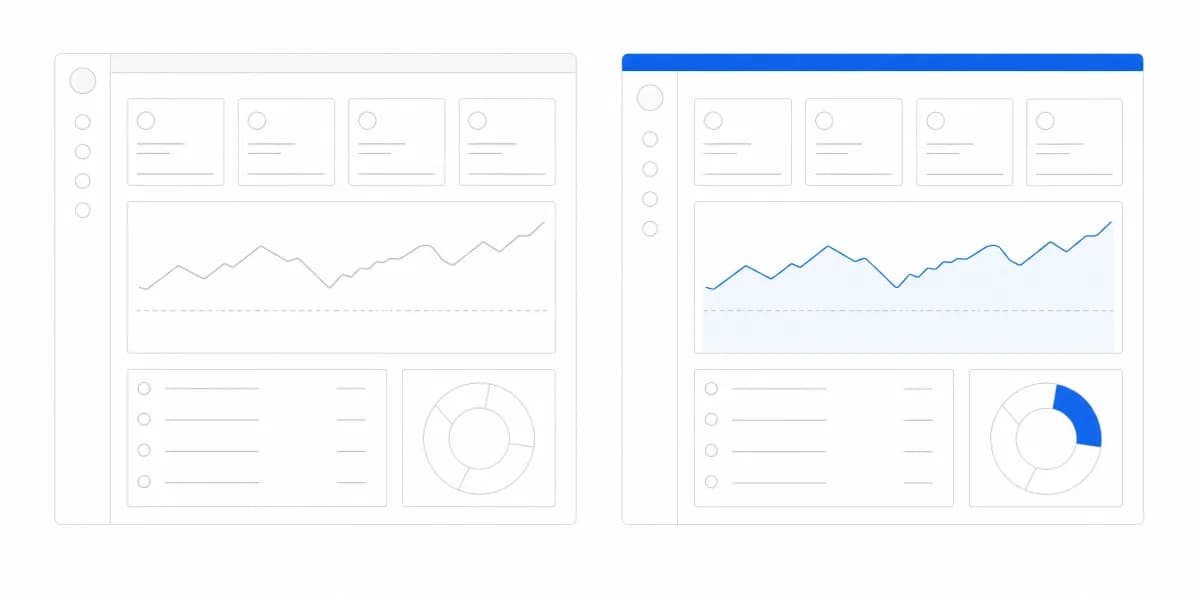
Agencies are discovering white label analytics opens doors beyond campaign reporting, from embedded product analytics to new revenue streams.
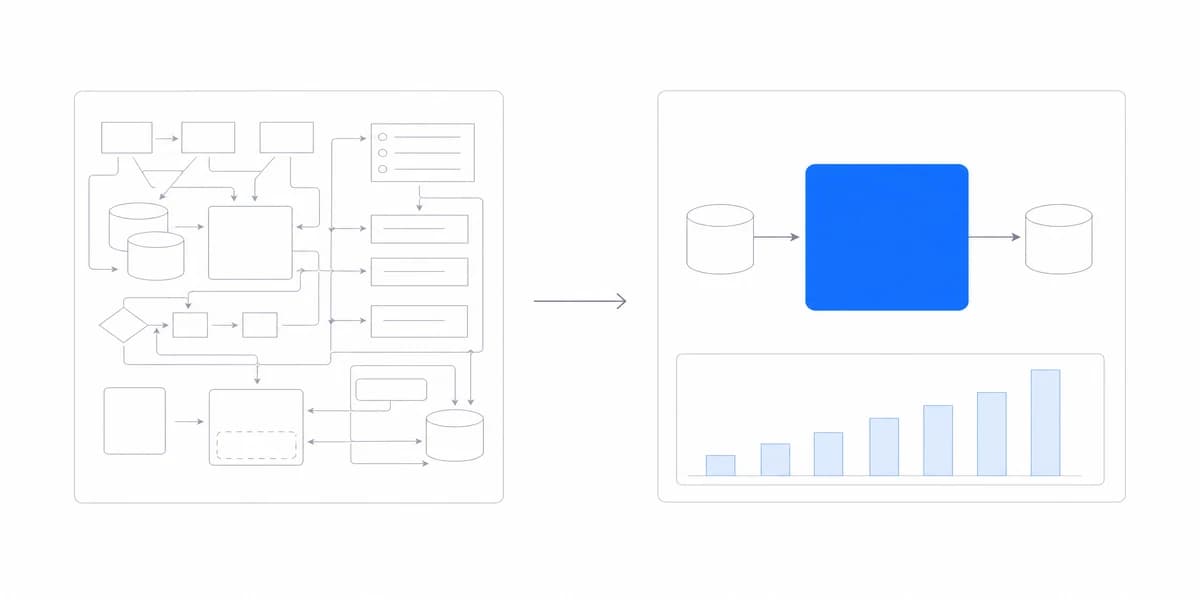
Why the best embedded dashboards blend smoothly into your product, and how to design for both speed and brand consistency.
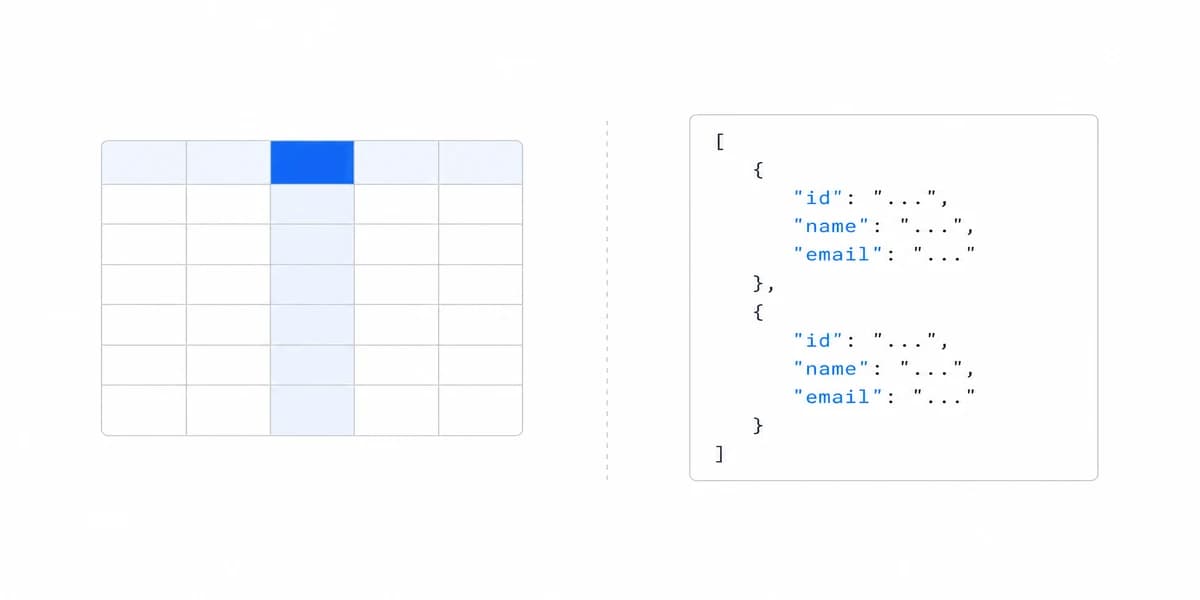
Turn one customer task into a production-shaped slice with trust, runtime, accessibility, operating, and rollout evidence.
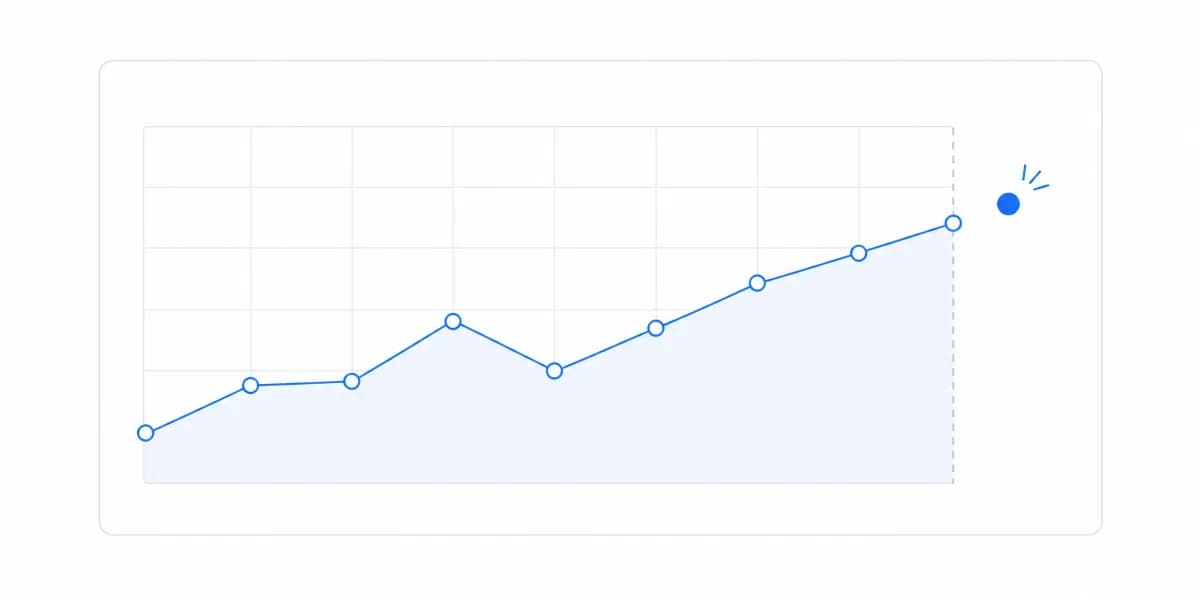
The best ML models are useless if users can't understand them. Here's how modern teams are making machine learning transparent through visualization.
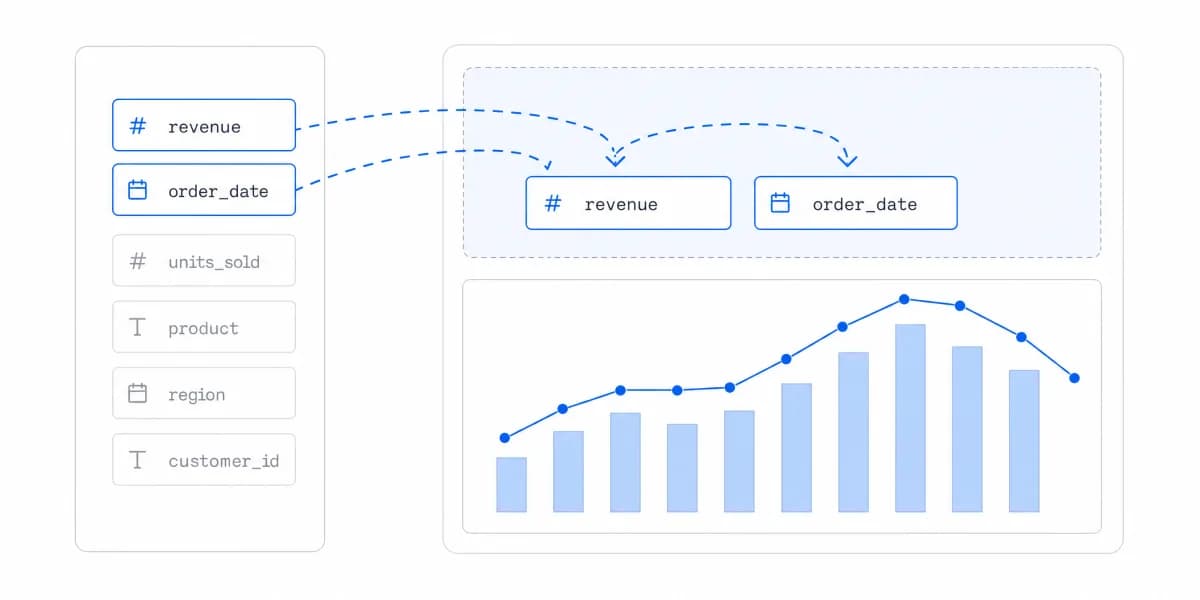
Design self-service analytics as a governed path from a scoped question to a published, supported, and safely retired customer artifact.
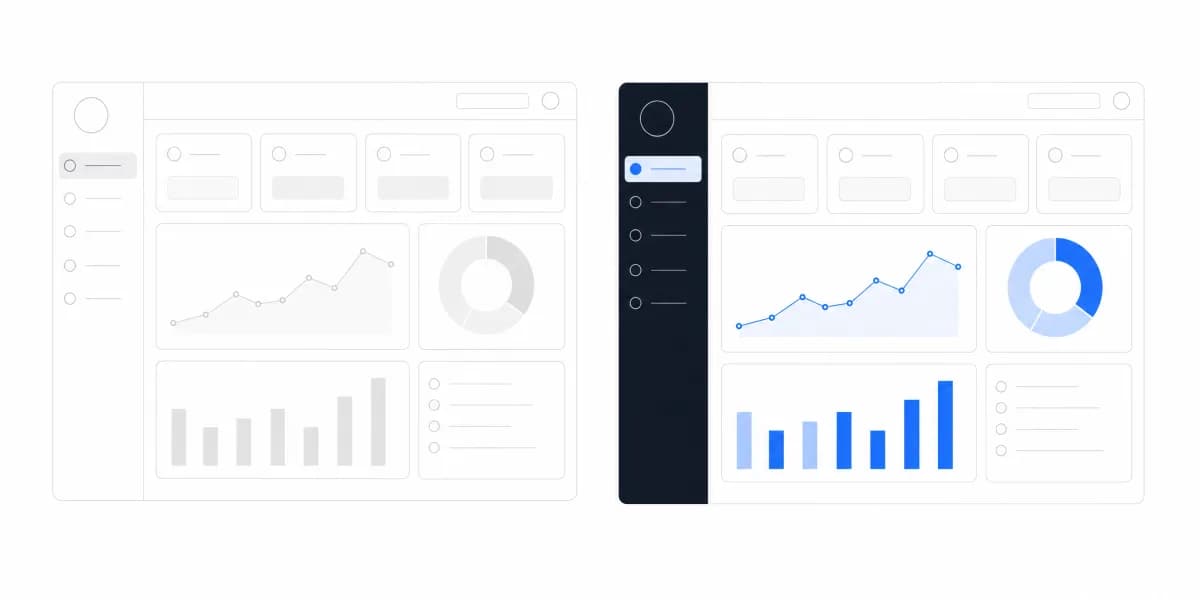
White-label analytics aligns embedded reporting with a host product across branding, interaction, identity, exports and messages. Which surfaces to specify, and how to test that they hold.
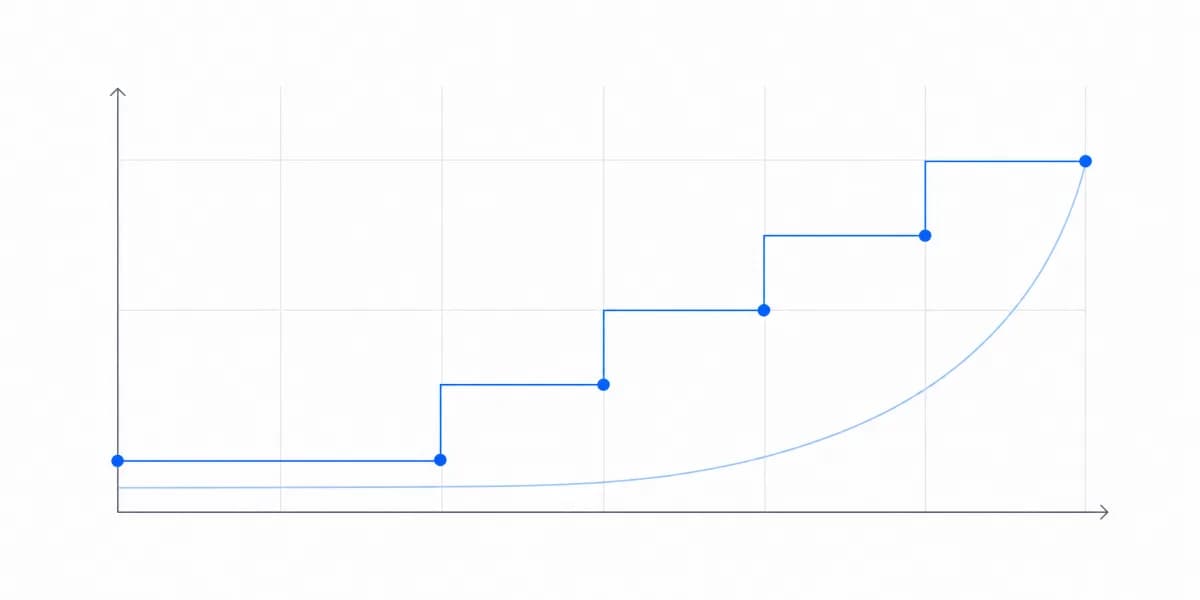
Model embedded analytics ROI with explicit cost, adoption, revenue, retention, and opportunity-cost inputs instead of unsupported benchmarks.
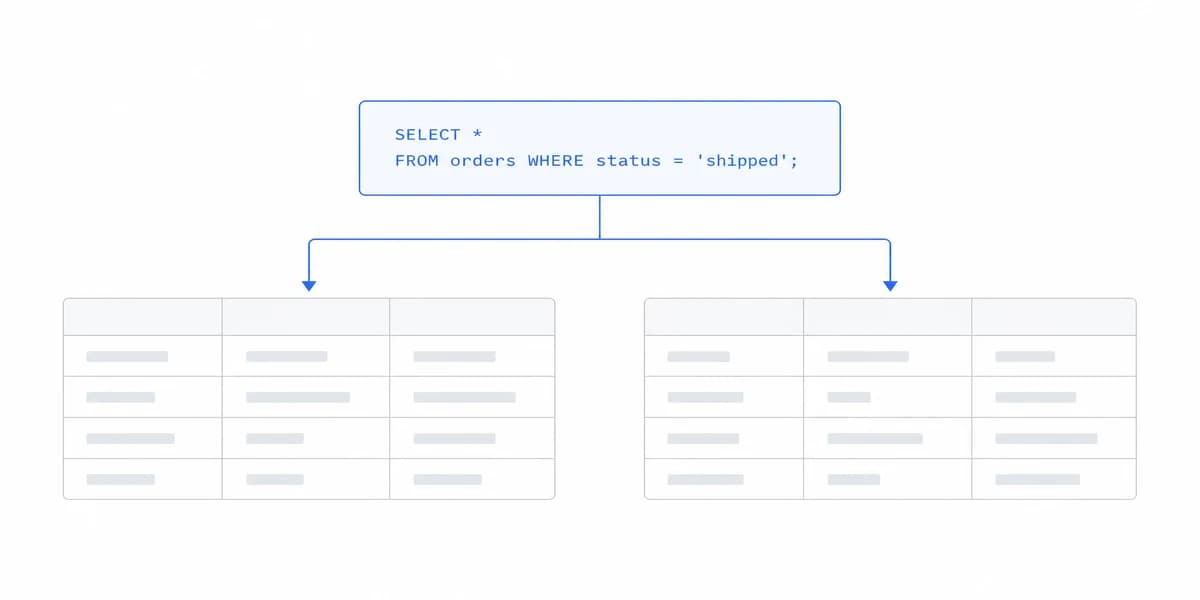
Internal and customer-facing analytics may use similar charts, but their audiences, decisions, access models, and failure paths are different.
Compare embedded analytics pricing by billing unit, production workload, excluded costs, and three-year forecast, not the headline price.
Security isn't a feature list. It's the foundation that makes or breaks customer trust in your SaaS product.
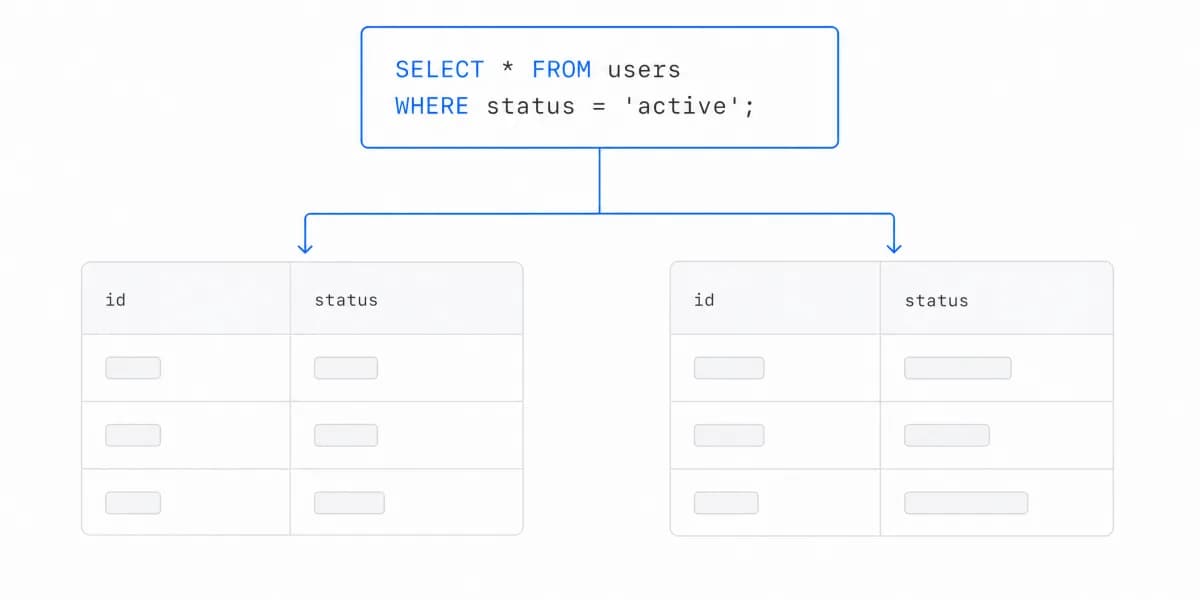
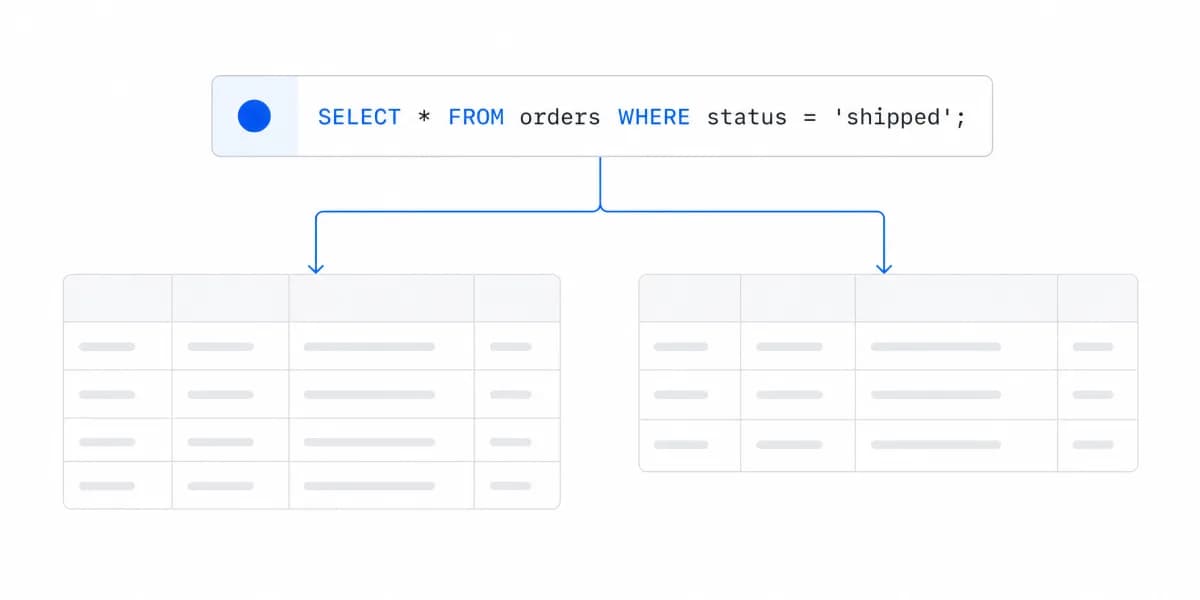
A multi-tenant analytics design must preserve trusted tenant scope through identity, routing, authorization, workload control, delivery, and operations.
A practical framework for personalizing customer-facing dashboards without confusing behavior signals with intent or weakening tenant isolation.
Most vendors tell you iframes are dead. Here's what you actually need to know about integration methods.
Most embedded analytics implementations take weeks. Here's why Sumboard customers go live the same day.
Compare embedded analytics across one acceptance contract, realistic workload cases, lifecycle cost, and exit terms.
Compare standalone and embedded analytics as delivery boundaries across identity, workflow, semantics, experience, operations, and cost.
Design embedded analytics as a governed path across host identity, tenant scope, query enforcement, runtime states, artifacts, and operations.
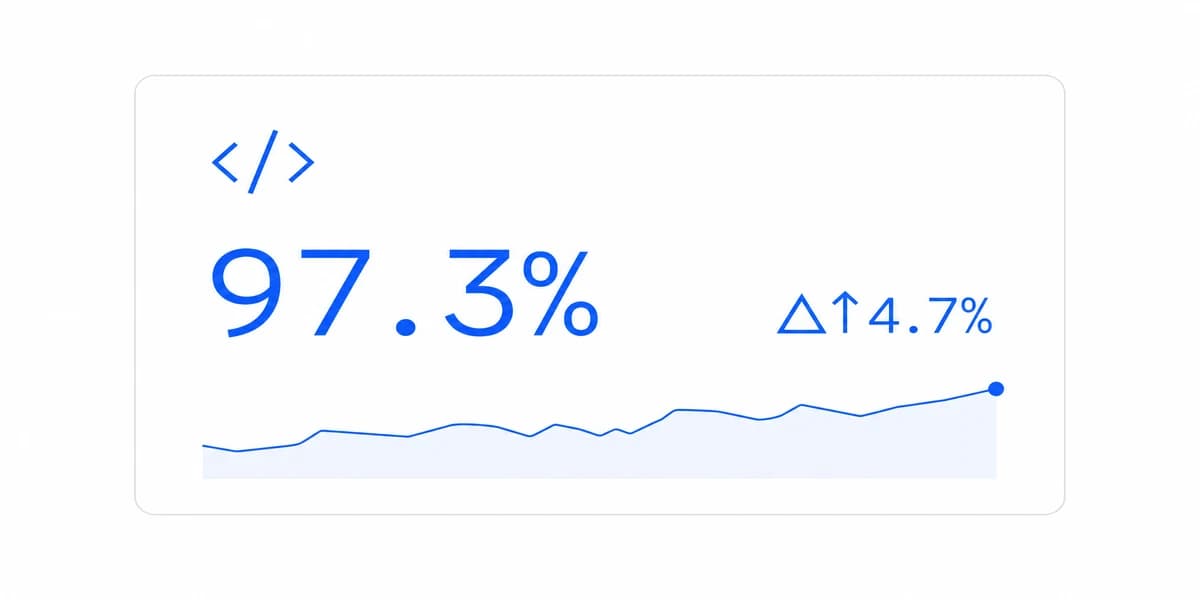
Study public analytics surfaces without copying their outcome claims: translate each pattern into a local task, guardrail, and measurable hypothesis.
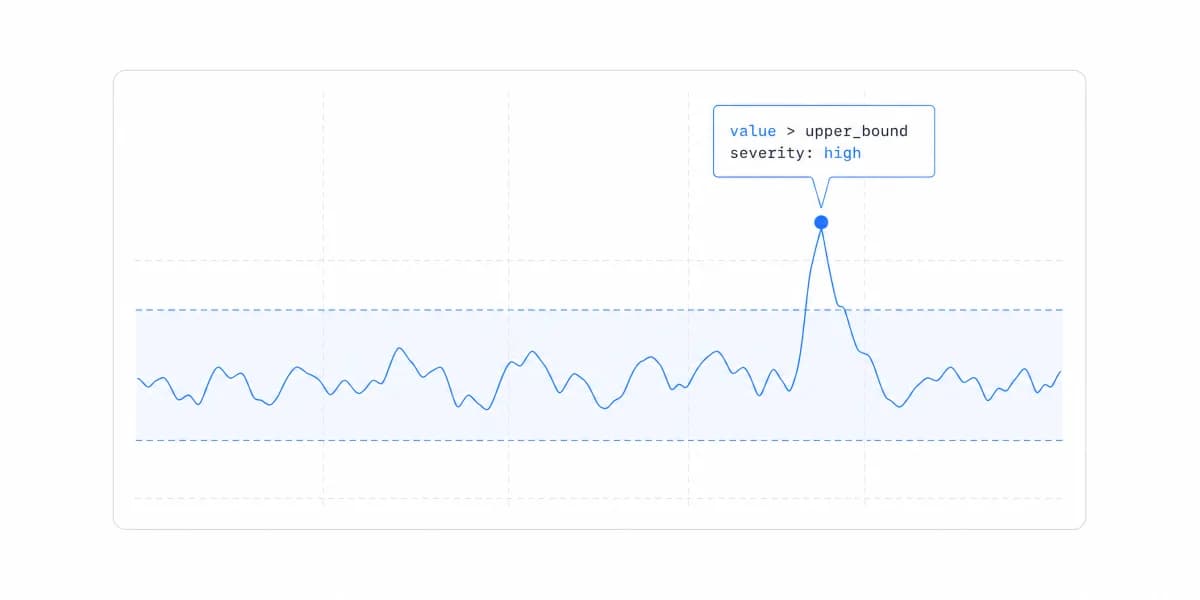
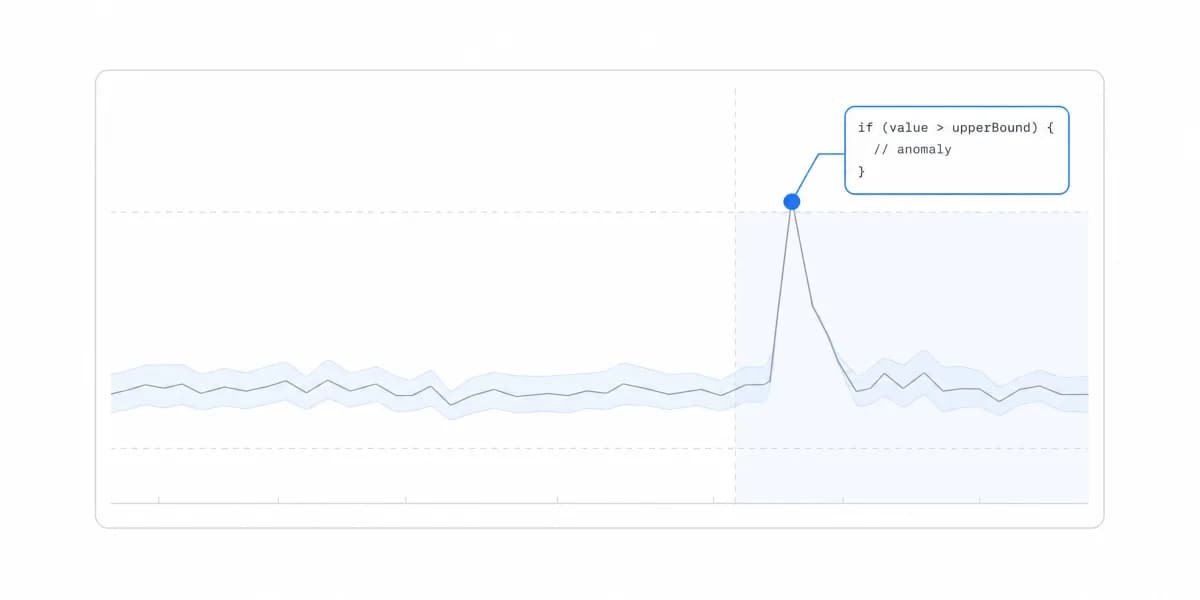
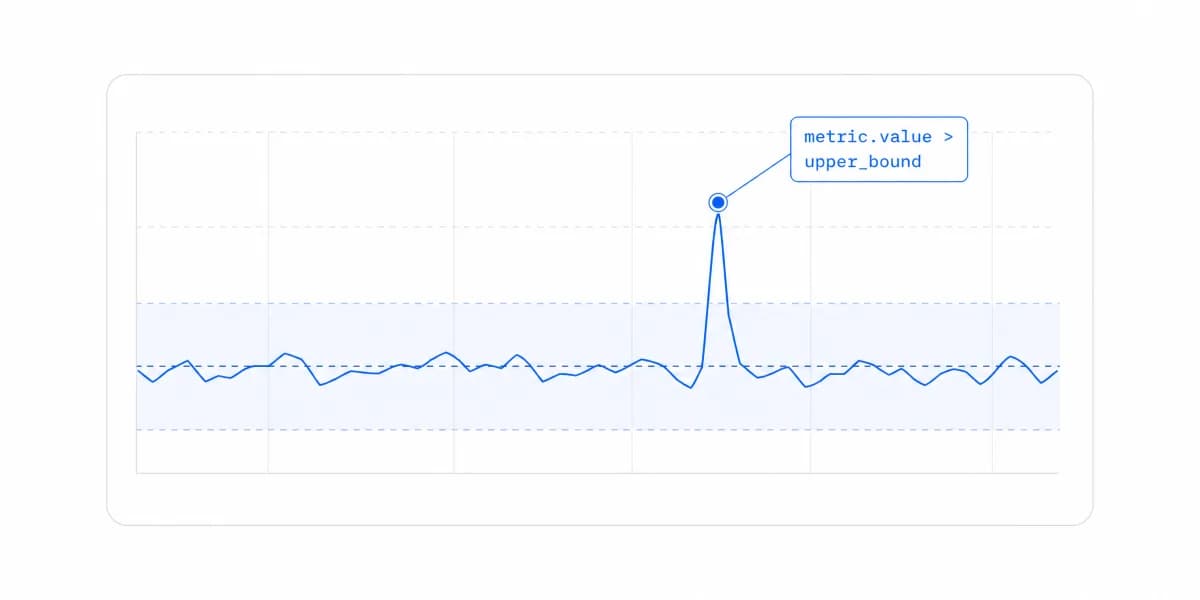
Design automated insights as an evidence path: detect a signal, show its limits, bound the action, and measure the outcome.
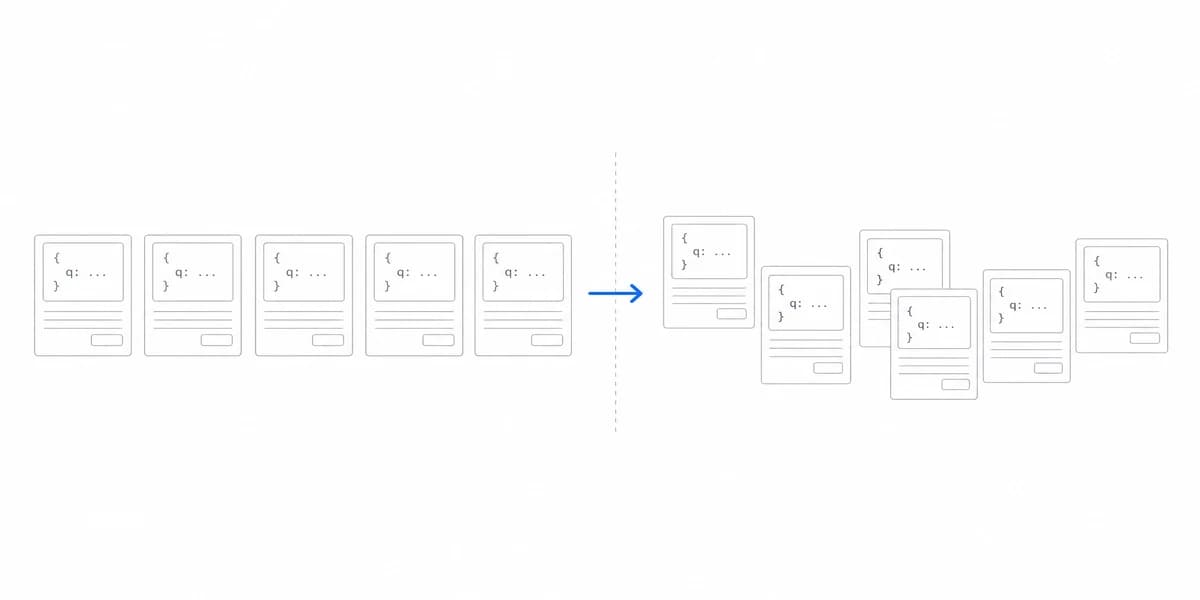
Compare customer self-service, operational, agency white-label, and product-usage analytics by evidence signal, production boundary, and pilot measure.
From 10-minute integrations to new revenue streams, real results from product teams who made the switch.
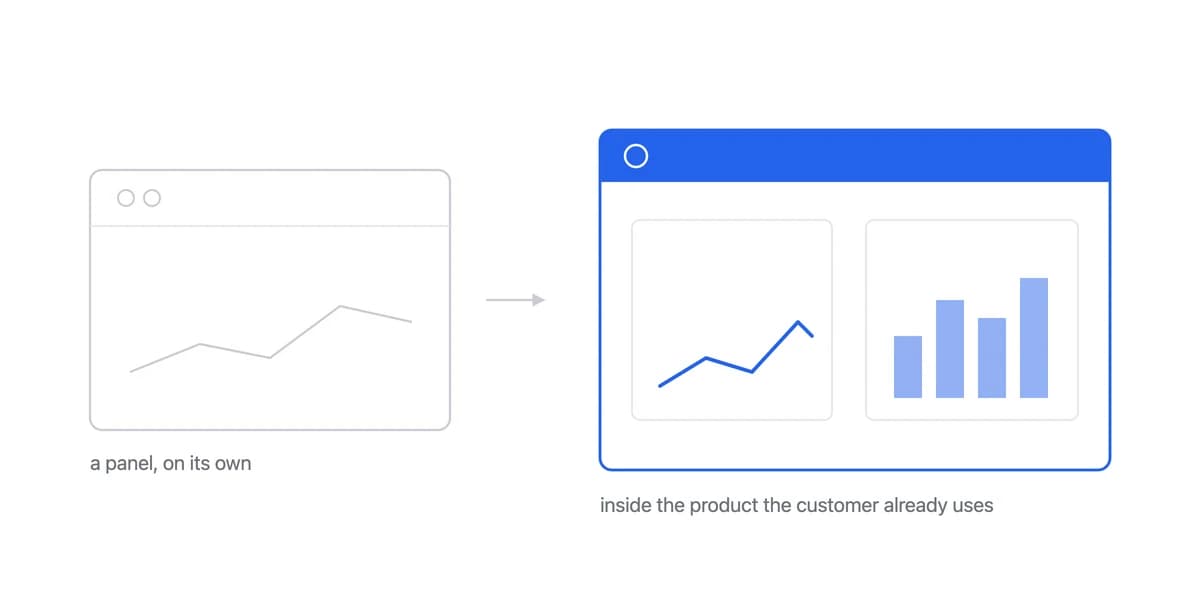
Embedded analytics places governed analytical workflows inside a product experience. The trust path, the integration models, what stays your responsibility, and the build-versus-platform decision.
Moving beyond 'what happened' to 'what's next', and why embedding predictions changes everything.
Treat self-service analytics as a lifecycle for exploring, reviewing, publishing, and operating trustworthy content.
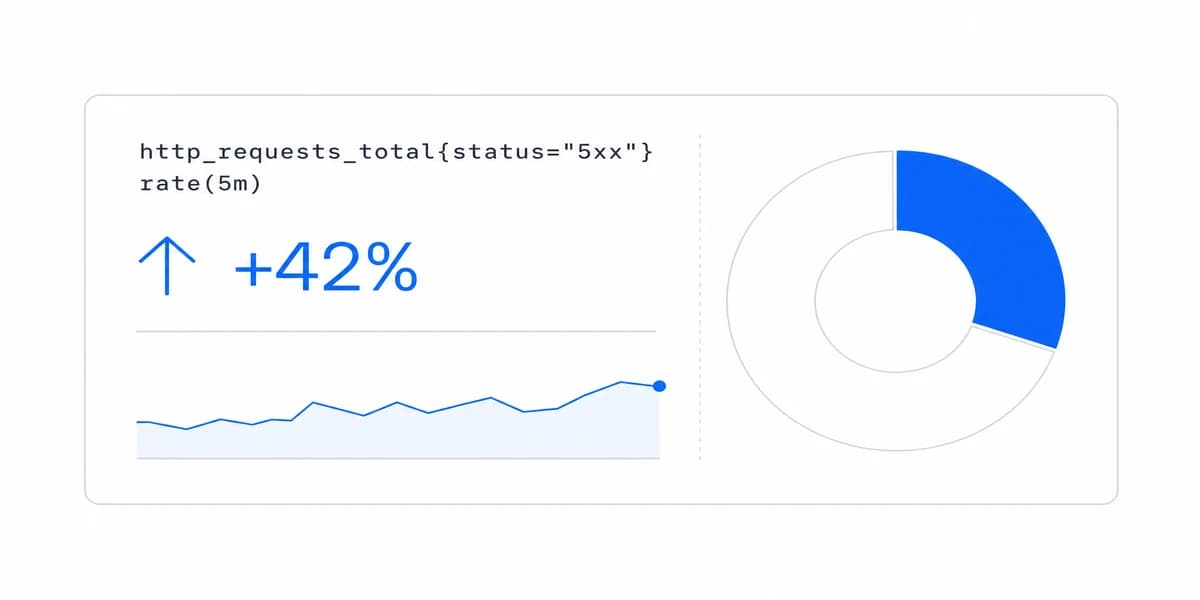
An operational dashboard should turn a current signal into owned, authorized, and verifiable work, not merely refresh a wall of KPIs.
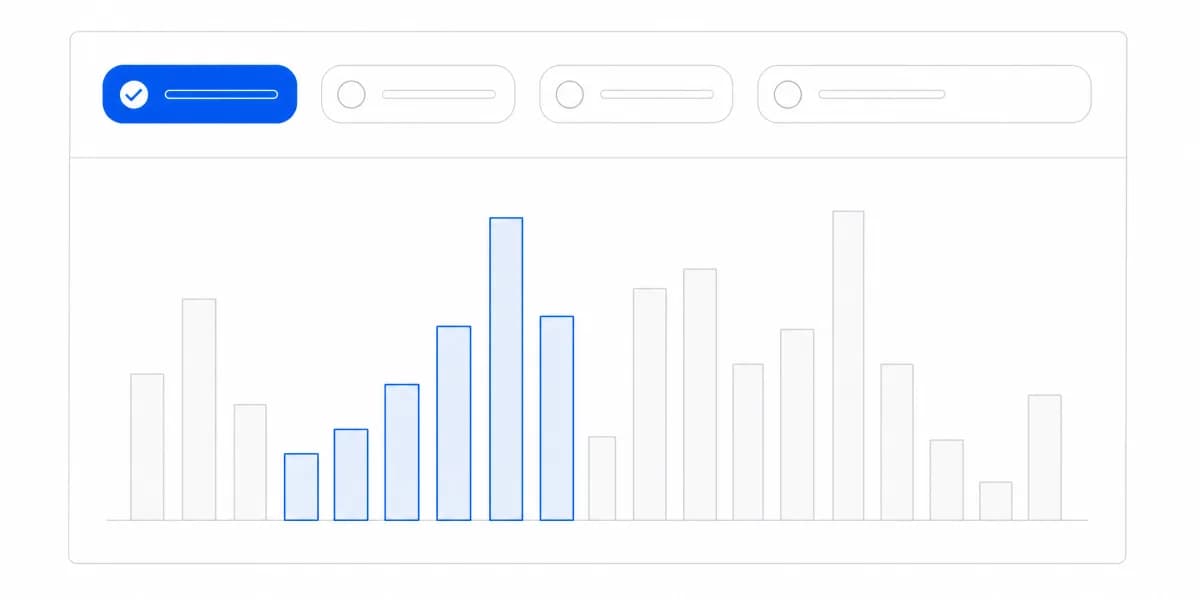
Filters, drill-through, refresh, saved views, and actions earn their place when they help a permitted user reach a better decision without losing context.
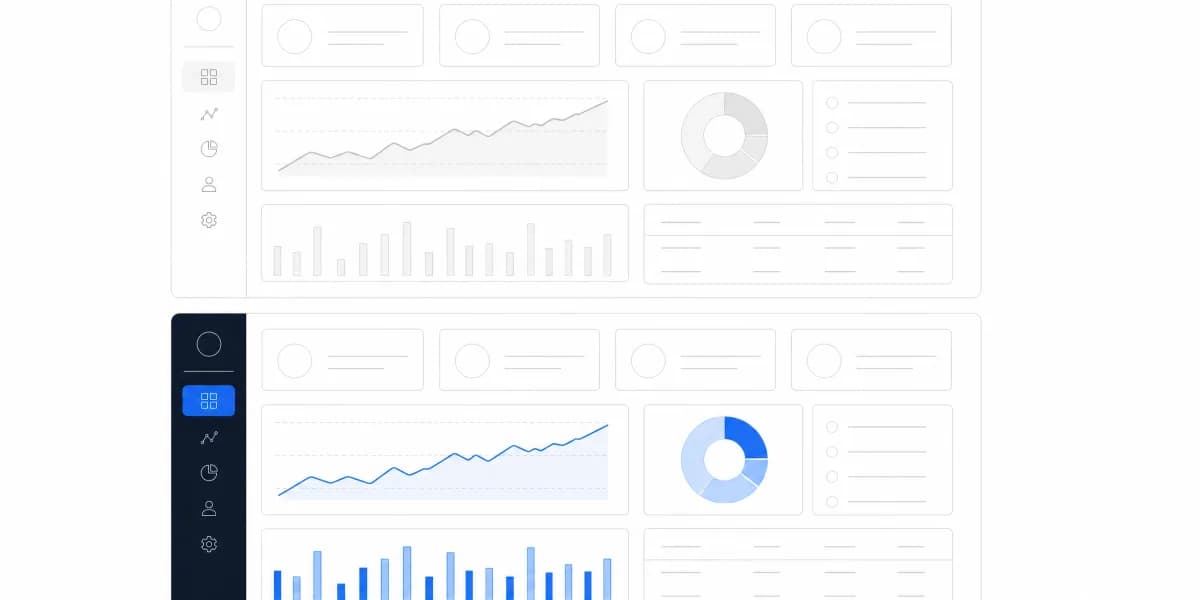
A practical implementation sequence for white-label dashboards: define surfaces, choose the rendering boundary, map design tokens, prove tenant isolation, test artifacts, and set release gates.
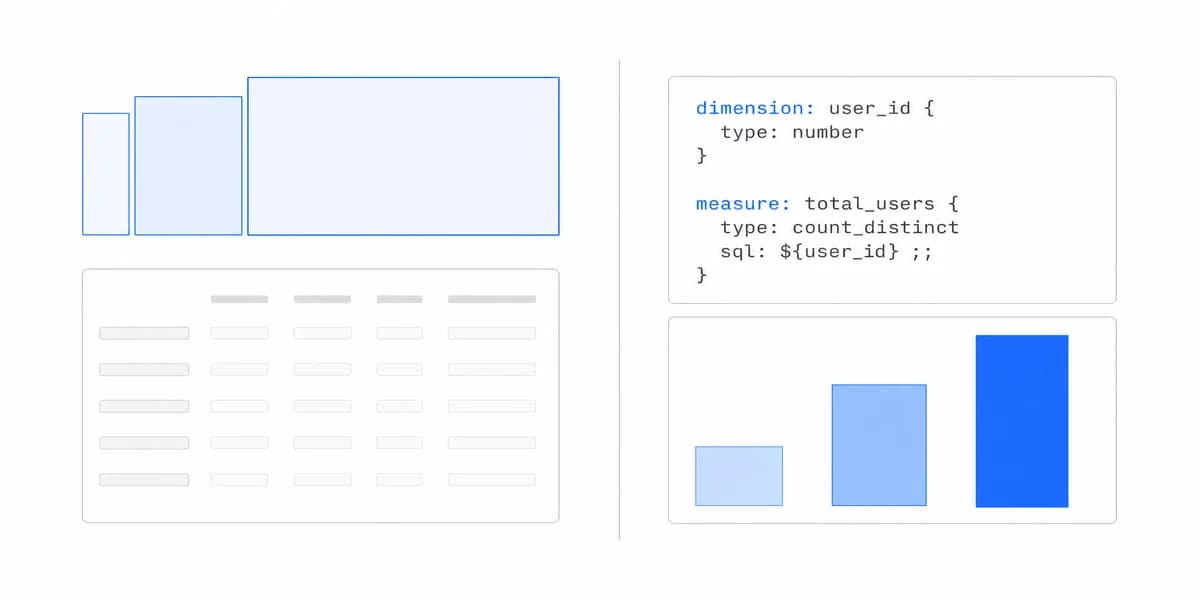
Customers are asking follow-up questions your static dashboards can't answer. Here's where the industry is heading, and what you can ship today.
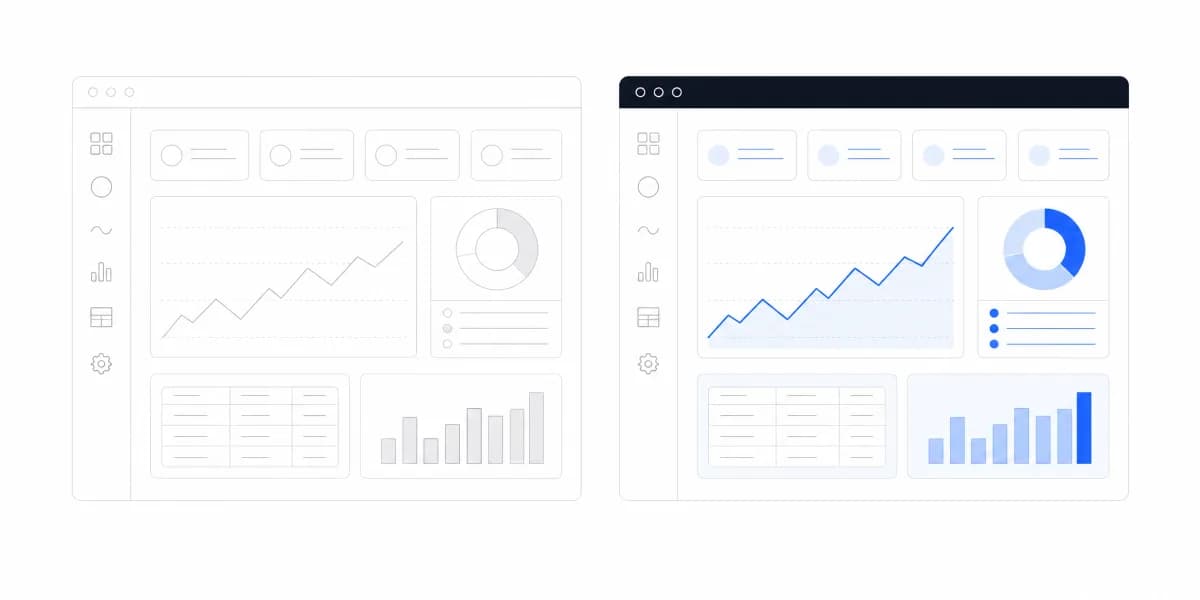
Branded analytics means the dashboard carries your identity, not the vendor's. White-label comes in three depths, the word alone tells you nothing, and iframe versus SDK decides where the control layer sits.
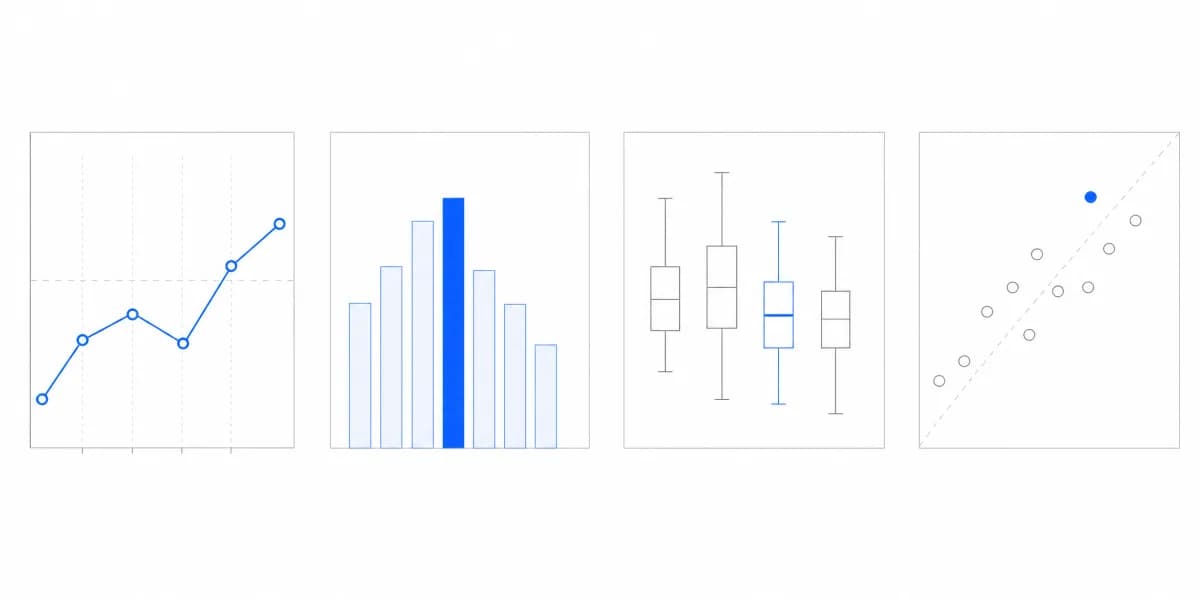
Recharts is a composable charting library built for React. When to use it, how it compares with Chart.js and D3.js, and whether it belongs in an embedded analytics dashboard.
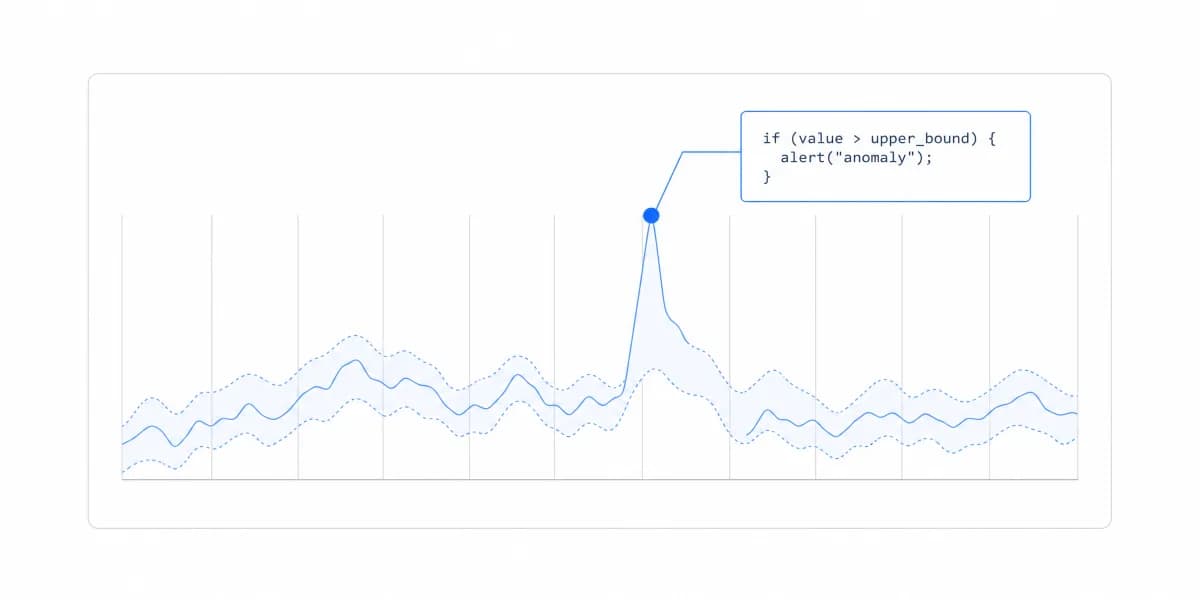
Customer expectations for analytics are changing faster than most platforms can keep up. Here's what we're seeing.
Why engineering teams are choosing headless architectures for embedded analytics, and when traditional approaches still make sense.
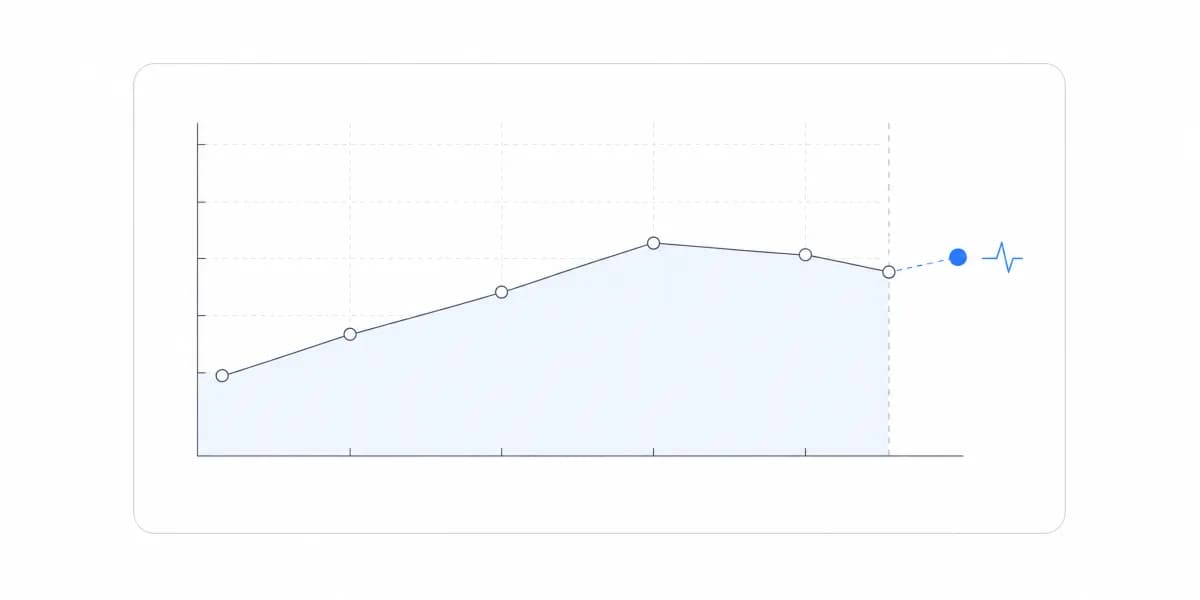
AI assistance, natural-language queries, explicit freshness, governed self-service, and complete tenant scope are changing embedded analytics product requirements.
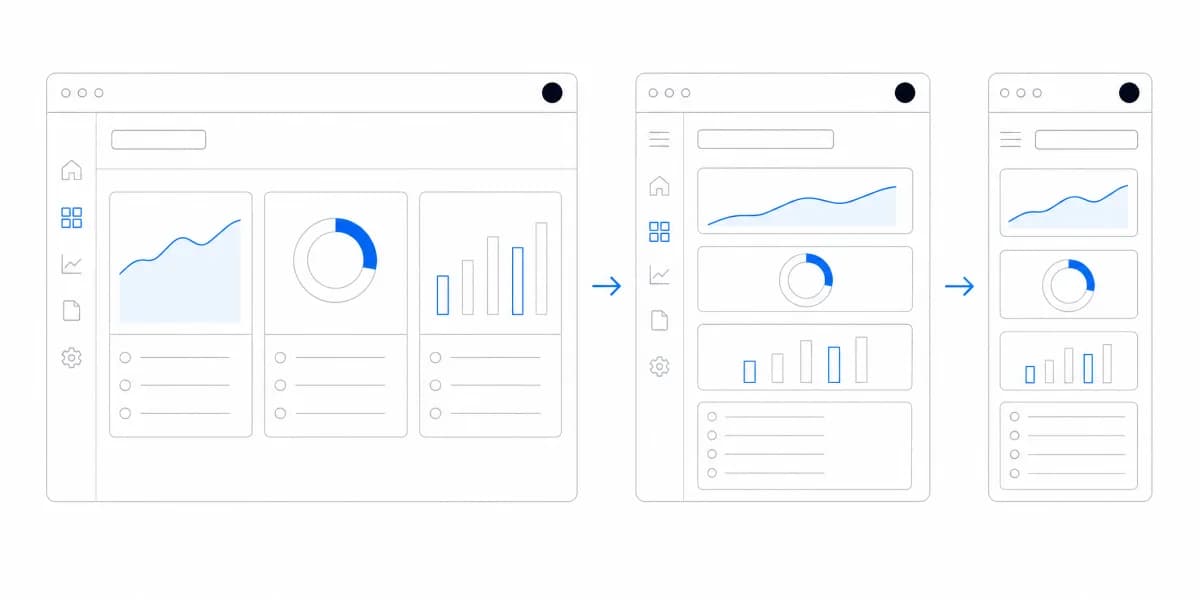
Your customers check analytics on phones during meetings. Here's how to make that experience not terrible.
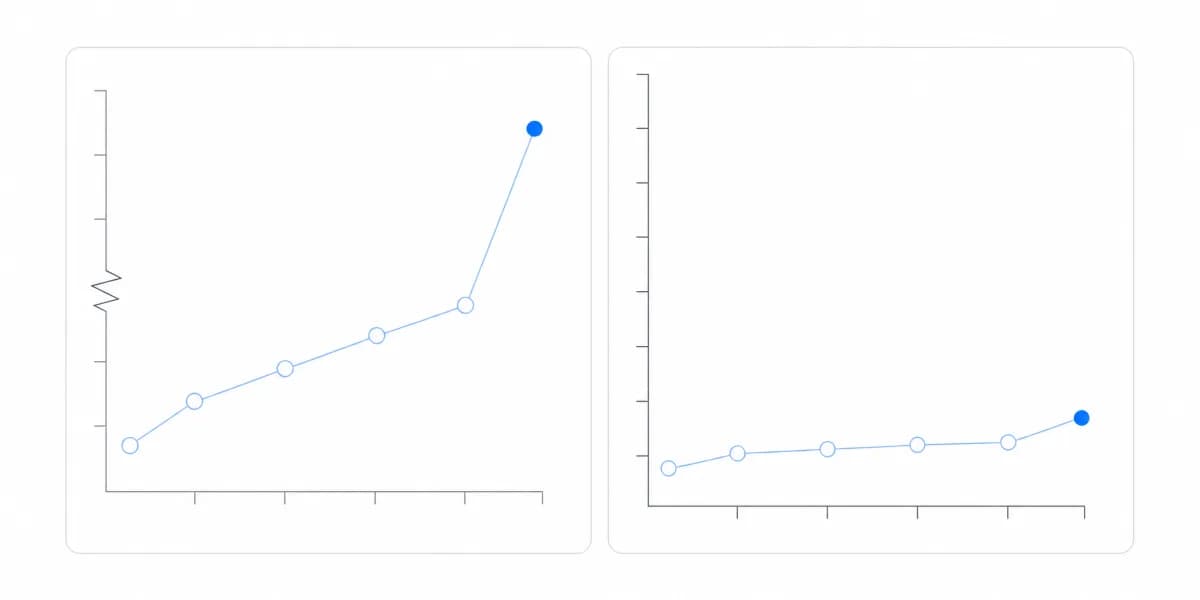
Seven charts that lost their readers, each with the defect named: a truncated axis that turns two percent into a cliff, a rainbow palette assigning meaning the data never had, a third dimension carrying no data at all.
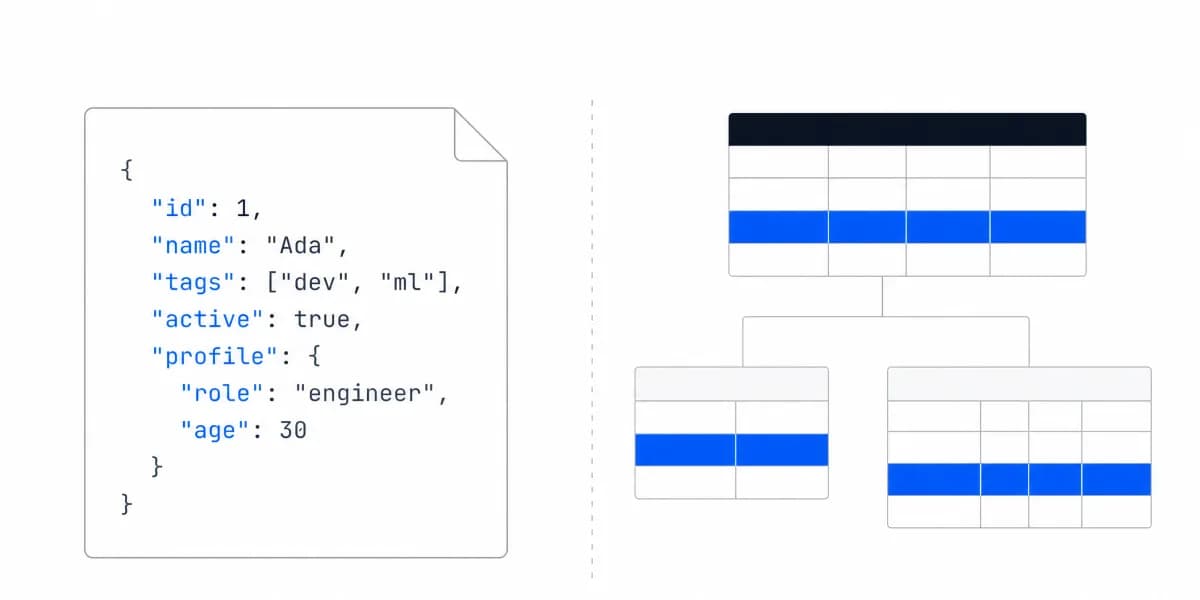
Traditional BI tools force you to build through their UI. API-first analytics flips this, giving developers programmatic control over embedded experiences.
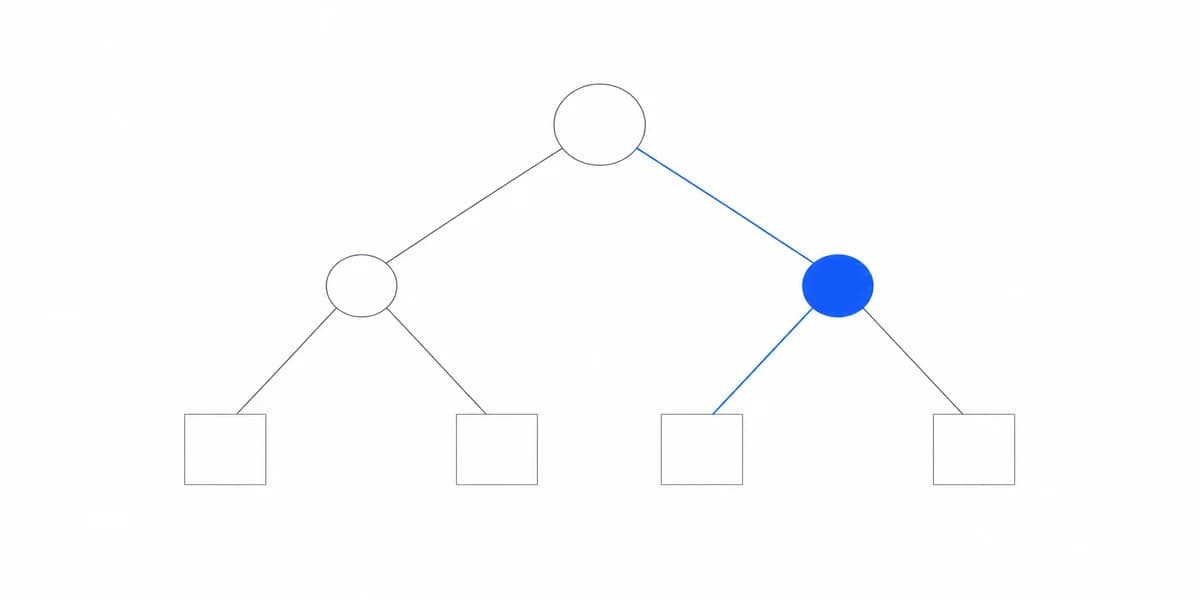
Customers want ChatGPT-like interactions with their data. Here's what that means for embedded analytics.

Design strategic dashboards around explicit objectives, review cadence, valid references, decision rights, and a hierarchy that survives every layout.
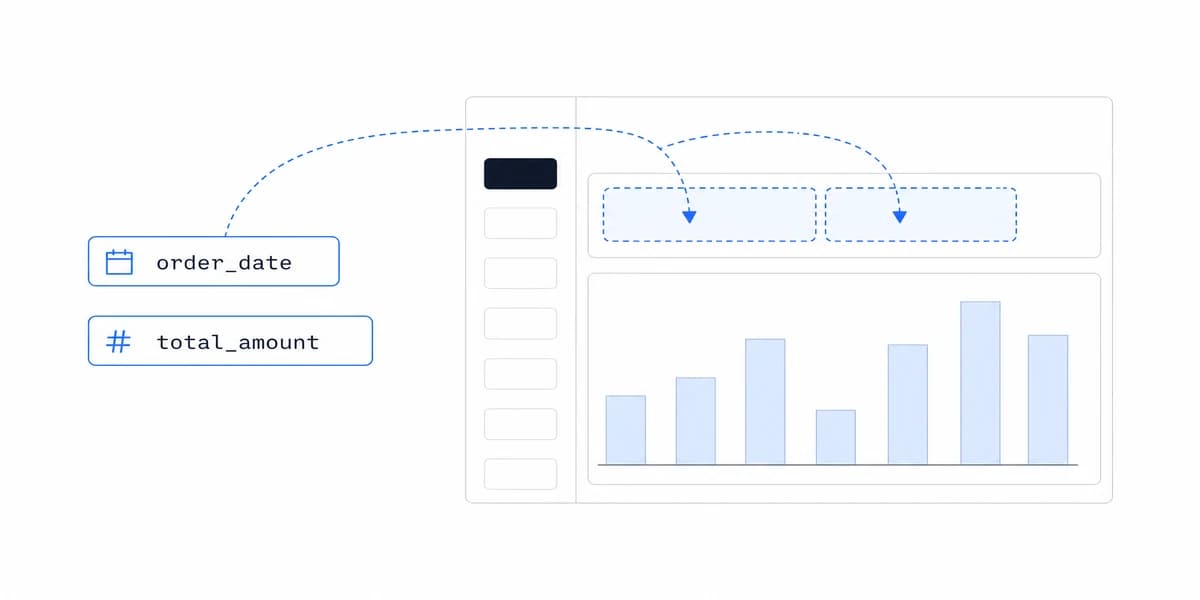
Use sales, marketing, customer, finance, and product KPI examples as operating contracts with definitions, references, owners, and actions.
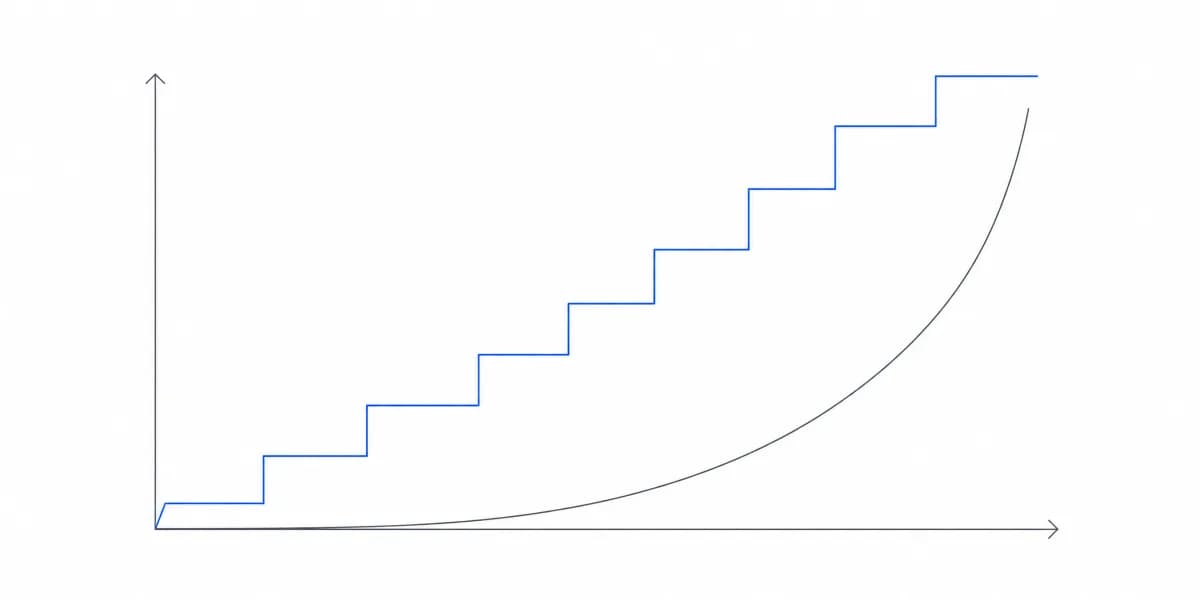
From support ticket reductions to turning analytics into revenue streams. Here's what the real ROI looks like.
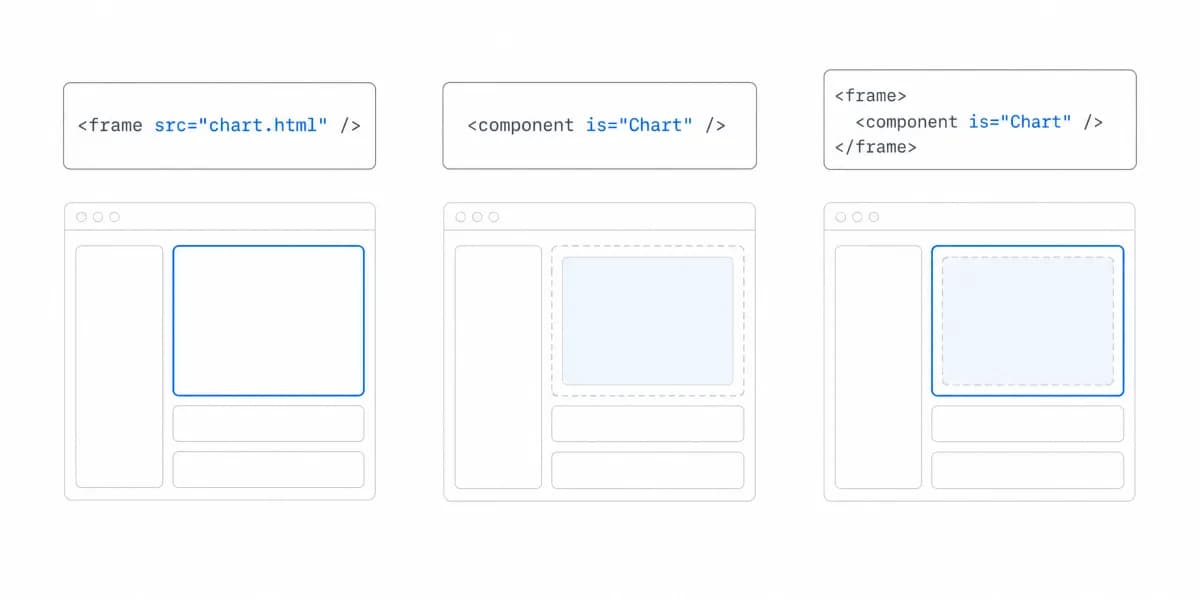
Most teams pick between iframe and SDK based on speed. The real question is: how much control does your product roadmap actually need?
Tableau combines visual analysis, governed publishing, managed or self-managed delivery, and product embedding. Evaluate the data, identity, licensing, and operating contracts separately.
Sisense combines data modelling, dashboards, AI features, and four embedding routes. Here is how to evaluate its architecture and product fit without relying on vendor categories.
Metabase combines an open-source BI application with paid cloud, security, and embedding options. Here is how its query, deployment, and product-embedding choices differ.
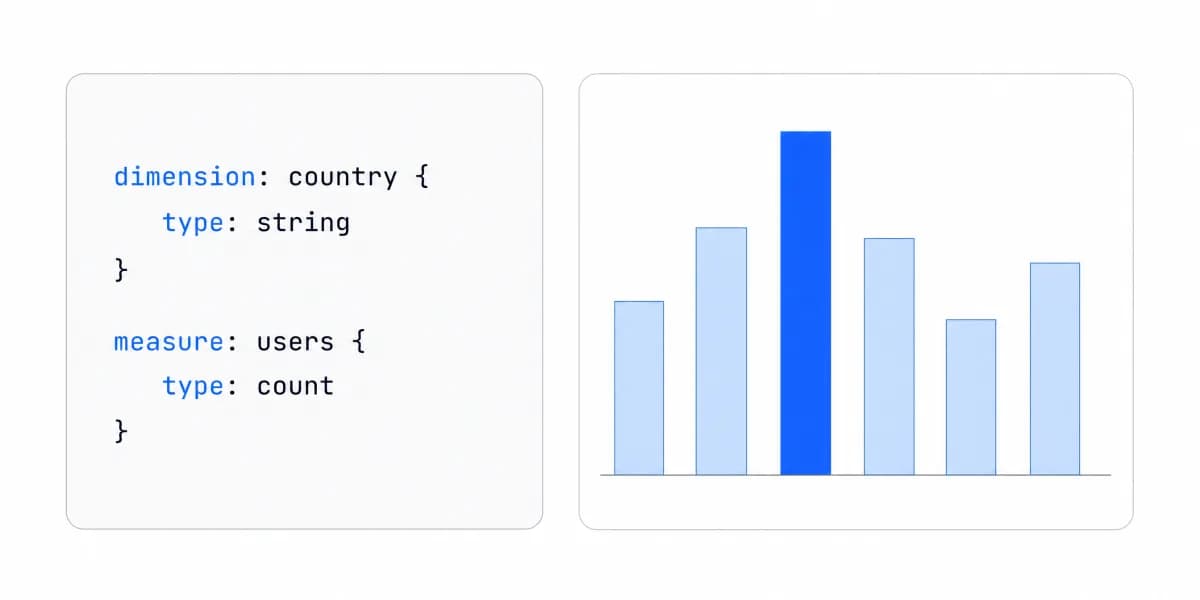
Looker is Google's governed BI platform. Understand LookML, query execution, cache and PDT behavior, content, embedding routes, editions, and fit.
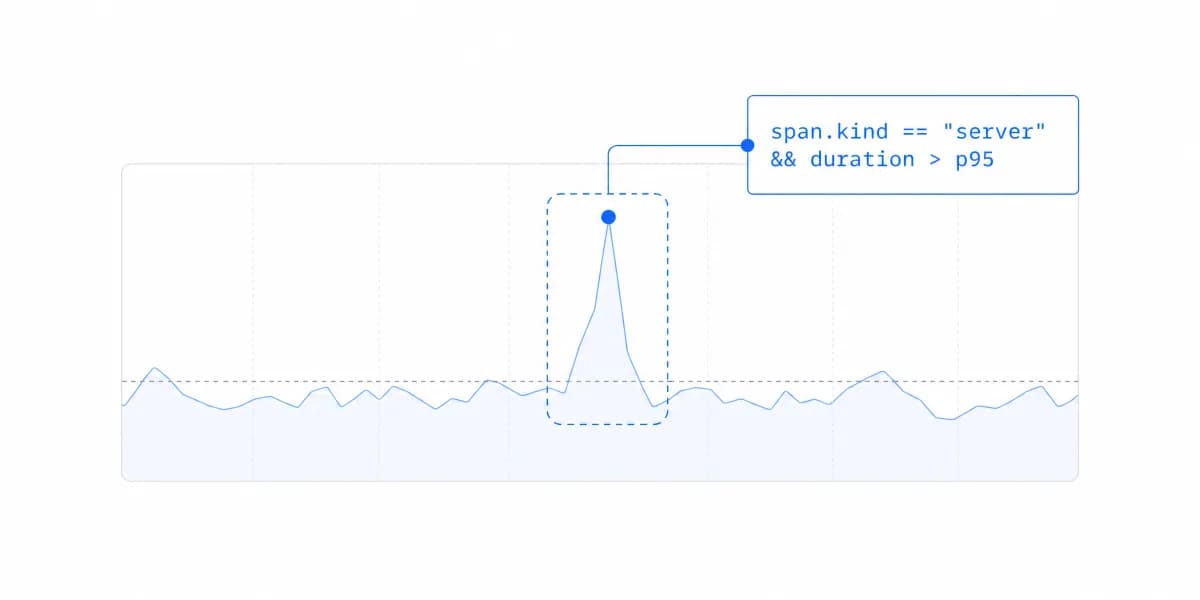
Grafana queries, transforms, visualizes, shares and alerts on data from telemetry, SQL, APIs and cloud services. Its editions, its delivery paths, and the trade-offs that show once it faces customers.
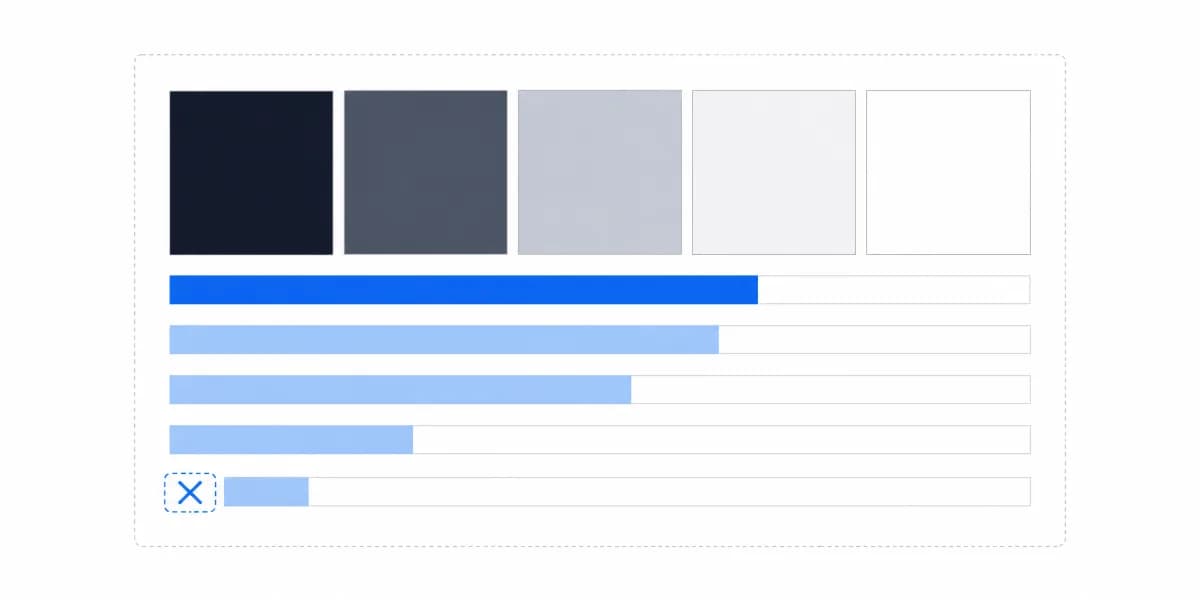
Test charts across equivalent content, semantics, operation, visual resilience, runtime states, and real assistive-technology paths.
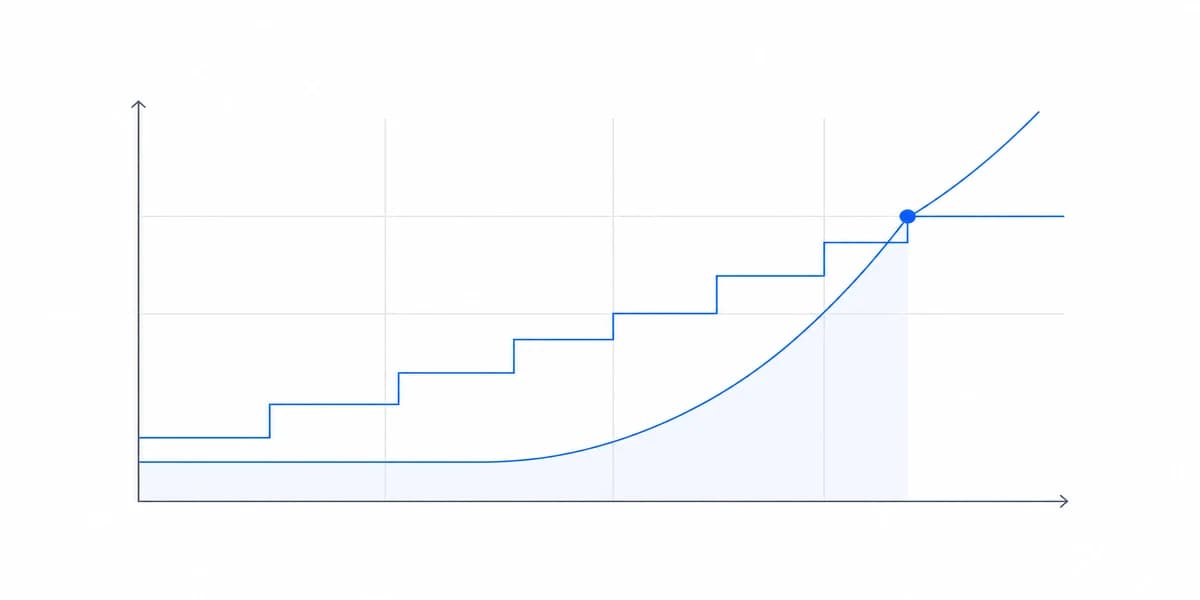
Why that 'free' open source BI tool might end up costing you $50K+/year, and when it actually makes sense.
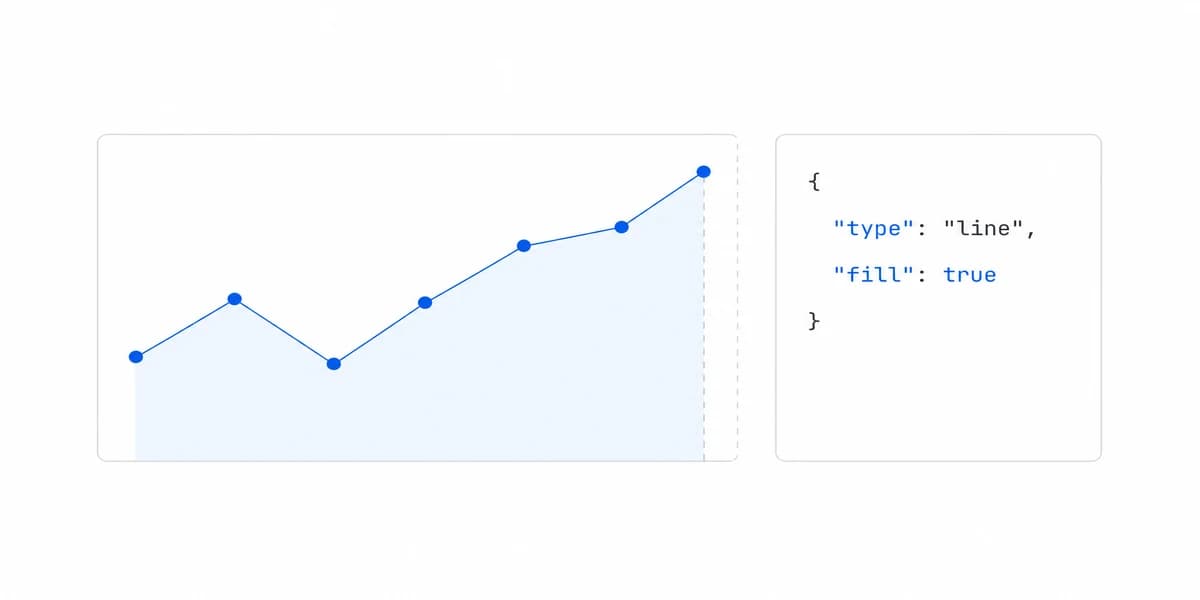
Bar charts compare values across categories; histograms summarize a quantitative distribution. Data type, bins, order and area decide which one the question needs.
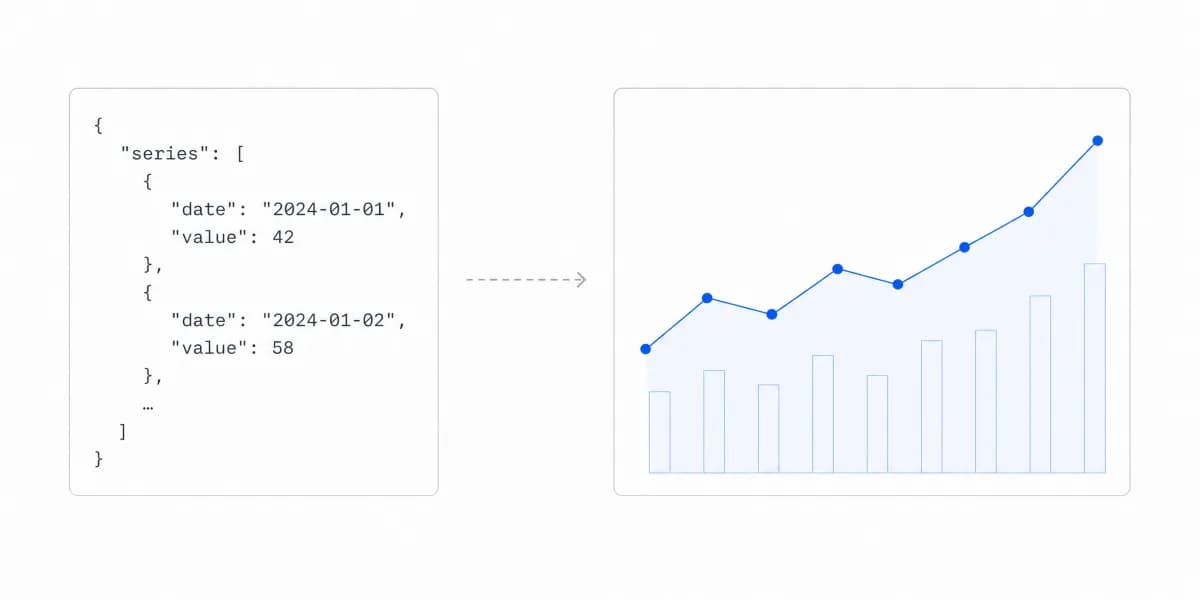
We've seen hundreds of dashboards get built and never used. Here's what separates the ones customers love from the ones they ignore.
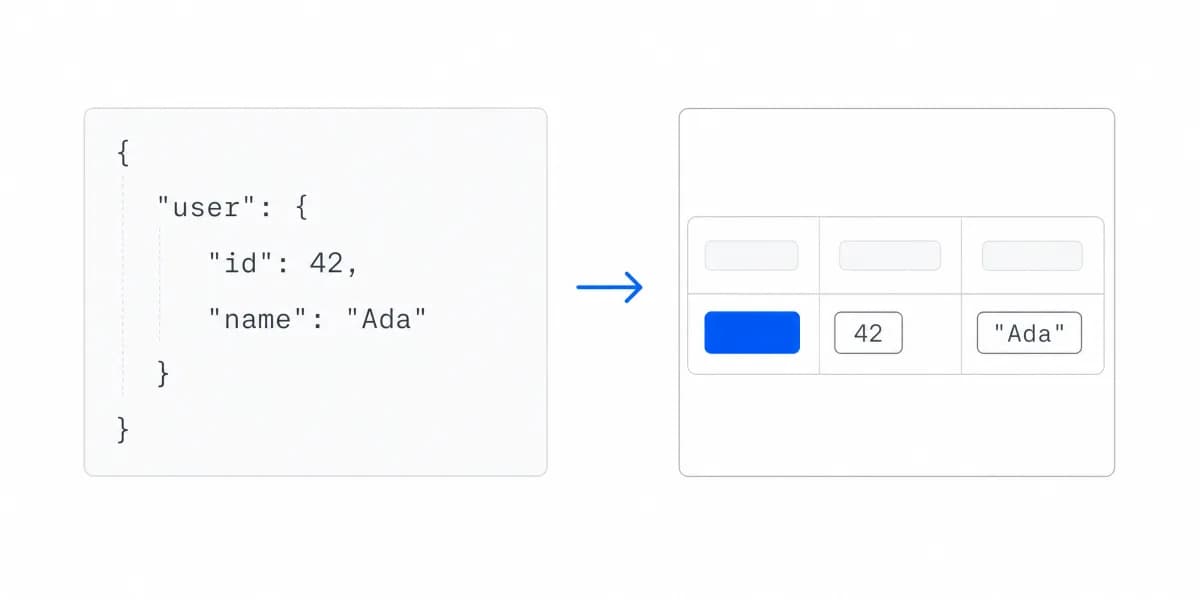
Your customers don't want more data, they want answers. Here's how to turn dashboards into stories that drive decisions.
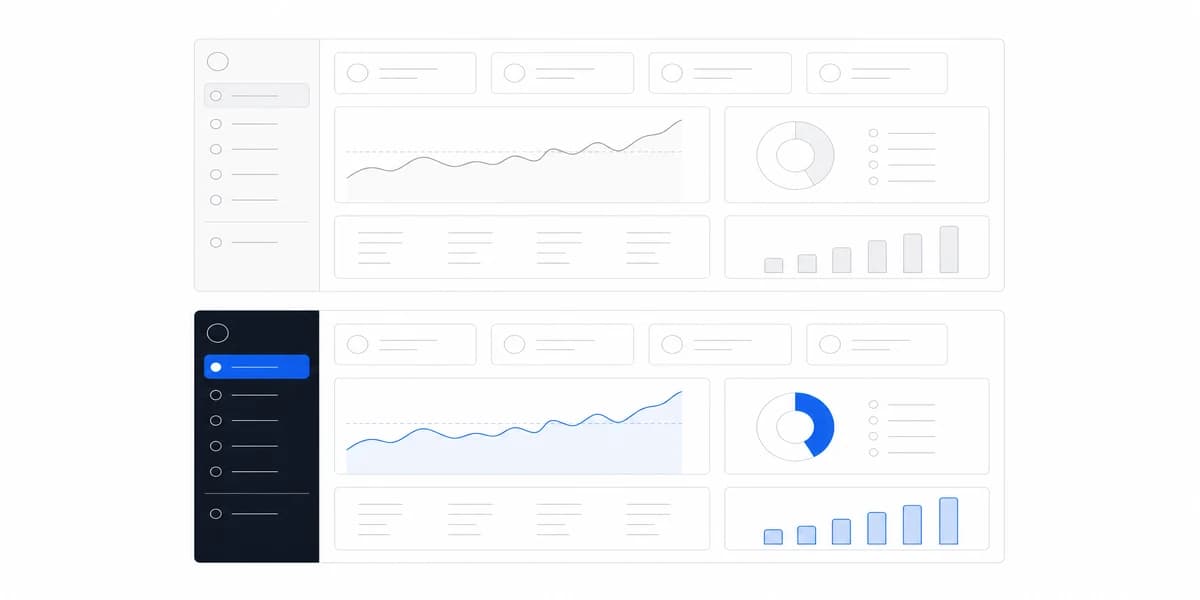
Build dashboard color roles for grouping, order, status, interaction, contrast, and non-color fallback, then validate them in every shipped state.
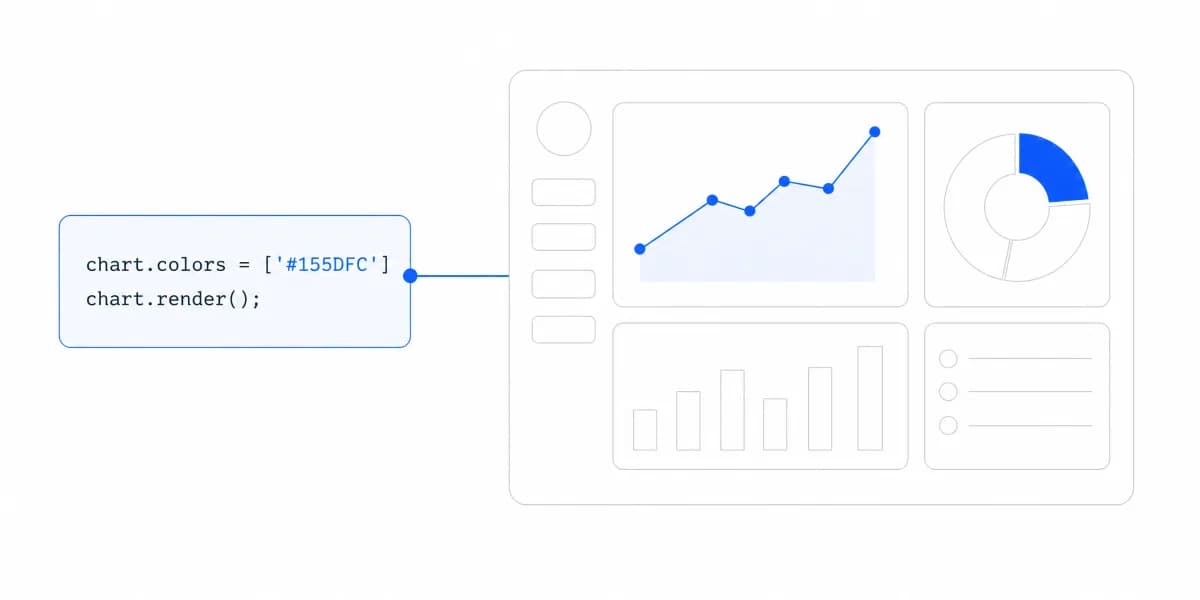
The question is not which charts to support but which questions customers need answered. The chart types a customer-facing dashboard actually needs, and the interactions that make them worth embedding.
Price white-label analytics from observable costs, customer scope, support ownership, and a billable meter both parties can verify.
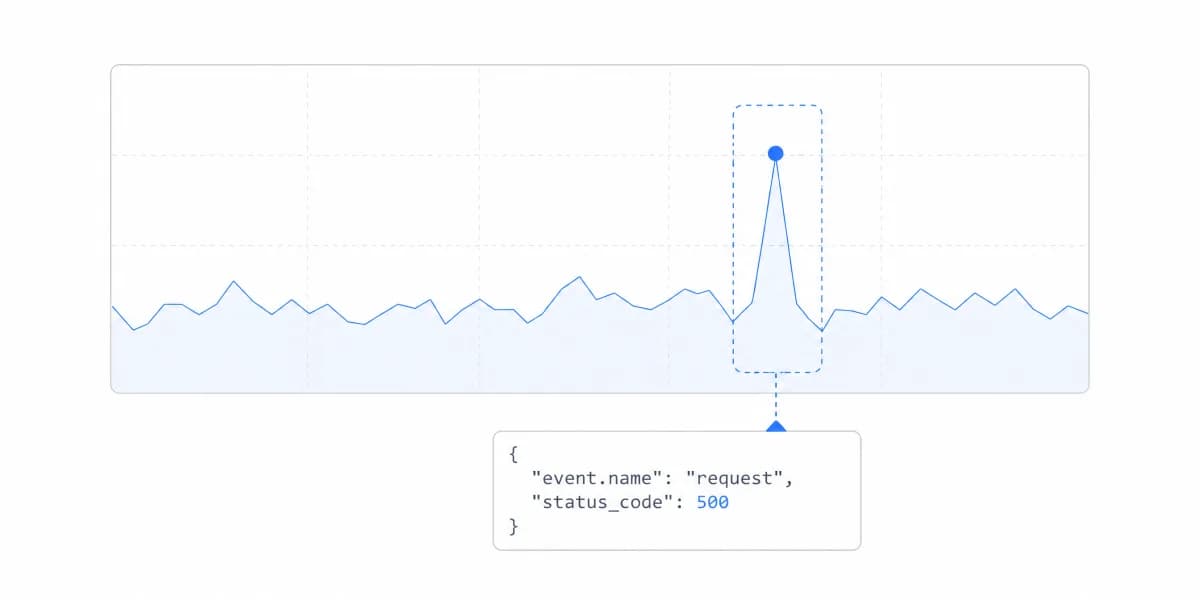
Evaluate AI visualization through interpreted questions, governed semantics, authorization, query evidence, uncertainty, and safe follow-up context.
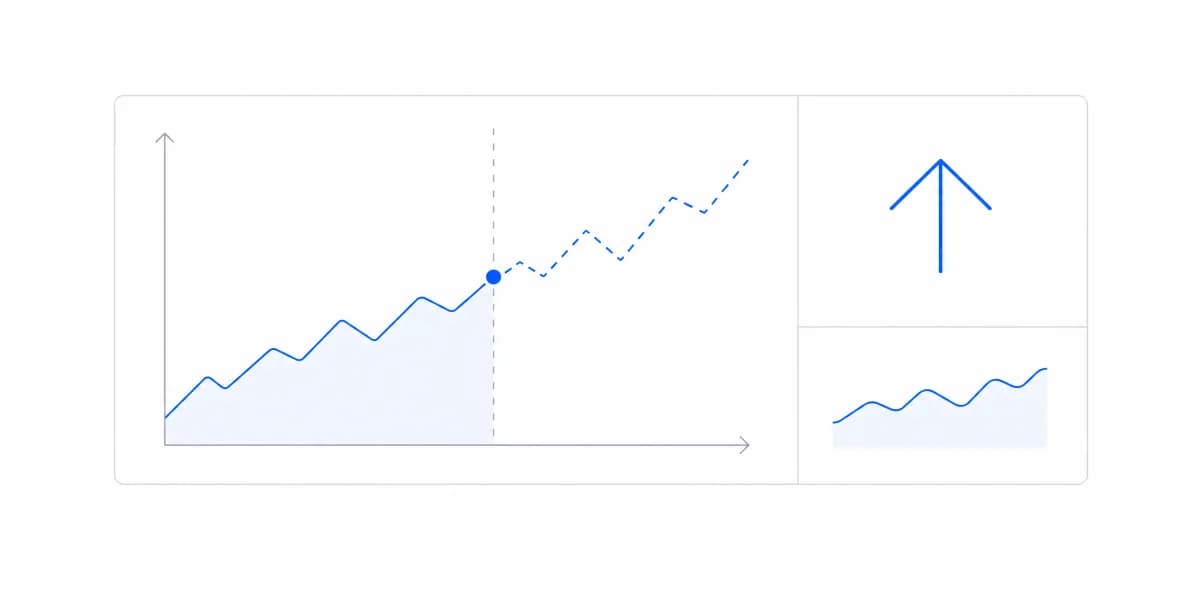
Traditional analytics tells you what happened. Predictive analytics tells you what might happen next. But which approach belongs in your customer-facing dashboards?
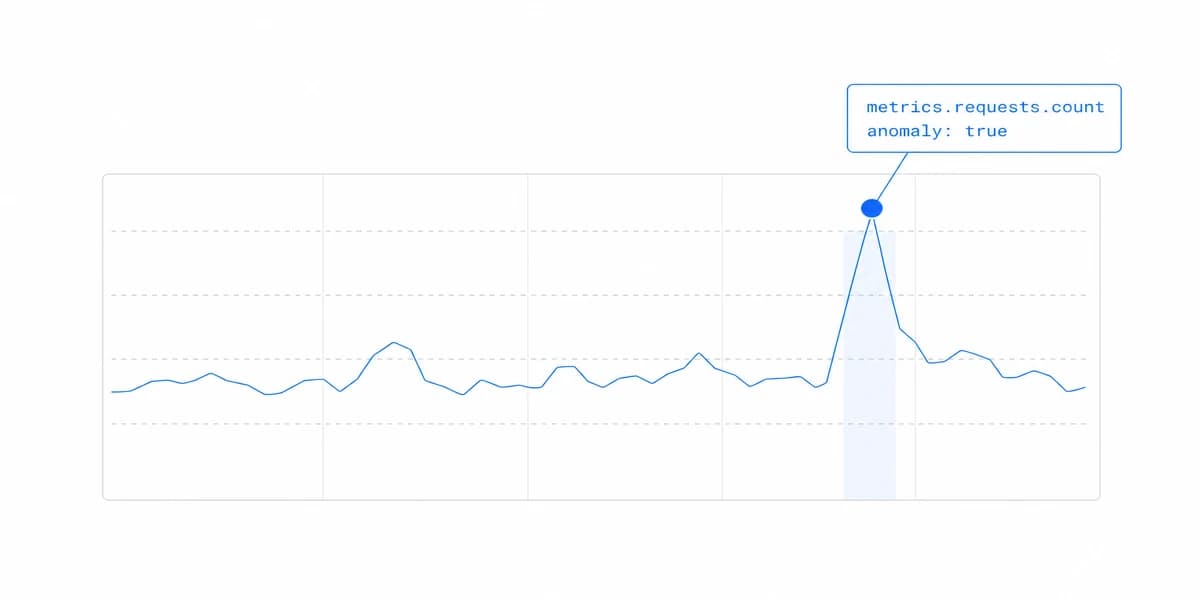
A practical contract for customer-facing analytics: useful tasks, native integration, authorization, and evidence.
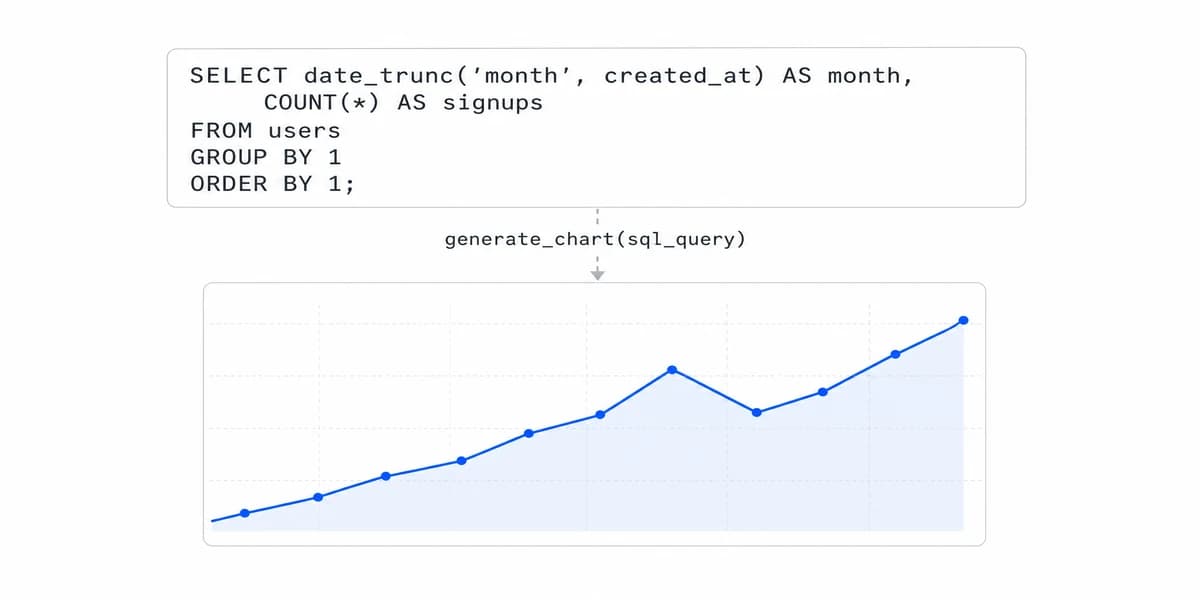
A production NLQ system must clarify intent, enforce semantic and tenant scope, bound execution, and return evidence with every answer.
Design executive dashboards around strategic decisions, metric definitions, references, ownership, actions, responsive tasks, and evidence, not arbitrary KPI counts.
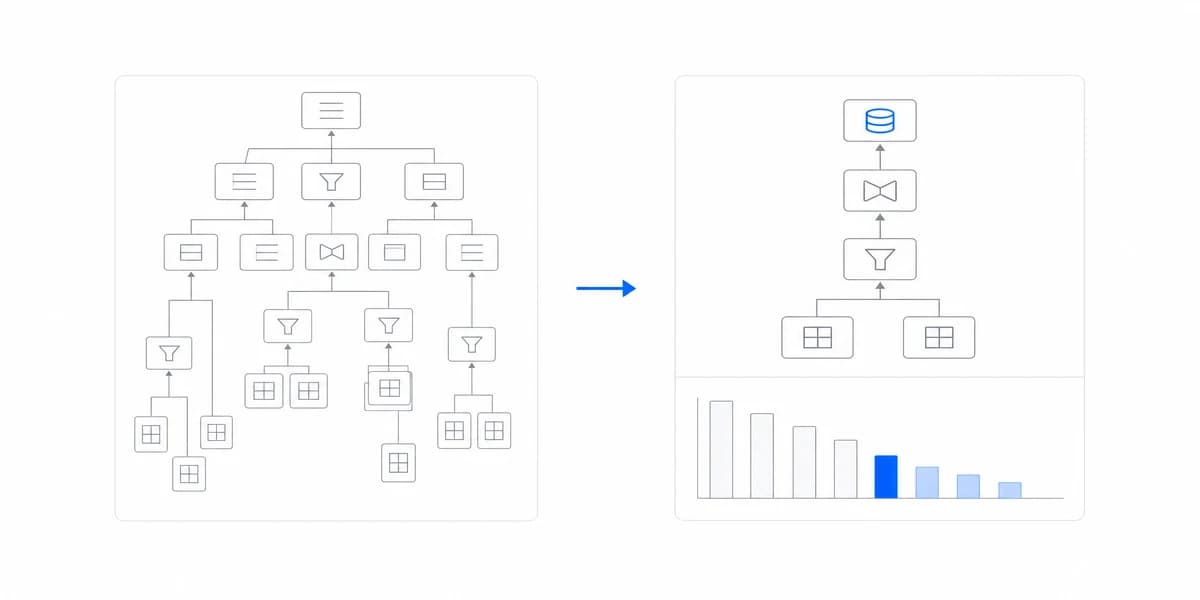
Design customer dashboards around decisions, hierarchy, progressive disclosure, consistent semantics, accessibility, and tested user tasks.
Build customer-facing analytics across task, semantics, identity, runtime states, artifacts, operations, commercial terms, and rollback.
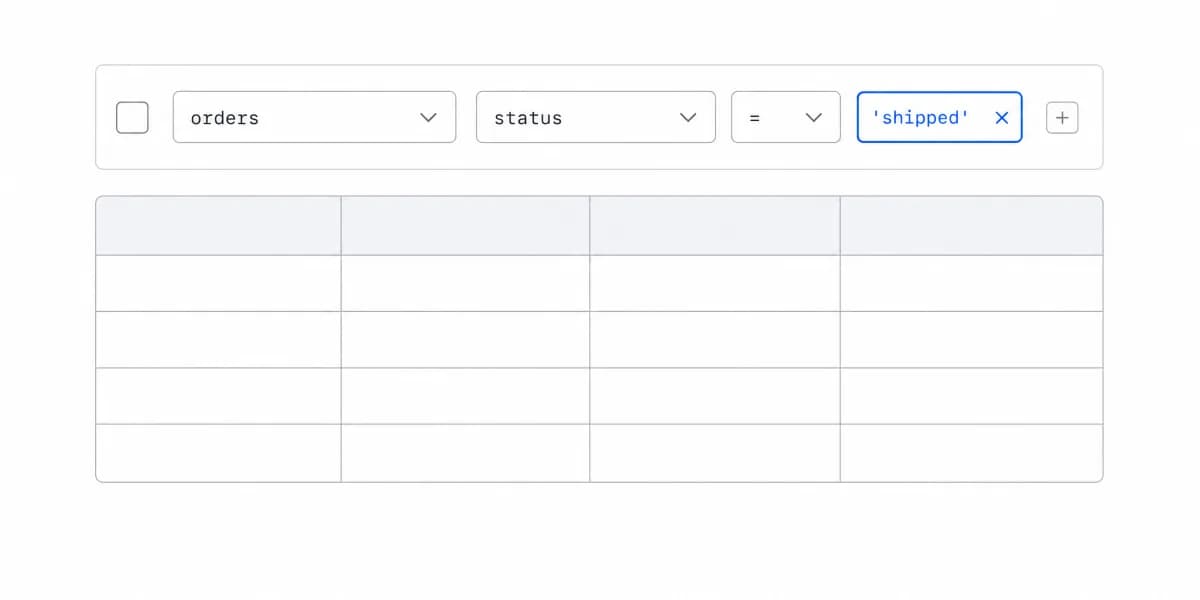
Implement self-service BI with explicit discovery, security, pilot, scale, and operating gates instead of a universal week-by-week promise.
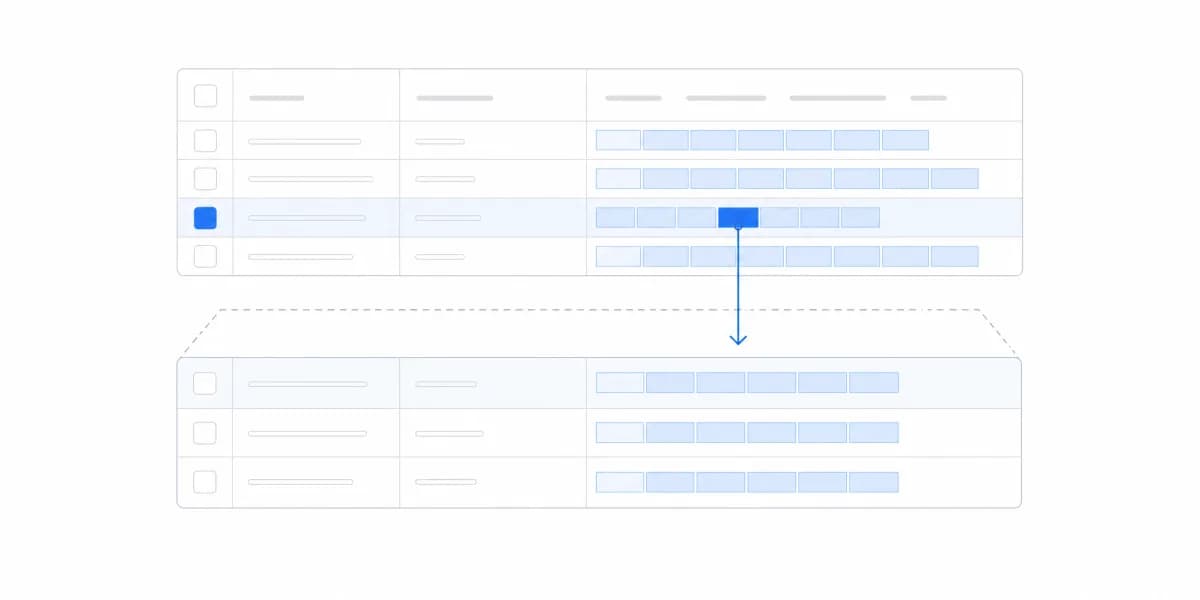
Choose tables, exports, and interactive analytics from the customer task, then validate demand through observable workarounds and product evidence.
Why we built Sumboard, the product boundary we chose, and the production contract behind customer-facing analytics.
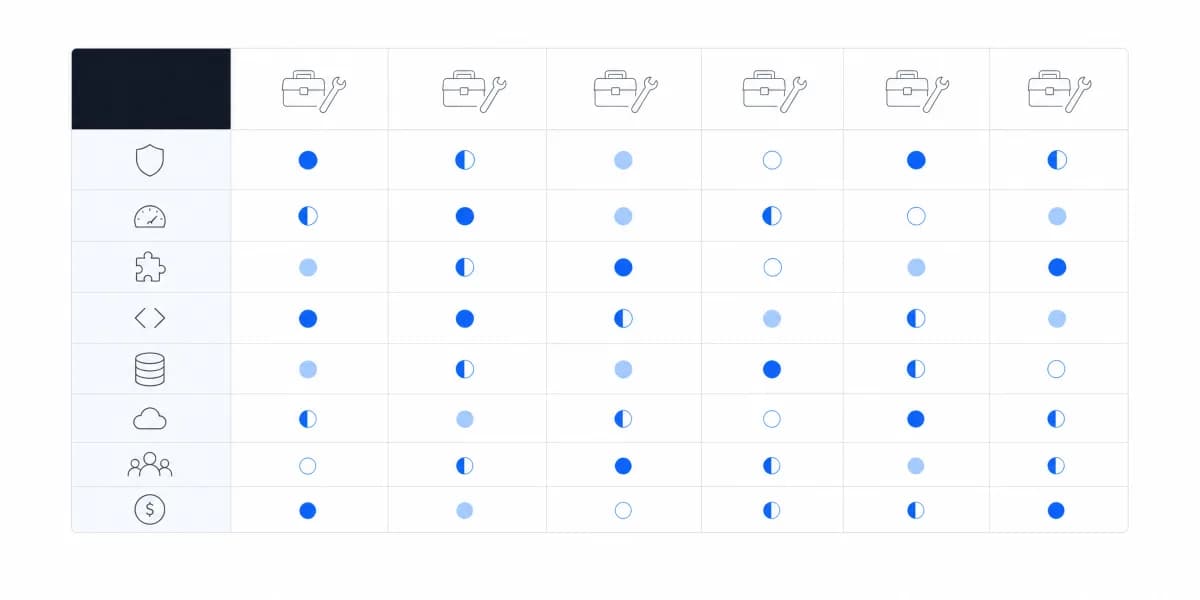
Most BI tool comparisons focus on features. Here's what actually matters when choosing between solutions.