
Retail and Ecommerce analytics inside your product.
Store, brand and seller performance, per tenant.
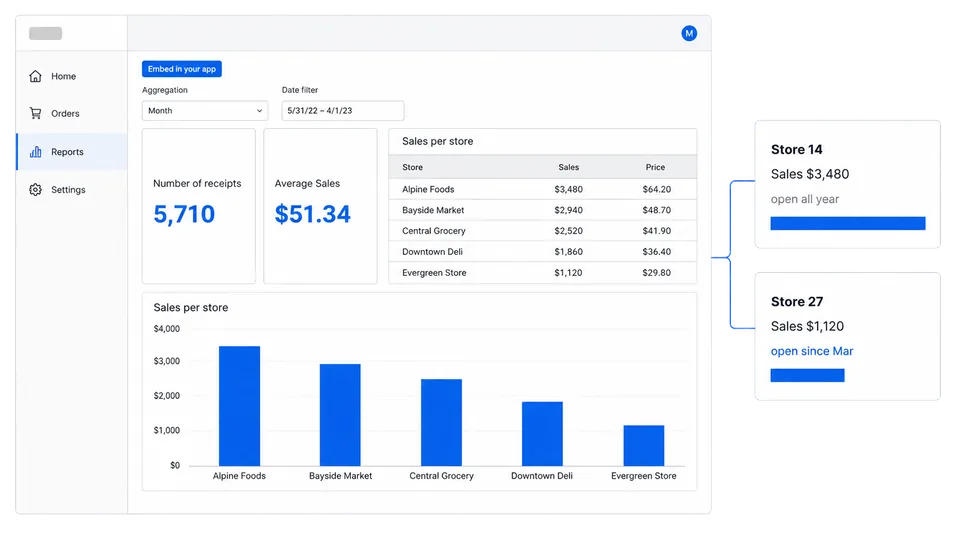
Experience Sumboard
Builder view and customer view.
Switch between the workspace where your team builds and the branded dashboard your customer sees.
- 01Create data insights
- 02Customize with your brand
- 03Embed in your app
What goes wrong in Retail and Ecommerce dashboards.
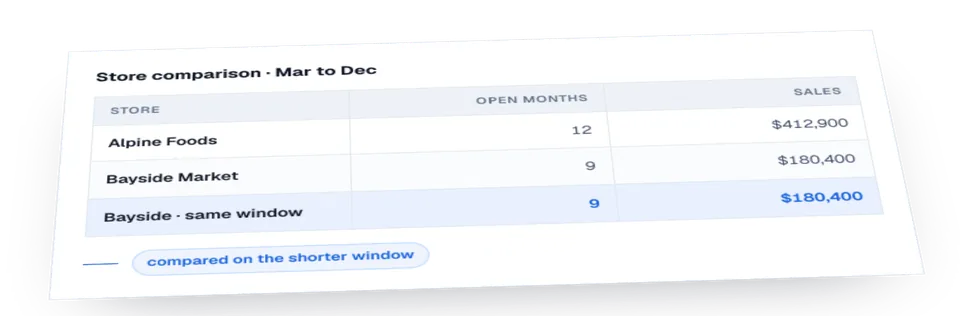
Comparing stores is only fair once the scope is comparable: a store that opened in March cannot be read against one open all year.
A store with nine trading months and one with twelve produce different totals for reasons unrelated to performance, so the comparable period is part of the query.
Permission resolution at query time.
A store manager sees their own location, a regional manager sees their region, and a brand on a marketplace sees only its own listings. Location hierarchies are shallow but wide: many tenants each need a different slice of one large table.
One metric definition, shared across teams.
Sales per store
Net sales by location for a stated window. A store that opened inside the window is shown with its own trading period.
Basket size
Average items per transaction. Reported alongside average basket value, since the two move apart during promotions.
Like-for-like growth
Growth across locations open in both periods. Including new stores would report expansion as performance.
Stock cover
Days of demand covered by on-hand units at current run rate. It changes with every delivery, so it carries an as-of stamp.
Three failure modes in production.
New locations compared against full-year ones
A store that opened in March shows a short bar next to stores open all year, and the chart does not say why.
One cache for every tenant
Retail tables are large and cached aggressively. If the cache key does not include the tenant, one operator sees another's totals.
Time zones applied to the wrong boundary
A trading day ends when the store closes, not at UTC midnight. Aggregating on the wrong boundary moves revenue between days.
How fresh the numbers need to be.
Same-day data matters in retail because a manager acts on today's trading before the day ends. Cache TTL and cache key are therefore configuration decisions.
Further reading for Retail and Ecommerce engineering teams.
Retail Dashboards: A Tile Earns Its Place by Driving Action
Retail KPIs fall into four groups, and a tile earns its place only by driving an action. Sales, inventory and customer analytics, for retailers and for the SaaS products serving them.
Store Performance Metrics: From Comparable Scope to Action
Define comparable store metrics, reconcile their data, isolate operational drivers, and connect every signal to an owner and review decision.
Retail Analytics Dashboards: From Events to Store Decisions
Design retail dashboards around reconciled sales, accepted inventory movements, store-local time, customer scope, and the decision window.
Frequently asked questions.
Can we compare stores fairly when some are new?
Yes. The comparable window is part of the query; a like-for-like view and an all-stores view are two filter states of one dashboard.
How many locations can one dashboard handle?
The limit is your data source, not the dashboard. The query is filtered by tenant before rows are returned.
What does the cache key on?
Tenant scope is part of the cache key.
Can each brand on our marketplace see only its own listings?
Yes. Marketplace sellers are scoped through the same token filter as store managers.