A retail dashboard is trustworthy only when a sale, return, inventory movement, customer, product, location, currency, and business day retain the same meaning from source to action.
The chart is the final surface. The difficult work is deciding which record is authoritative, when it is accepted, which customer and role may see it, how channels reconcile, and how fresh the answer must be for the decision.
Begin With the Retail Decision
Different dashboard types support different clocks and owners. Start with one task:
- Who is acting: store manager, regional lead, buyer, inventory planner, merchandiser, marketer, or support operator?
- Which store, channel, assortment, supplier, and customer scope applies?
- What can the user still change?
- Which evidence and comparison make that action defensible?
- Which operational system owns the action?
- What state confirms success or requires escalation?
An intraday sales-pacing view, an end-of-day store comparison, a stockout exception queue, and a quarterly cohort review are not one dashboard at different speeds. They have different source, metric, freshness, and ownership contracts.
Make Freshness a Decision Contract
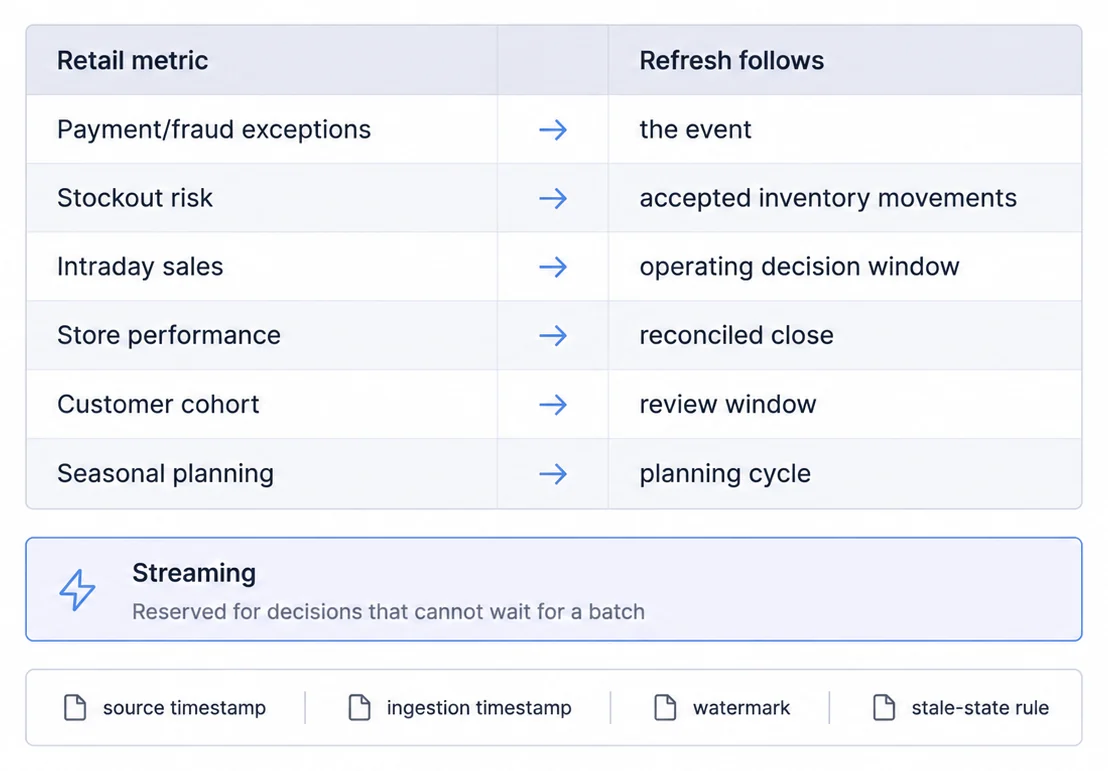
Expose the times and states that affect interpretation:
- source event time and store-local business date;
- time received by the platform;
- latest accepted transaction or inventory movement;
- model and reconciliation completion;
- dashboard or artifact generation time;
- watermark, known delay, and expected next update;
- stale, partial, revised, closed, and unavailable behavior.
Streaming is appropriate when an owner can act before a batch completes and the source event is sufficiently authoritative. Scheduled or reconciled updates are better when returns, cancellations, transfers, late transactions, currency conversion, or source corrections can materially change the answer.
A fast dashboard over incomplete stock movements can create more harm than a clearly marked delayed result.
Define Sales and Margin Before Comparing Stores
“Revenue” may mean ordered, captured, fulfilled, recognized, or net sales. Write the contract for discounts, tax, tips, shipping, gift cards, loyalty credits, refunds, exchanges, cancellations, chargebacks, and inter-store transfers.
Store comparisons also need:
- local timezone, business-day boundary, and daylight-saving treatment;
- comparable-store eligibility and closure rules;
- location openings, relocations, renovations, and channel reassignment;
- currency source, conversion time, and rounding;
- targets and budgets with versions and effective dates;
- missing, late, duplicated, and corrected transactions.
Preserve transaction, order, line, SKU, store, and source identifiers through drill-through and support evidence. The store performance tracking task should compare like-for-like populations rather than ranking every location on raw totals.
Use KPI dashboard examples as patterns, not as universal definitions.
Treat Inventory as a Movement Ledger
Inventory is not just the latest quantity returned by an API. Model receipts, sales, returns, transfers, adjustments, reservations, damaged goods, cycle counts, purchase orders, and in-transit states with stable product and location identities.
For each movement, retain source ID, event time, received time, quantity and unit, from/to location, reason, acceptance state, and correction link. Define whether available-to-promise includes reservations, safety stock, inbound orders, marketplace allocation, or quarantine.
Stockout risk and reorder recommendations require explicit demand window, lead time, service level, supplier calendar, minimum order, pack size, and confidence behavior. A prediction is not an inventory fact. Show its model version and fallback when evidence is missing or stale.
Reconcile Channels Instead of Forcing a Single Number
Point-of-sale, e-commerce, marketplace, inventory, CRM, loyalty, and finance systems answer different questions. Their product, customer, location, order, and time identities may not align naturally.
Create a release reconciliation that records:
- source totals and extraction windows;
- mapped and unmapped stores, SKUs, orders, customers, and currencies;
- duplicate, cancelled, returned, and corrected records;
- accepted variance and close state;
- source and metric owners;
- investigation and recovery procedure.
Do not silently merge store and digital activity into an “omnichannel customer” without an identity and consent policy. Unknown and unmatched states are evidence, not records to discard.
The broader retail dashboard guide should use the same reconciliation contract across its sales, inventory, customer, product, and omnichannel views.
Preserve Scope Across Live and Generated Surfaces
For a retail SaaS product, host authentication must map to permitted tenant, organization, brand, region, store, channel, supplier, fields, metrics, and product actions in trusted services.
Test isolation across:
- altered filters and direct content identifiers;
- store, product, transaction, and customer drill-through;
- cached queries and precomputed rollups;
- CSV, spreadsheet, image, and PDF exports;
- scheduled email recipients and attachments;
- saved views, shared links, bookmarks, and APIs;
- empty, error, partial, and stale states;
- logs, alert payloads, and support tooling.
Customer and loyalty analytics may add consent, retention, deletion, suppression, and minimum-cohort requirements. Avoid returning forbidden metadata through counts, filter options, error messages, or cache timing.
Test a Production-Shaped Retail Slice
Choose one representative customer, role, store group, product set, and decision. Then test:
- A known set of sales, returns, transfers, stock adjustments, and source corrections.
- Store-local time boundaries, currency, business dates, and close behavior.
- Expected and denied tenant, store, field, and artifact access.
- The intended comparison, exception, drill-through, export, or operational handoff.
- Duplicate events, late returns, missing mappings, source outage, quota limits, stale cache, retry, and recovery.
- Realistic row counts, concurrency, expensive allowed filters, mobile layout, extreme labels, keyboard use, and non-visual equivalents.
- Observability with source and query identifiers, owner, runbook, rollback, and customer-safe status.
Measure accepted task completion, interpretation errors, unresolved reconciliation variance, time to action, denied-access results, query reliability, artifact failures, and support handoff. “Dashboard loaded” is not proof that a retail decision improved.
Package Capabilities Without Inventing Commercial Impact
Product tiers can distinguish scope, saved content, exports, schedules, alerts, prediction, support, or service levels. Each entitlement needs a clear contract and enforcement across UI, API, cache, share, and artifact surfaces.
Evaluate commercial impact against a baseline: eligible accounts, activation, repeated correct task completion, expansion, retained usage, support effort, infrastructure cost, and incident burden. Do not promise shorter sales cycles, increased conversion, reduced churn, or immediate ROI without product-specific evidence.
Retail Analytics Is a Governed Path From Operational Events to a Decision
Trust depends on transaction and inventory semantics, store-local time, channel reconciliation, customer scope, freshness, artifact security, and ownership, not on a real-time label or a larger chart catalog.
Start with one retail task and one production-shaped data slice. Expand only after meaning, denial, workload, artifacts, failure recovery, and operating evidence pass together.
Ready to launch customer-facing analytics?
Stop losing customers to competitors with better analytics. Sumboard's customer-facing analytics platform lets you launch self-service dashboards in days, not months.