A store performance dashboard should not begin with a league table. It should begin with a decision: which location needs investigation, what changed, which driver is plausible, who can act, and when the result will be reviewed.
Raw sales, traffic, inventory, labor, and customer data are not automatically comparable. Store format, trading hours, category mix, fulfillment channels, returns, currencies, and data-close timing can create a variance before operating performance changes. The dashboard must make those conditions explicit.
Define the Decision and Reader
A store manager may adjust staffing, replenishment, display, or local execution today. A district manager may compare a named peer set and allocate support. A franchise owner may review a reconciled period and approve a plan. A finance team may need the same sales number under a different close and accounting contract.
Write the question, permitted action, owner, decision window, and prohibited use for each view. This determines which metrics, detail, freshness, and comparison belong. Our retail dashboard guide separates operational, inventory, customer, product, and omnichannel tasks that should not be collapsed into one universal screen.
Build a Governed Metric Contract
Net sales needs rules for tax, discounts, returns, cancellations, gift cards, currency, channel, and posting time. Conversion needs a traffic-counting method, eligible visits, buyer definition, window, and treatment of staff or repeat entry. Basket value needs an order definition and a clear gross or net numerator.
Inventory turnover, availability, retention, and sales per employee have the same requirement: define numerator, denominator, grain, window, exclusions, source, owner, and revision behavior. Link the definition from the dashboard so a comparison can be challenged and reproduced. The KPI explains why a number becomes useful only when tied to a target, owner, and decision.
Do not import a sector benchmark until the metric and comparison set are compatible. Store format, category, geography, price point, maturity, and channel can change the meaning of the same ratio.
Make Stores Comparable Before Ranking Them
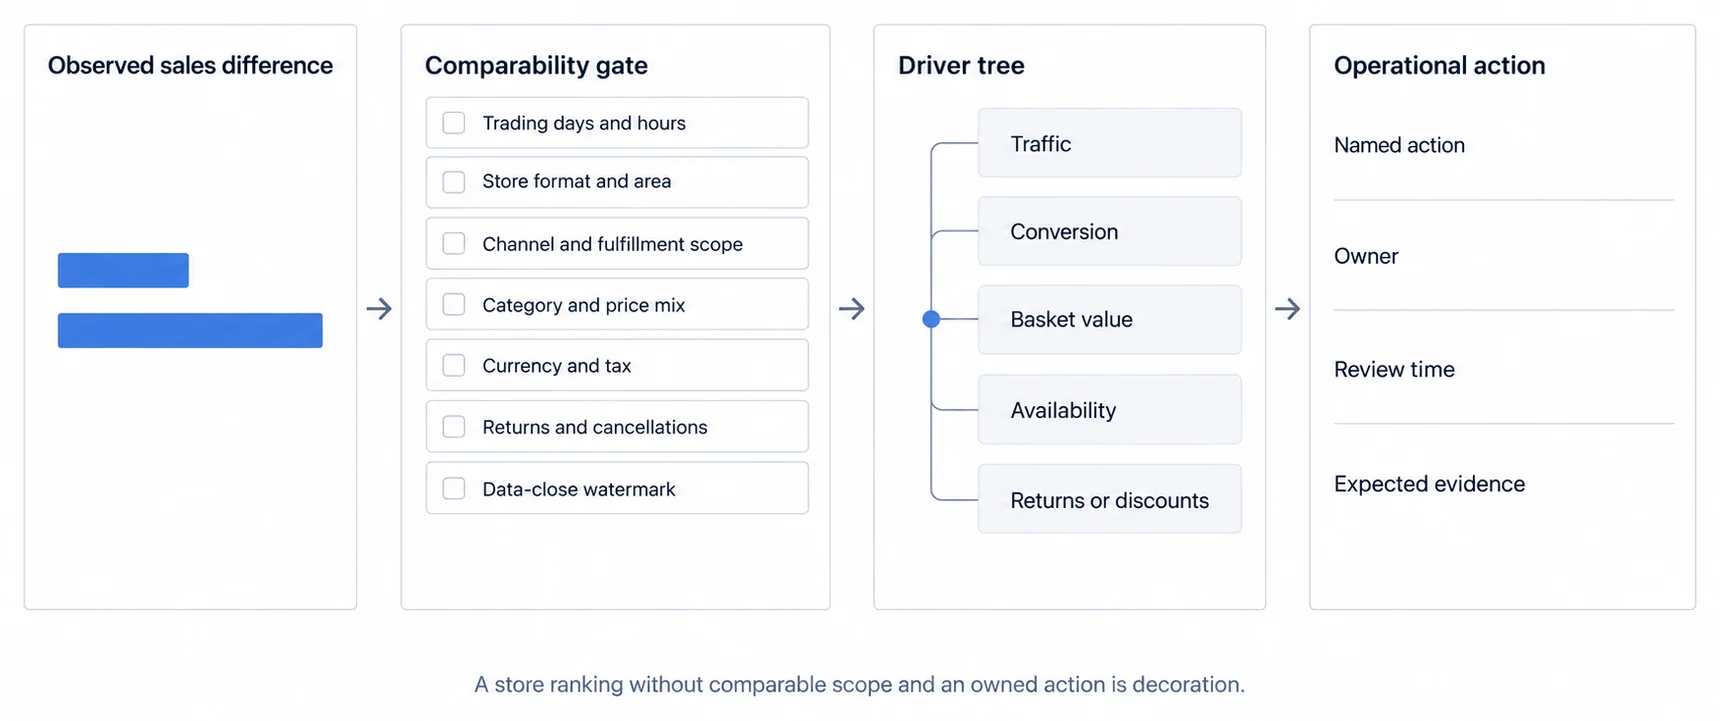
Approve a comparable-store rule. Align trading days and hours, openings, closures, refits, format, selling area, geography, currency, tax, category and price mix, channel and fulfillment scope, promotions, returns, cancellations, and the accepted data close. Mark stores that do not qualify instead of forcing them into the same ranking.
Choose the baseline for the decision: the store’s prior comparable period, plan, a named peer set, or a matched cohort. Show both the absolute value and the variance when each matters. Preserve the baseline definition in exports and saved views so the same label does not produce a different comparison elsewhere.
A dashboard can surface an unusual result; it should not claim a cause. A sales decline may reflect traffic, conversion, basket, availability, returns, discounts, trading time, channel shifts, or incomplete data. The next view should help isolate those drivers.
Reconcile the Data Before Explaining It
Map the sources required by the contract:
- point-of-sale orders, line items, discounts, payments, returns, and cancellations;
- product, category, price, promotion, and store master data;
- inventory receipts, transfers, adjustments, availability, and stock counts;
- store calendars, trading hours, area, format, and location lifecycle;
- traffic or visit measurement with sensor coverage and quality states;
- online order, pickup, delivery, and attribution rules;
- labor schedules and time records where the permitted decision requires them;
- customer or loyalty identifiers, consent, and cohort rules where lawful and necessary.
Customer acquisition, campaign, and loyalty evidence may also depend on the attribution and audience contracts described in the marketing dashboard guide; do not silently merge those definitions into an in-store conversion metric.
Reconcile identifiers, time zones, currencies, tax, late events, duplicates, reversals, and corrections. Record source time, ingestion time, watermark, and accepted close. A visible freshness label should describe the decision-safe state, not merely the last browser refresh.
Connect Metrics Through a Driver Tree
Net sales can be decomposed into transactions and basket value; transactions can be examined through eligible traffic and conversion. Availability can constrain every branch. Returns and discounts can reverse an apparently strong gross-sales result.
Use the decomposition to ask the next question, not to manufacture certainty. If traffic falls while conversion holds, inspect measurement coverage and demand drivers. If traffic holds and conversion changes, inspect availability, price, promotion, service, and journey evidence. If basket changes, inspect units, mix, discounts, and returns.
Every alert needs an owner, response window, expected evidence, and guardrail. Record the action and compare the next reconciled result. Without that loop, colored thresholds produce attention but not learning.
Separate Internal and Customer-Facing Contracts
An internal analyst workspace and a customer-facing store view may use the same governed metrics while carrying different identity, workflow, experience, and support contracts. Complexity is not the defining difference; audience and permitted task are.
For customer-facing delivery, bind the host user to tenant, store, role, row, and field scope in a trusted layer. Test direct URLs, modified identifiers, APIs, drill-through, caches, exports, schedules, shares, account switching, session expiry, and support access. A visible store filter is not an authorization boundary.
Design loading, empty, stale, partial, denied, error, and recovery states. Test keyboard, screen-reader, zoom, reflow, touch, localization, long labels, print, and export. White-label appearance does not replace security, accessibility, or operational ownership. Our dashboard provides the broader product boundary.
Match Freshness to the Decision
Payment or fraud exceptions may justify event-driven delivery when someone can act immediately. Stockout risk may follow accepted inventory movements. Intraday sales may follow an operating window. Store performance may require a reconciled close. Customer cohorts may follow a longer review cycle.
Faster is not automatically better. Define maximum decision-safe age, data watermark, late-data rule, stale state, escalation, and cost for each metric. Refreshing an unreconciled total more often can create more contradictory decisions.
Test the Dashboard With Production-Shaped Evidence
Use representative stores, formats, currencies, channels, categories, long labels, sparse and dense data, corrections, returns, closures, and account roles. Measure load, filters, drills, comparisons, exports, refreshes, and account changes at base, growth, and peak concurrency.
Test the real morning review, exception investigation, district comparison, and follow-up action. Capture task completion, answer correctness, denied-access results, tail latency, accessibility, recovery, support demand, and whether the action changed a later outcome.
Estimate build and buy routes from this specification: data work, semantic definitions, identity, tenant tests, dashboards, artifacts, accessibility, devices, operations, support, upgrades, capacity, and exit. Universal six-month or dollar estimates cannot represent those local inputs.
The dashboard types guide and retail analytics dashboard article can expand the design options. Sumboard should be evaluated under the same metric, comparability, tenant-denial, workload, ownership, and outcome contract before it earns a place in a retail product.
Ready to launch customer-facing analytics?
Stop losing customers to competitors with better analytics. Sumboard's customer-facing analytics platform lets you launch self-service dashboards in days, not months.