Retail operations have moved from isolated spreadsheets toward real-time dashboards that connect store performance, inventory, and customer behavior across physical and digital channels. The useful distinction is not market size but decision timing: some exceptions need event-driven handling, while reconciled financial and cohort metrics can follow a slower review cadence.
This guide covers both internal retail BI (for retailers and stores) and embedded retail analytics (for retail tech SaaS companies). Whether you're managing store performance or building analytics into your POS system, retail dashboards have become essential infrastructure for modern retail operations.
What is a Retail Dashboard?
A centralized data visualization tool that consolidates key performance metrics from across retail operations, sales transactions, inventory levels, customer data, and operational metrics, into a single, accessible interface designed specifically for retail-specific requirements.
A retail dashboard is a centralized data visualization tool that consolidates key performance metrics from across retail operations, sales transactions, inventory levels, customer data, and operational metrics, into a single, accessible interface. Unlike generic business dashboards, retail dashboards handle unique requirements specific to the retail environment.
Retail dashboards differ from standard business intelligence work because transaction, product, location, promotion, and inventory events arrive on different clocks. Some decisions need real-time analytics, while others require a reconciled close. Omnichannel retail also requires identity, product, order, and inventory definitions to remain consistent across physical and digital touchpoints.
Think of a retail dashboard as your store's command center. Just as a car's dashboard shows speed, fuel, and engine temperature at a glance, a retail dashboard displays the vital signs of your business: today's sales versus targets, inventory levels by location, top-selling products, and customer traffic patterns. For retail tech companies, dashboards become the analytics layer their clients depend on for daily operational decisions.
For retail tech SaaS companies building POS systems, inventory platforms, or CRM products, retail dashboards serve as embedded analytics platforms that deliver value directly to end customers. These customer-facing analytics capabilities have evolved from nice-to-have features into competitive necessities.
Live demo: Interactive retail dashboard built with Sumboard, explore revenue by store and region, product category mix, payment methods, and transaction trends.
Core Components of Retail Dashboards
Every effective retail dashboard includes six essential components tailored to retail operations. Sales tracking provides real-time visibility into revenue by product, location, time period, and sales channel. Inventory management monitors stock levels, reorder points, turnover rates, and stockout alerts across all locations. Customer analytics tracks purchase patterns, lifetime value, loyalty program metrics, and segmentation data. Store performance compares metrics across locations including foot traffic, sales per square foot, and staff productivity. Product analytics identifies top performers, slow movers, and category trends. Omnichannel integration unifies data from physical stores, e-commerce platforms, mobile apps, and marketplace channels into a cohesive view.
Retail Dashboard vs General Business Dashboards
Retail dashboard requirements should follow the decisions they support. Stock, price, payment, and fulfilment exceptions may need event-driven handling, while category, finance, and cohort analysis can follow approved review cadences. A generic BI product may or may not support those contracts; evaluate the source latency, semantic model, authorization, and workflow rather than relying on the category label.
| Retail Dashboard Requirements | Generic Business Dashboard |
|---|---|
| Event-driven item-level exceptions where an owner can act | Reconciled category aggregates for review |
| Location-based metrics for multi-store management | Single-location or company-wide rollups |
| Seasonal analysis with year-over-year comparisons | Standard quarterly reporting |
| Customer journey tracking across online and offline touchpoints | Single-channel customer data |
| Promotional performance measurement with before/during/after analysis | Campaign ROI tracking |
| Inventory turnover and carrying cost calculations | Basic asset management |
These retail-specific requirements explain why retailers and retail tech companies need purpose-built solutions rather than adapting generic business intelligence tools designed for different industries.
Types of Retail Dashboards
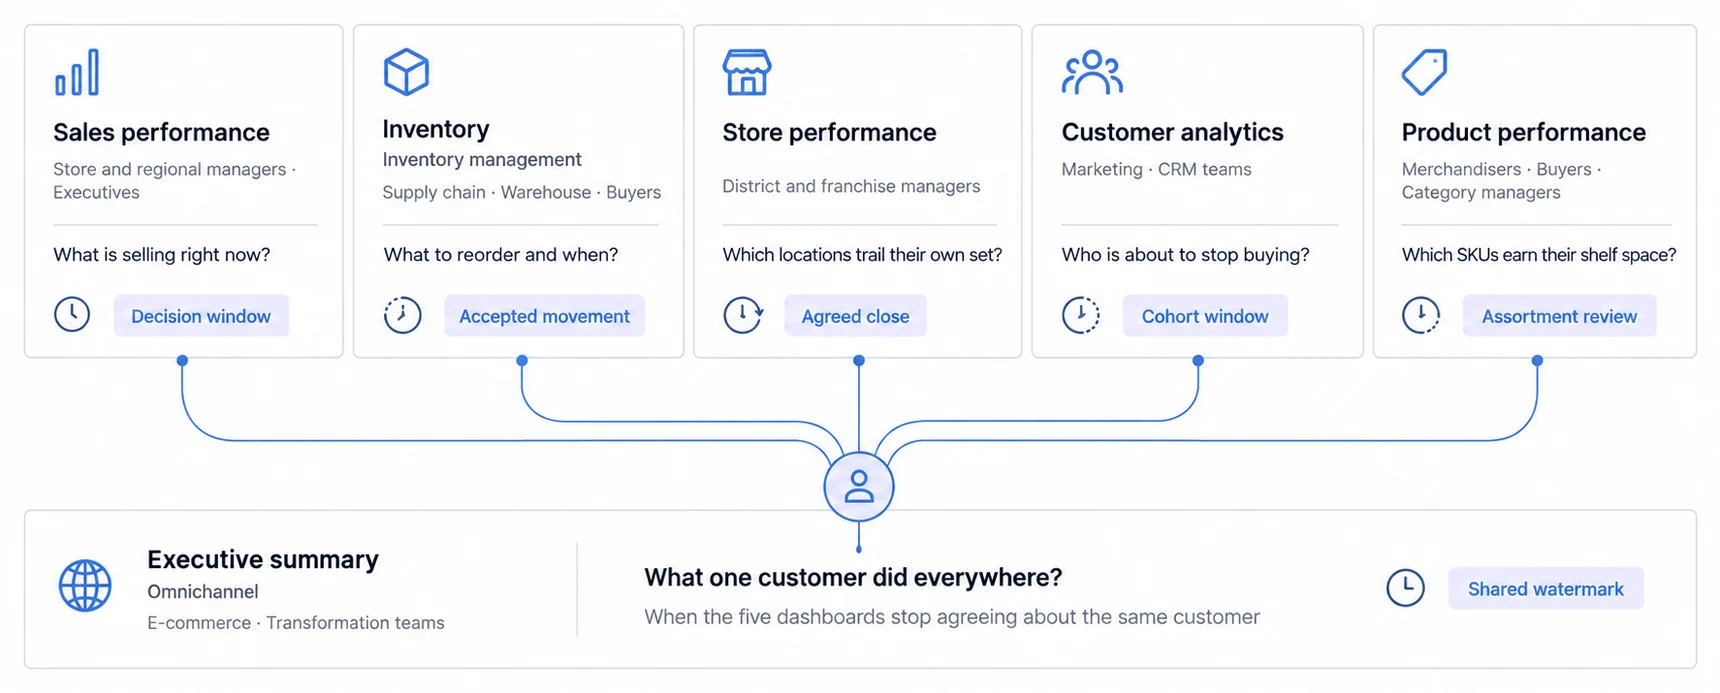
Retail dashboards fall into six main categories, each serving distinct user groups and business objectives. Understanding which type matches your operational needs helps retailers and retail tech companies prioritize retail analytics dashboard development and deployment.
For complete context on how these fit within broader analytics infrastructure, see our complete dashboard types guide.
Sales Performance Dashboards
Sales performance dashboards track revenue generation and transaction patterns across all selling channels. These dashboards serve retail managers, regional directors, and executives who need hourly and daily visibility into sales trends.
Key metrics include daily and hourly sales velocity, revenue by product category and individual SKU, sales by store location and region, sales representative performance and commission tracking, and conversion rates from foot traffic to completed transactions. The most effective sales dashboards highlight anomalies, unexpected spikes or drops that require immediate investigation.
Modern sales dashboards increasingly incorporate AI-powered forecasting that predicts today's final sales numbers by mid-morning, allowing proactive adjustments to staffing and inventory allocation. Real-time visibility enables store managers to identify underperforming associates before the shift ends, providing coaching opportunities while the interactions are fresh.
Inventory Management Dashboards
Inventory represents retailers' single largest investment, making inventory dashboards mission-critical for profitability. These dashboards help supply chain teams, warehouse managers, and buyers maintain optimal stock levels while minimizing carrying costs.
Essential inventory metrics include current stock levels by SKU and location, reorder point alerts before stockouts occur, inventory turnover ratios measuring how quickly products sell, stockout tracking to identify lost sales opportunities, overstock identification revealing excess capital tied up in slow-moving goods, and warehouse performance metrics including receiving speed and accuracy. Advanced inventory dashboards now integrate supplier lead times and seasonal demand patterns to automatically suggest optimal reorder quantities and timing. For supply chain context, see our supply chain dashboard guide and the supply chain KPI dashboard overview.
Retailers running inventory dashboards report improvements in turnover and reductions in both stockout events and excess inventory write-downs. We have no defensible figure for the size of either, so we are not quoting one; the mechanism is that a reorder point you can see is a reorder point you can act on before the shelf is empty.
Store Performance Dashboards
For multi-location retailers, store performance dashboards enable consistent operations and identify opportunities for improvement across the retail network. District managers, regional directors, and franchise managers rely on these dashboards for daily operational oversight.
Store performance metrics compare sales per square foot across locations, track foot traffic patterns throughout the day and week, measure staffing efficiency through sales per employee calculations, monitor regional performance trends, and evaluate operational compliance with corporate standards. The most powerful store performance dashboards normalize metrics for store size, local market conditions, and seasonality to enable fair comparisons.
Leading retailers use store performance dashboards to identify best practices at top-performing locations and rapidly roll out successful strategies across their entire network. When one store discovers an effective product placement or promotional strategy, dashboard visibility ensures the entire organization learns and benefits.
Multi-location retailers using advanced store performance dashboards look for improvement in their underperforming locations, and we are not quoting a percentage or a timeframe for it because we could not find a study that publishes either. The mechanism is rapid identification and replication of successful practices from top stores.
Customer Analytics Dashboards
Understanding customer behavior drives retention and lifetime value in competitive retail markets. Customer analytics dashboards help marketing teams, CRM managers, and customer success teams optimize the customer experience through insights comparable to those in dedicated marketing dashboards.
Customer dashboards track essential metrics including customer acquisition cost and lifetime value comparisons, purchase frequency and recency patterns, customer segmentation by behavior and demographics, loyalty program participation and redemption rates, Net Promoter Score and customer satisfaction metrics, and cohort analysis revealing how customer behavior evolves over time. Advanced implementations incorporate predictive analytics that identify customers at risk of churn before they stop purchasing, capabilities shared with sophisticated campaign performance tracking.
Customer analytics can support retention and transaction-value decisions when a team connects a defined cohort, intervention, and outcome. Measure the effect with the retailer's own experiment or comparison design; product mix and purchase frequency make a general uplift figure meaningless.
Product Performance Dashboards
Product analytics dashboards help merchandisers, buyers, and category managers optimize product mix and pricing strategies. These dashboards reveal which products drive profitability and which tie up capital without adequate returns.
Product metrics include sales velocity by SKU and category, gross margin return on investment (GMROI) revealing profitability per product, sell-through rates measuring how quickly inventory converts to sales, price elasticity analysis showing demand sensitivity to pricing changes, product affinity patterns revealing cross-selling opportunities, and seasonal performance trends informing buying decisions. Product dashboards that incorporate competitive pricing data enable dynamic pricing strategies that maximize both sales volume and margin.
Leading retailers use product dashboards to eliminate underperforming SKUs systematically while doubling down on high-margin winners, improving overall inventory efficiency.
Omnichannel Analytics Dashboards
Modern retail operates across physical stores, websites, mobile apps, and marketplace platforms. Omnichannel dashboards unify data from all touchpoints to reveal the complete customer journey. These dashboards serve digital transformation teams, e-commerce managers, and executives overseeing integrated retail strategies.
Omnichannel metrics include cross-channel attribution showing how customers research and buy across touchpoints, unified inventory visibility preventing channel conflicts, channel preference analysis by customer segment, BOPIS (buy online, pick up in-store) performance tracking, ship-from-store efficiency metrics, and mobile app engagement tied to in-store purchases. The complexity of tracking customers across channels explains why specialized omnichannel dashboards have emerged as a distinct category.
Omnichannel analytics should prove where identity resolution, attribution, inventory availability, and fulfilment handoffs change a decision. Measure outcomes by a defined customer cohort and channel policy rather than assuming a general lifetime-value uplift.
Retail KPIs Fall Into Four Groups, and a Tile Earns Its Place Only by Driving an Action
Effective retail dashboards focus on metrics that drive decisions and actions. These metrics fall into four categories: sales performance, inventory efficiency, customer behavior, and operational effectiveness, and the dashboard types guide covers which type carries which.
Sales Performance KPIs
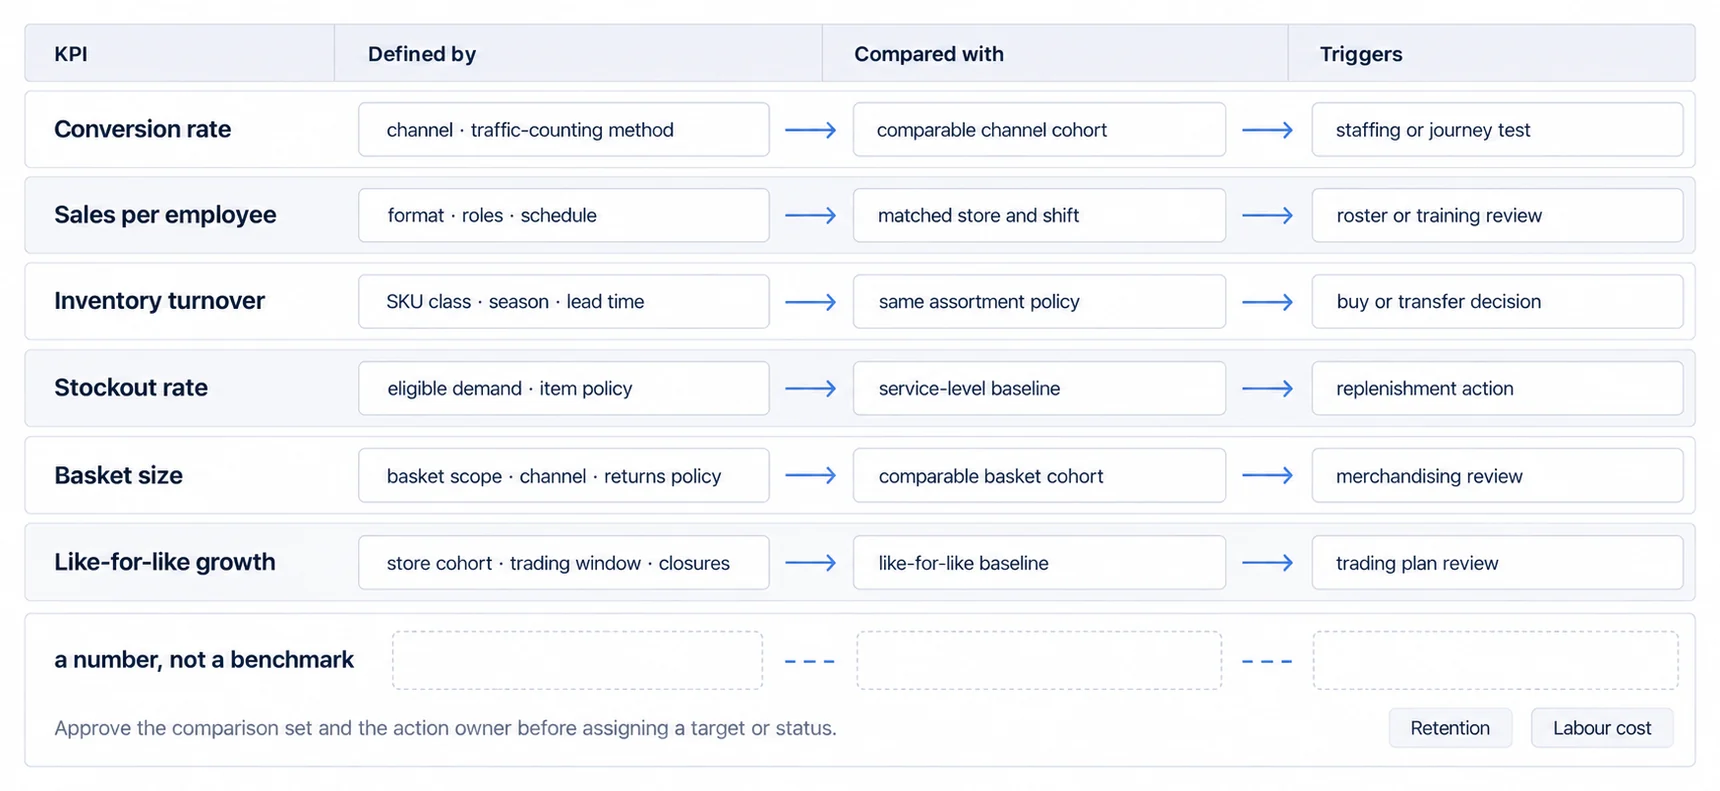
Sales Per Square Foot measures revenue generated per square foot of retail space. This metric enables fair comparison across store sizes and reveals which locations use space most efficiently. Benchmarks vary dramatically by sector, and luxury, specialty, mass merchant and grocery formats are not comparable to one another on this metric at all. Rather than measure against a general band, compare each location against others in the same format, and investigate merchandising effectiveness and store layout where a location trails its own comparable set.
Average Transaction Value (ATV) calculates the average eligible purchase amount under a stated treatment of returns, discounts, taxes, and split orders. Segmenting by store, channel, time, promotion, and product mix can reveal where to investigate. Pair ATV with transaction count and margin before changing staffing, pricing, or promotions.
Conversion Rate measures the share of eligible visits that result in a purchase. Define the visit, purchase window, channel, bot and staff exclusions, and footfall method before comparing locations. Use a matched channel and store-format baseline, then connect changes to a specific staffing, merchandising, or journey experiment.
Sales Per Employee compares sales with a defined labour denominator. Headcount, scheduled hours, paid hours, role mix, store format, and season produce different answers, so record the denominator and compare matched stores or shifts. Use the metric with service, margin, and workload measures before changing staffing or training.
A Refund Restates a Period That Was Already Reported
Every definition above fixes what counts. None of them fixes when it counts, and online that is the larger error: an order recorded on Monday can be reversed three weeks later, and the reversal belongs to Monday rather than to the day the parcel came back.
The size of the effect is published. The NRF and Happy Returns put total industry returns at "$849.9 billion in 2025" and estimate that "19.3% of online sales will be returned in 2025" (2025 Retail Returns Landscape, checked 4 September 2026). A revenue tile computed at order time is therefore showing a figure that a fifth of online sales value will later revise.
Three decisions settle it, and a dashboard that skips them will show two different totals for the same month depending on the day it was opened:
- Which date the reversal is filed under. The original order date restates history and keeps cohorts honest; the refund date leaves history stable and makes the current period absorb old orders. Both are defensible and only one can be in effect.
- How long a period stays open. Take the window from the returns policy rather than the reporting calendar, and mark a period provisional until it closes.
- Whether the tile says which figure it is. Gross and net differ by the return rate, so on this metric the label carries as much information as the number.
Embedded surfaces raise the stake, because a merchant reading their own dashboard inside your product will compare it against their own bank statement.
Inventory KPIs
Inventory Turnover Ratio compares cost of goods sold with average inventory under a stated accounting period. Higher is not automatically better: item class, seasonality, replenishment lead time, service commitment, and margin shape the acceptable range. Compare like-for-like assortment policies and investigate the reason for a change before acting.
Stockout Rate tracks unavailable inventory against a defined set of eligible demand events. Separate core items, substitutes, display stock, and intentionally delisted products; then set the action rule from the service-level and replenishment policy. An alert is useful only when an owner can transfer, substitute, reorder, or change the promise.
Gross Margin Return on Investment (GMROI) combines gross margin with average inventory investment. Keep the margin and inventory definitions consistent, compare within a matched category and season, and review alongside stockouts and service levels. A category can improve GMROI by carrying too little stock, so the metric should not operate as a universal pass/fail threshold.
Days Sales of Inventory (DSI) expresses average inventory relative to cost of goods sold for a stated period. Set policy ranges by item class, lifecycle, lead time, season, and service commitment. A rising value is a prompt to inspect demand, purchasing, and assortment evidence, not proof of a single cause.
Many retailers track inventory metrics in isolation without connecting them to profitability. A high turnover rate means nothing if margins are thin, focus on GMROI to balance efficiency and profitability.
Customer KPIs
Customer Lifetime Value (CLV) estimates contribution from a customer relationship under an explicit horizon, margin definition, discounting method, and retention model. Compare acquisition channels only after reconciling those assumptions and uncertainty. Use observed cohort outcomes to calibrate the model instead of treating a general CLV-to-acquisition ratio as a target.
Customer Retention Rate measures continued activity for a defined cohort, eligibility rule, observation window, and channel. Subscription, replenishment, seasonal, and occasional-purchase businesses require different windows and cannot share a universal target. A decline should trigger cohort and journey analysis before assigning a cause.
Net Promoter Score (NPS) summarizes responses to a recommendation question. Record survey wording, sampling, response rate, channel, and period, and pair the score with verbatim feedback and observed behavior. Route detractor follow-up through the organization's service policy rather than an unsupported universal response-time target.
Purchase Frequency tracks how often customers buy during a given period. Increasing purchase frequency directly drives revenue growth without acquisition costs. Grocers achieve weekly or biweekly purchase frequency through convenient locations and complete assortments, while specialty retailers target monthly or quarterly purchases. Email marketing, loyalty programs, and personalized recommendations all aim to compress purchase cycles and increase annual transaction counts.
Operational KPIs
Labor Cost Percentage measures defined labour cost relative to sales. Service model, trading hours, role mix, wage policy, season, and store maturity all affect the result. Compare with the approved staffing and service plan for matched stores; a rise can come from labour, sales, timing, or allocation changes and is not diagnosis by itself.
Shrinkage Rate tracks inventory loss under a defined reconciliation method and denominator. Separate theft, damage, process errors, supplier discrepancies, and timing effects where the evidence allows. Compare matched categories and stores against the organization's reconciled baseline, then link exceptions to investigation evidence rather than assuming one cause.
Use Cases: Who Benefits from Retail Dashboards
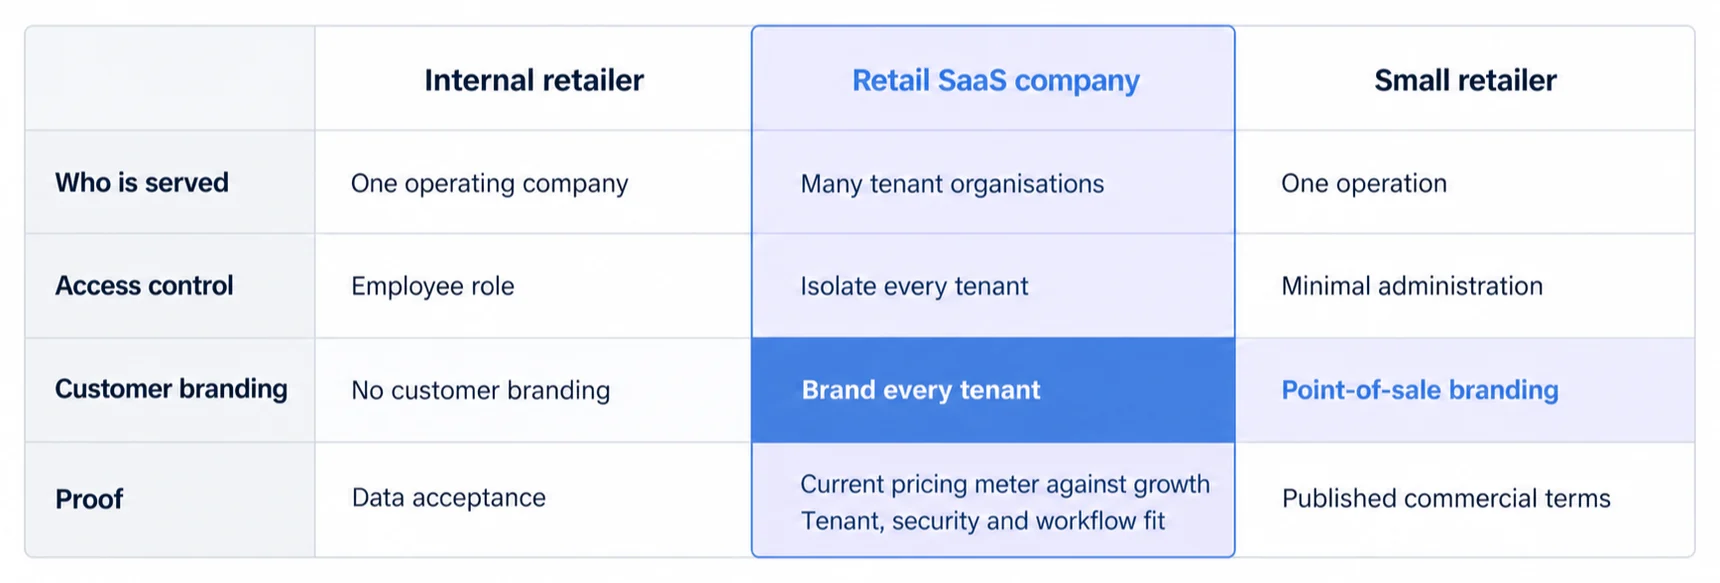
Retail dashboards serve three distinct user groups with different requirements: retailers using dashboards internally, retail tech SaaS companies embedding analytics for clients, and small retail businesses seeking affordable solutions.
For Retailers (Internal Use)
Internal retail dashboards serve roles within one operating company across headquarters, regional teams, and store management. These dashboards help retailers analyze their own operations using traditional BI tools like Tableau, Power BI, or Looker.
Typical users and their dashboard needs include corporate executives monitoring company-wide performance across all locations and channels, category managers analyzing product performance to optimize buying and merchandising decisions, operations directors tracking inventory efficiency and supply chain metrics, marketing teams measuring campaign effectiveness and customer segment behavior, and store managers accessing location-specific sales and operational data.
Internal retail dashboards prioritize complete data access over branding since employees use them. Per-user pricing makes sense with limited user bases. Implementation timelines measured in months accommodate the complexity of integrating multiple data sources and training users.
Retailers running internal analytics usually reach the customer-facing question from the other side. Our customer-facing analytics guide covers where the two meet, and the customer-facing analytics product page sets out what Sumboard ships for it.
For Retail Tech SaaS Companies (Embedded Analytics)
Retail tech SaaS companies, POS vendors, inventory management platforms, retail CRM systems, workforce management tools, and e-commerce platforms provide analytics to separate customer organizations. Unlike internal use cases, embedded retail analytics require explicit tenant boundaries and product-level integration.
Multi-Tenant Architecture Requirements: Each retail client sees only their data, isolated from other clients. This multi-tenancy requirement distinguishes embedded use cases from internal analytics where all users access shared company data. Traditional BI tools designed for single organizations struggle with multi-tenant isolation. Purpose-built embedded platforms handle tenant separation automatically through row-level security and database architecture designed for multi-tenant workloads.
White-Label Branding: Retail clients expect analytics that match their brand identity, not generic dashboards with your SaaS company's logo. This white label analytics requirement means every client needs customized colors, logos, and domain names. Traditional BI tools charge premium fees for white-label capabilities or don't support it at all. Embedded platforms include white-label branding as standard functionality.
Commercial Meter Fit: Retail clients vary in roles, tenants, viewers, query volume, data volume, and workload peaks. Model each vendor's current meter against the expected scenario, including inactive users, environments, support, overages, and renewal terms. Per-user, capacity, usage, and contracted platform fees can each be suitable or unsuitable depending on that scenario.
Delivery Scope: Embedded platforms can remove charting, dashboard-authoring, export, and some operating work through pre-built components, APIs, and SDKs. They do not remove source contracts, tenant authorization, data reconciliation, product integration, security review, accessibility, performance, or rollout. Estimate delivery from a scoped proof and acceptance plan rather than an approach label.
For retail tech companies evaluating embedded dashboard platforms, white-label requirements, multi-tenant architecture, commercial-meter fit, product integration, and operational responsibility matter alongside analyst features. Build the evaluation around the customer workflows and acceptance criteria the product actually needs.
For Small Retail Businesses
Small retailers face different constraints than enterprise chains. Limited budgets, minimal IT resources, and immediate needs for basic reporting drive their dashboard requirements.
Small retail dashboard priorities include smooth POS integration supporting Square, Shopify POS, Toast, or similar small-business platforms, pre-built templates delivering value immediately without custom development, simple setup requiring no technical expertise, transparent pricing with no hidden implementation costs, cloud-based delivery eliminating server management, and responsive support helping non-technical users.
Many small retail POS systems include built-in analytics sufficient for single-location operations. Small retailers should maximize these included capabilities before purchasing separate analytics tools. Additional analytics make sense when POS capabilities don't support multi-location management, customer segmentation beyond basic reports, inventory optimization across locations, or custom reporting requirements.
Retail Dashboard Design Balances Complete Data Access Against a Focused Decision
Effective retail dashboards balance complete data access with focused decision-making. These dashboard design best practices apply specifically to retail analytics contexts.
Visual Hierarchy and Layout
Place the primary decision and its current status where the intended audience finds it first in usability testing. Position supporting metrics so they preserve hierarchy without competing for attention.
Reading order depends on device, language, layout, and task. Define the primary decision, give it a clear heading and status, and verify the scan path with representative users rather than assuming one universal eye-tracking pattern.
Use visual hierarchy to separate immediate exceptions, trend context, and supporting detail, but size and order them from user tasks rather than a fixed screen-percentage formula. Test whether the intended audience can find the current state, understand its freshness, and reach evidence without losing filter context. For marketing-specific dashboards, see our marketing dashboard guide.
Color coding should convey status instantly. Use red for problems requiring immediate action (stockouts, sales below target), yellow for warnings deserving attention (approaching reorder points, conversion rate dips), and green for performance exceeding targets. Avoid using color as the only differentiator, combine color with icons or text labels for accessibility.
Choosing the Right Visualizations
Match chart types to the data and decisions they support. Sales trends over time demand line charts showing patterns and seasonality. Location comparisons across stores require bar charts enabling instant performance ranking. Product mix composition needs pie charts or stacked bars revealing category proportions. Correlation analysis between metrics (sales vs. foot traffic) benefits from scatter plots identifying relationships.
Avoid visualization mistakes that obscure insights. Don't use 3D charts that distort perception and make precise comparison difficult. Use a sorted bar chart when angles or crowded labels make a pie chart hard to compare. Eliminate chart junk including unnecessary gridlines, decorative elements, and excessive labels that don't add information. Every visual element should serve data comprehension or be removed.
Real-Time vs. Batch Updates
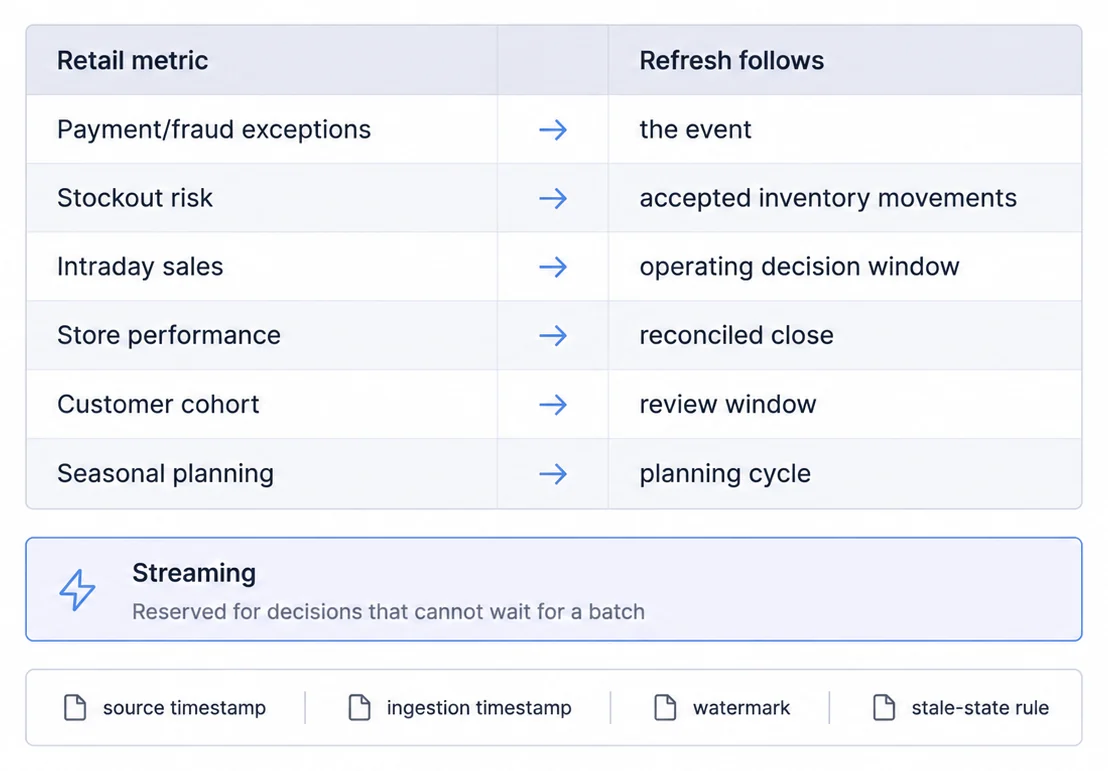
Retail dashboards need different freshness contracts for different decisions. Payment or fraud exceptions may justify event-driven handling when an owner can act immediately. Inventory risk should follow accepted stock movements, intraday sales should match the operating decision window, and reconciled or cohort metrics should follow their approved close or review cadence.
Consider the cost-benefit of real-time analytics. Real-time processing requires more sophisticated infrastructure including streaming data pipelines, in-memory databases, and reliable API architecture. Not every metric justifies this complexity. Start with real-time sales and critical inventory alerts, then expand real-time capabilities based on demonstrated ROI.
For more technical context on implementing real-time capabilities, see our real-time dashboard guide.
Mobile Optimization
Retail managers access dashboards from mobile devices while on sales floors or visiting store locations. Mobile-optimized dashboards require responsive layouts, touch targets verified on supported devices, simplified visualizations that remain readable at the tested viewport, and an explicit offline or stale-data state for limited connectivity.
Prioritize mobile content ruthlessly. Mobile dashboards should show only essential metrics, complete analysis belongs on desktop. Consider separate mobile views focused on alerts and exceptions rather than trying to compress full desktop dashboards into mobile screens.
Building or Buying Both Require Understanding the Stack From Source to Interface
Building or buying retail dashboards requires understanding the complete technology stack from data sources through user interface.
Data Sources and Integration
Retail dashboards aggregate data from multiple sources creating a unified analytical view. Common data sources include POS systems (Square, Shopify POS, Toast, Lightspeed, Clover) containing transaction data, inventory management systems tracking stock levels and movements, customer relationship management (CRM) platforms storing customer data and interactions, e-commerce platforms (Shopify, Magento, WooCommerce) for online channel data, employee scheduling and timekeeping systems for labor cost analysis, and financial systems (QuickBooks, Xero) providing accounting context.
Integration approaches vary by data source capabilities. Modern SaaS platforms typically offer REST APIs enabling real-time data extraction. Legacy systems may require database connections pulling data directly from production databases. Some platforms support webhooks that push data to your analytics system as events occur, eliminating polling overhead.
A pre-built connector can reduce integration work only if it covers the required objects, fields, history, rate limits, authentication, deletion behavior, and freshness contract. Prove those paths with representative data before treating configuration as complete.
Data Warehousing and Modeling
Retail analytics require a data warehouse consolidating information from multiple source systems. Cloud data warehouses (Snowflake, BigQuery, Redshift) offer scalability and managed infrastructure. Traditional data warehouses (SQL Server, PostgreSQL) provide more control at the cost of operational overhead.
Data modeling for retail analytics typically uses dimensional modeling with fact tables (sales transactions, inventory movements) and dimension tables (products, stores, time periods, customers). This structure enables fast aggregation queries powering dashboard visualizations. Slowly changing dimensions handle historical analysis, tracking how products, prices, or customer attributes evolve over time.
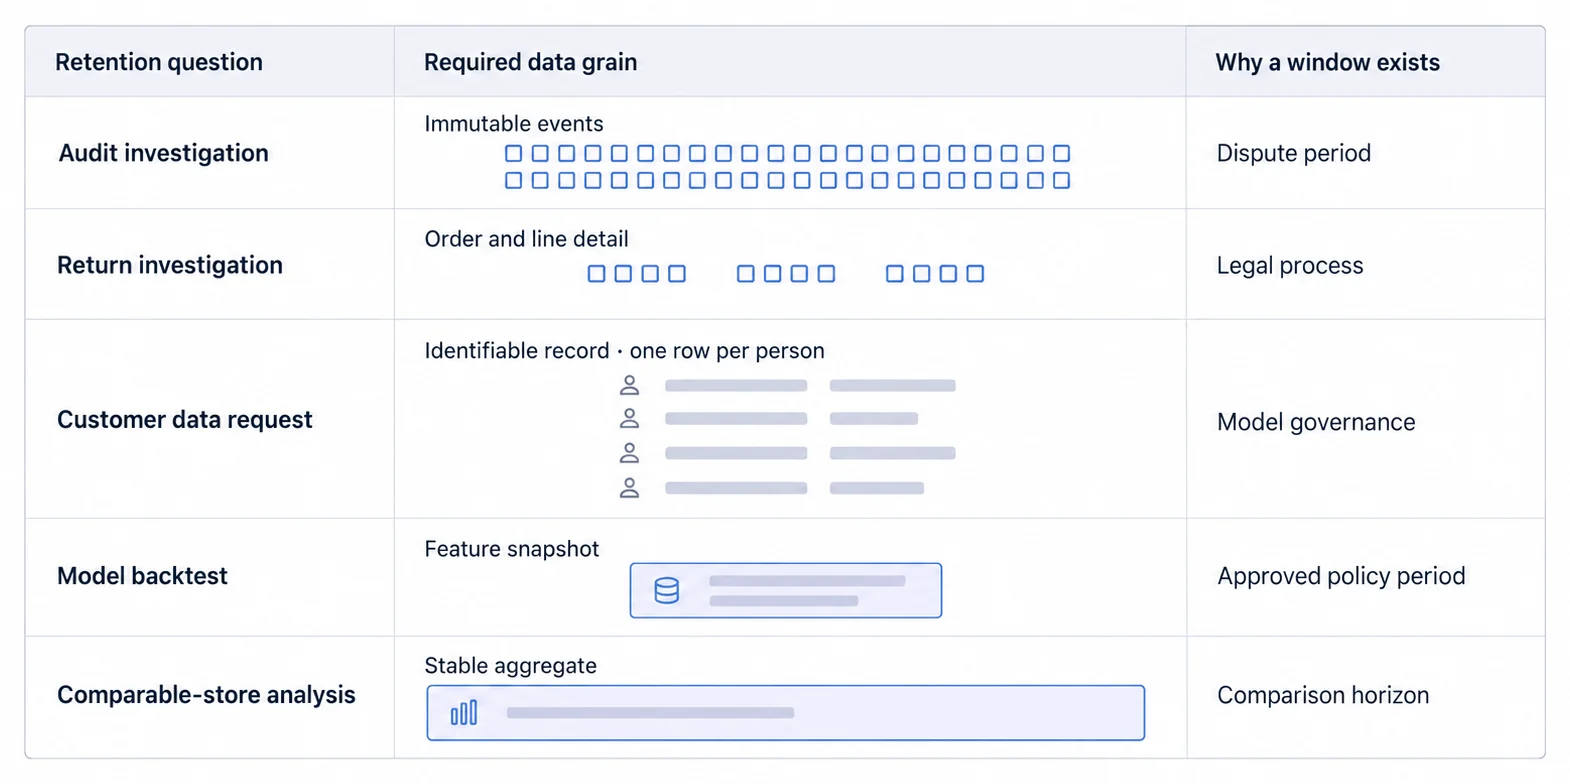
Set retention from approved questions, legal obligations, recovery needs, and measured storage and query cost. Transaction detail supports new investigations but carries greater privacy, storage, and operating burden; stable aggregates support known comparisons but cannot answer new line-level questions. Record the required grain and retention evidence for each use case.
Visualization Layer
The visualization layer transforms raw data into actionable dashboards. Options include embedded analytics platforms like Sumboard offering pre-built retail dashboard templates and white-label analytics capabilities, enterprise BI tools (Tableau, Power BI, Looker) providing complete features for internal analytics, open-source options (Metabase, Superset) offering flexibility with operational overhead, and custom development using React chart libraries or JavaScript frameworks for maximum control.
For retail tech SaaS companies, test embedded and enterprise BI options against the same tenant isolation, authorization, branding, SDK, workflow, performance, accessibility, operations, and exit criteria. Product category alone does not prove fit.
Embedding Approaches
Retail tech companies embedding dashboards in their products choose between two main approaches. iFrame embedding wraps dashboards in iframes within your application, simple to implement but limited in customization and integration. SDK integration uses JavaScript SDKs embedding dashboard components directly into your application's DOM, more complex initially but enabling deep customization and smooth user experience.
Modern embedded platforms offer both approaches, allowing you to start with iframe embedding for rapid deployment and migrate to SDK integration as requirements mature. For teams building API-first architectures, see our API-first analytics implementation guide.
Retail Dashboards Depend on Several Systems, So Integration Is Planned Before It Is Built
Retail dashboards depend on accurate, timely data from multiple systems. Understanding common retail data sources helps retailers and retail tech companies plan integration strategies.
Point of Sale (POS) Systems
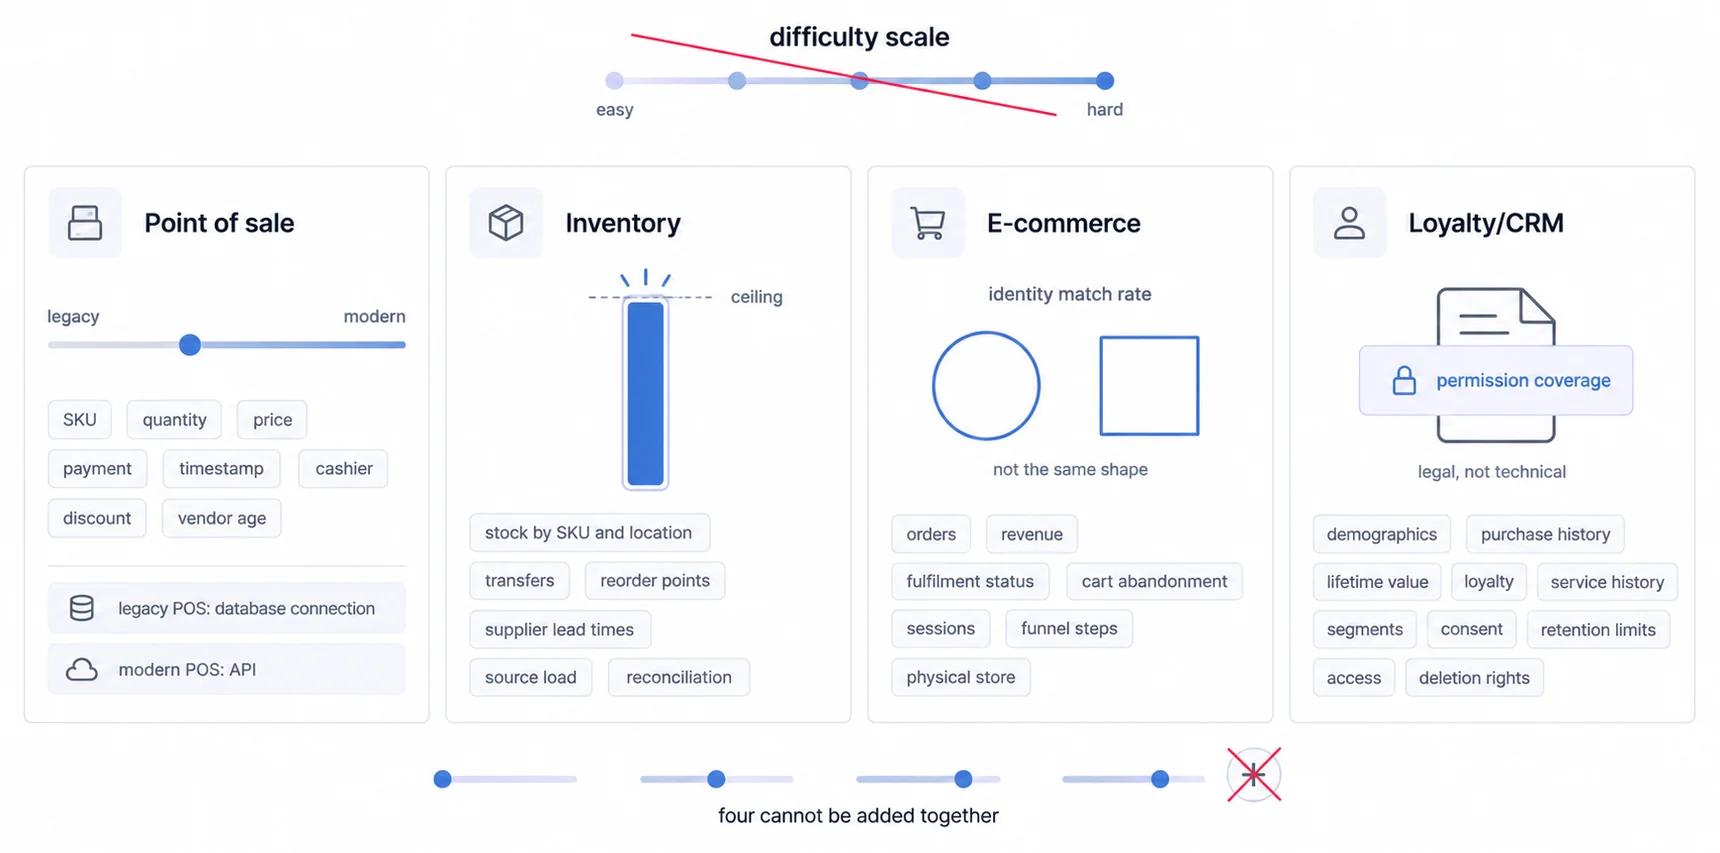
POS systems represent the primary data source for retail dashboards. Modern cloud-based POS platforms (Square, Shopify POS, Toast, Lightspeed, Clover) offer APIs extracting transaction-level detail including product SKUs sold, quantities and prices, payment methods, timestamps, cashier identifiers, customer identifiers (when available), and applied discounts or promotions.
Legacy on-premise POS systems often require database connections rather than APIs. These systems may store data in proprietary formats requiring reverse engineering or vendor support for extraction. Expect integration challenges with older systems including limited documentation, database schema complexity, and vendor resistance to third-party access.
POS integration cadence depends on the decision window, source capabilities, rate limits, event guarantees, reconciliation process, and operating cost. Use webhooks or streaming only where an owner can act before the next scheduled load, and reconcile event-driven data against the source of record.
Inventory Management Systems
Inventory systems track stock levels, movements, and supplier information. Integration points include current inventory levels by SKU and location, inventory receipts and shipments, transfer orders between locations, stock adjustments from audits or shrinkage, reorder points and safety stock levels, and supplier information and lead times.
Inventory freshness must balance accepted movement state, reservation logic, decision urgency, source load, and reconciliation. Display the source timestamp and stale state, and set cadence from the oversell or replenishment decision rather than copying a generic interval.
Customer Relationship Management (CRM)
Customer data enables personalization and retention analysis. CRM systems provide customer demographic information and contact details, purchase history and lifetime value, loyalty program participation and points, customer service interactions and resolution status, customer segmentation and cohort assignments, and marketing campaign engagement metrics.
Privacy regulations (GDPR, CCPA) impose requirements on customer data handling. Ensure dashboards comply with consent requirements, data retention limits, customer access and deletion rights, and anonymization for aggregate analysis. Non-compliance creates legal and reputational risk that outweighs analytical benefits.
E-commerce Platforms
Online sales data complements physical store transactions for omnichannel retailers. E-commerce platforms (Shopify, Magento, WooCommerce, BigCommerce) provide online order data including product details and revenue, customer information and purchase history, cart abandonment events for recovery campaigns, session data and traffic sources, product views and conversion funnels, and shipping and fulfillment status.
Unified analytics require mapping e-commerce data to POS data structures. Reconcile product SKUs that may differ between systems. Consolidate customer records when the same person shops both online and in-store. Create unified inventory views showing total stock across all channels.
Serving Several Retail Clients Means Isolating Their Data While Sharing the Infrastructure
Retail tech companies serving multiple clients require multi-tenant architecture ensuring data isolation while enabling efficient resource utilization. Multi-tenant design fundamentally differs from single-tenant internal analytics.
What is Multi-Tenancy in Retail Context?
Multi-tenancy means a shared application or service boundary serves multiple retail clients while authorization and data controls isolate each tenant. The exact isolation boundary can exist at infrastructure, database, schema, row, semantic-model, and application layers; it must be defined and tested for the system's threat model.
Multi-tenant architectures offer compelling economics for retail SaaS companies. Shared infrastructure means one set of servers absorbs the load of every tenant, so cost grows with total usage rather than with client count, which is the difference that makes small accounts viable at all. Centralized maintenance means software updates deploy once, benefiting all tenants simultaneously. Efficient resource utilization allows small tenants to share infrastructure with larger clients rather than provisioning separate systems for each customer.
Multi-Tenant Data Isolation
Tenant isolation can use separate infrastructure, databases, schemas, database policies, semantic-model rules, and application authorization in different combinations. No one pattern is automatically the strongest or simplest in every system: evaluate bypass paths, privileged access, migrations, connection pooling, caching, exports, background jobs, and operational evidence.
A tenant predicate in an application query makes the intended scope visible, but it is not a substitute for independently enforced authorization. For example:
SELECT * FROM sales_transactions
WHERE tenant_id = 'store_123'
AND transaction_date >= '2026-01-01';
This query is scoped only because the predicate is present. If application code can omit it, the database role still needs an independently enforced policy. Database-native row-level security, least-privilege roles, tenant-aware caches and exports, and negative cross-tenant tests can provide defense in depth; verify the actual database and connection-pool configuration.
White-Label Customization
Retail clients expect dashboards reflecting their brand, not yours. White label analytics platforms enable per-tenant customization including custom logos and color schemes matching brand guidelines, custom domain names (analytics.clientstore.com instead of yourvendor.com/client), custom email templates for scheduled reports, custom PDF export headers and footers, and custom terminology (changing "sales" to "revenue" or "locations" to "franchises").
Advanced white-label platforms may support different feature entitlements per tenant. Treat those entitlements as authorization rules, test them server-side, and keep branding configuration separate from access control.
Tenant Onboarding Automation
Manual tenant provisioning creates repeat work and inconsistent evidence as the customer base grows. Automated onboarding can include tenant schema or policy initialization, dashboard templates, source connection and validation, identity setup, branding, monitoring, and alerting.
Automated onboarding can cover tenant creation, source authorization, schema checks, default templates, branding, and user provisioning. Track completion rate, manual interventions, elapsed time, failed steps, and support effort from your own onboarding records before claiming zero-touch delivery or a profitability effect.
Build or Buy Compares Honestly Only at the Same Scope and Over the Full Ownership Period
Retail tech companies face a critical decision: build analytics capabilities in-house or buy embedded analytics platforms. This section compares the routes with a consistent scope and evidence model.
Understanding these trade-offs requires examining not just initial development but total cost of ownership including maintenance, feature development, and opportunity costs.
Building In-House
Building retail dashboards in-house can provide control over product behavior, data architecture, and change sequencing. The comparison is useful only when all delivery and recurring ownership lines are included.
Delivery Scope: Define data contracts and pipelines, metric reconciliation, dashboard components, multi-tenant authorization, white-label analytics behavior, product APIs, identity, exports, accessibility, observability, and acceptance testing. Estimate each work package from your architecture, team capacity, dependencies, and proof results.
Price initial delivery from the loaded time of the people assigned, infrastructure and tooling invoices, external services, and measured contingency risks. Keep assumptions visible so scope changes alter the model rather than disappearing into a generic range.
Ongoing Ownership: Track security patches and dependency updates, incidents and support escalations, metric and product changes, performance and capacity work, backups and recovery tests, access reviews, audit evidence, and tenant migrations.
Price recurring ownership from named owners, on-call coverage, loaded time records, infrastructure invoices, support history, and the release backlog. A generic staffing ratio or annual figure cannot represent your reliability target, tenant count, workload, or change rate.
Opportunity Cost: Record which approved work is displaced by the analytics route and model only the delay or capacity effect that your plan supports. Whether buying is preferable depends on strategic differentiation, acceptance fit, commercial terms, and the responsibilities that remain internal.
When Building Makes Sense: Consider building when the required analytics behavior is a core product capability, platform proofs fail material acceptance criteria, and the organization is prepared to own the complete lifecycle. Document that decision against the same security, reliability, accessibility, product, and exit requirements used for vendor options.
Buying Embedded Analytics Platforms
Embedded analytics platforms provide pre-built functionality for embedded use cases and can transfer some product and operating work to the provider. The actual delivery and cost difference must be measured for the required scope.
Platform Costs: Embedded analytics platform pricing may meter named or active users, viewers, capacity, queries, compute, data, environments, support, or a contracted platform scope. Capture the current quote, billable event, limits, overages, renewal terms, and expected workload.
Do not infer a product's meter from its category or assume “unlimited” removes every capacity limit. Model every option with the same creators, tenants, viewers, workload peaks, environments, support level, growth, and term.
Implementation Scope: Include requirements and metric contracts, source integration, tenant authorization, dashboard configuration, product and branding integration, security and accessibility review, performance testing, data reconciliation, user acceptance, rollout, and operational handoff.
Price implementation from the vendor statement of work and your team's loaded time. Confirm whether professional services, support, non-production environments, migration, and change requests are included rather than assuming they are part of a subscription.
When Buying Makes Sense: Consider an embedded platform when a scoped proof meets the required multi-tenant, authorization, branding, workflow, security, performance, accessibility, operations, and exit criteria, and the commercial model is preferable under the same scenario as the build option.
Cost Comparison: Same-Scope Evidence
| Cost line | Build evidence | Vendor evidence |
|---|---|---|
| Delivery | Loaded project time, tools, infrastructure | Statement of work, professional services, internal time |
| Platform | Compute, database, storage, network, licences | Current quote, billing meter, limits, overages |
| Operations | Runbooks, on-call, incidents, recovery tests | Responsibility matrix, support terms, internal owner time |
| Security | Patching, access reviews, audit evidence | Control split, provider evidence, customer controls |
| Change and exit | Release backlog, compatibility, migration rehearsal | Change terms, export test, migration work |
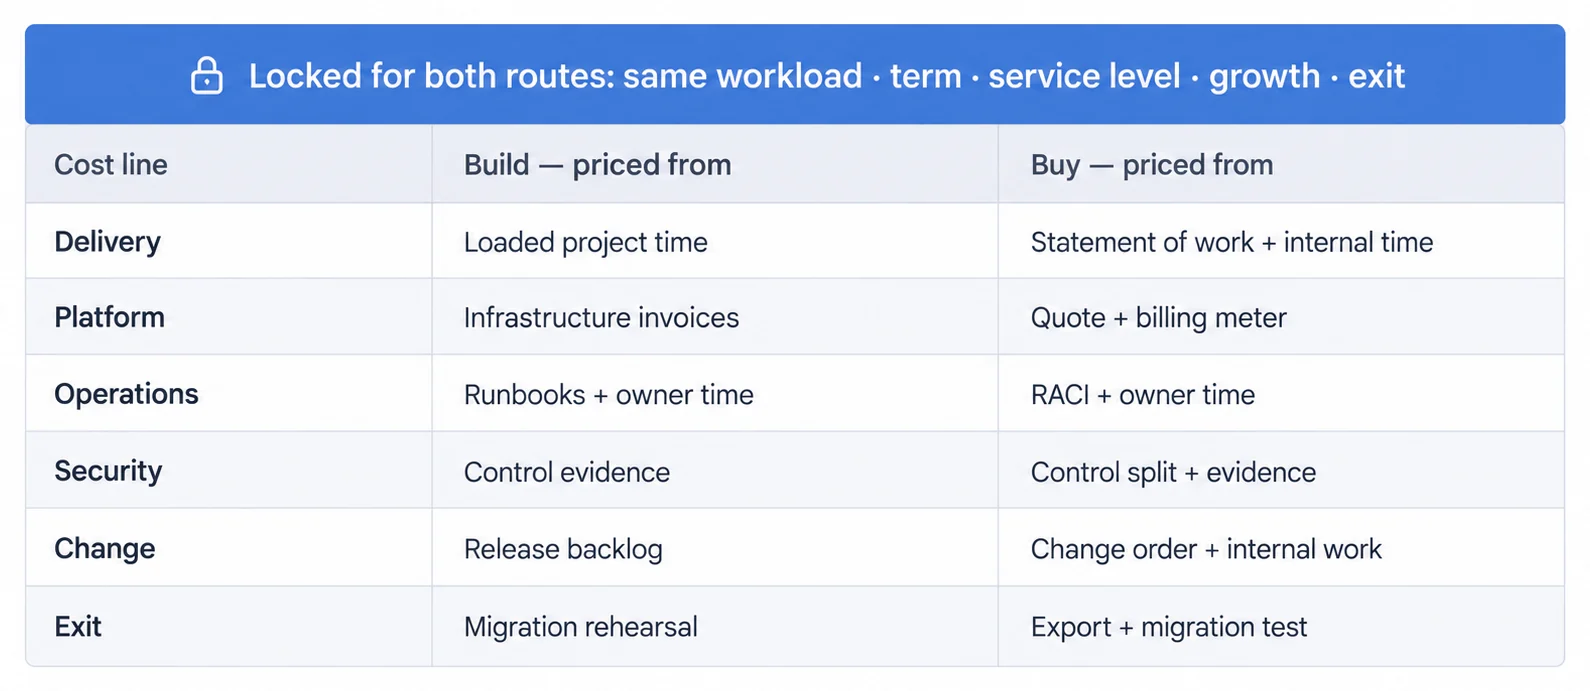
Set one workload, term, service level, growth path, and exit assumption, then populate both routes from current evidence. Keep opportunity cost separate and include it only when an approved delivery plan identifies displaced work or a defensible delay.
The result may favor either route. The decision should follow acceptance fit, responsibility, risk, and the reconciled scenario, not a generic cost multiple.
The Right Retail Platform Depends on Which of Three Use Cases You Are Actually In
Choosing the right retail dashboard platform depends on your use case, internal retail BI, embedded retail SaaS analytics, or small business needs. These criteria help evaluate platforms against specific requirements.
For Retail Tech SaaS Companies (Embedded Use Cases)
Retail tech companies embedding analytics for clients should prioritize multi-tenant isolation, tenant-aware authorization and exports, white-label analytics depth, SDK and product integration, commercial-meter fit, source coverage, performance, accessibility, operations, support, and tested exit paths. Validate these requirements in a scoped proof with representative tenants and data.
Additional evaluation criteria include SDK quality and documentation for deep product integration, customer-facing analytics features like scheduled reports and PDF exports, SOC 2 compliance and security certifications for enterprise sales, responsive support helping resolve integration challenges quickly, and transparent roadmap aligned with embedded analytics trends.
Traditional BI and purpose-built embedded products expose different tenancy, branding, SDK, licensing, and operating models. Compare their current capabilities and commercial terms against the same acceptance criteria; neither category eliminates integration or customer-side control work.
For Retailers (Internal Use Cases)
Retailers selecting internal business intelligence tools should focus on complete POS integration supporting their specific POS vendor, multi-location management for chains and franchises, inventory analytics including turnover and reorder optimization, traditional BI tool maturity with established vendors like Tableau or Power BI, training resources and documentation for retail analysts, and proven retail implementations from established vendors.
For internal retail analytics, the trade-offs differ from embedded use cases. Customer-specific branding and tenant product integration may be unnecessary, while analyst workflow, governed self-service, source coverage, and internal identity matter more. Model the quoted pricing meter and rollout work against the actual internal roles and workload.
For Small Retail Businesses
Small retailers with limited budgets should prioritize easy setup requiring minimal technical expertise, pre-built templates accelerating dashboard deployment, POS integration for Square, Shopify, or other small-business platforms, straightforward pricing without hidden fees, minimal IT requirements with cloud-based SaaS delivery, and friendly support helping non-technical users.
Many small retail POS systems include basic built-in analytics sufficient for single-location operations. Small retailers should maximize these included capabilities before purchasing separate analytics tools.
Retail Dashboard Implementation Scenarios
These implementation scenarios illustrate how retail tech SaaS companies can use embedded analytics. Treat the stated outcomes as hypotheses to instrument, not industry benchmarks.
POS System Implementation Scenario
A multi-location POS vendor can embed sales performance by location, product reports, and employee views where policy allows. Instrument adoption, report-related support demand, upgrade behavior, retention, and sales feedback separately; the dashboard does not prove an uplift by itself.
If analytics is positioned as a paid entitlement, measure exposure, trial, activation, continued use, and upgrade conversion so the product team can distinguish demand from packaging effects.
Inventory Management Platform Implementation Scenario
Inventory SaaS platforms can pair accepted stock movements with reorder alerts and multi-location views. Test whether exposed users change transfer or replenishment actions, then measure stockout events, inventory policy outcomes, adoption, and satisfaction against a defined comparison.
Do not infer willingness to pay or rollout expansion from visibility alone. Capture the decision changed, the affected users, the operational outcome, and the commercial event in customer evidence.
E-commerce Analytics Platform Implementation Scenario
E-commerce analytics platforms can expose conversion funnels, customer behavior, and cart abandonment. Tie each view to an experiment or intervention and measure conversion, abandonment, packaging, and customer evidence independently.
Historical data, metric definitions, configured dashboards, exports, and workflow dependencies can affect switching work. Test export completeness and migration effort rather than treating lock-in as product value.
Five Retail Analytics Shifts That Change Product and Data Decisions Now
The retail analytics landscape changes as new technologies mature and customer expectations shift. The following themes affect current product and data decisions.
AI-Powered Predictive Analytics
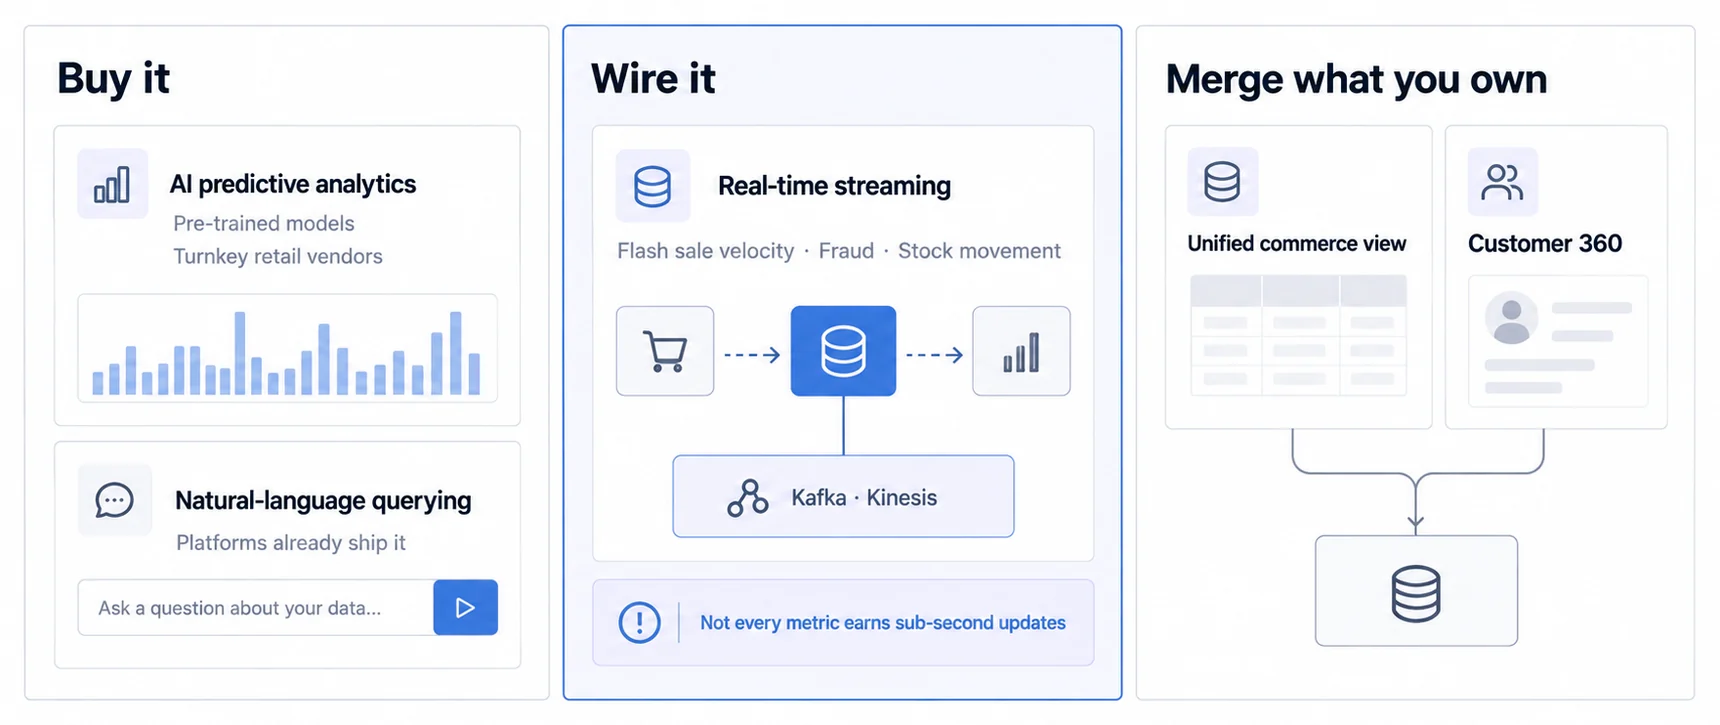
Artificial intelligence increasingly powers retail dashboards with predictive capabilities that forecast demand, optimize pricing, and prevent stockouts. Modern AI analytics platforms now offer demand forecasting that predicts future sales by SKU and location using historical patterns, seasonality, and external factors like weather and local events, dynamic pricing recommendations suggesting optimal price points that maximize revenue while maintaining competitive positioning, inventory optimization calculating ideal reorder quantities and timing based on supplier lead times and predicted demand, customer churn prediction identifying at-risk customers before they defect, and promotional effectiveness forecasting predicting ROI before launching campaigns.
These AI-powered capabilities move dashboards from descriptive (what happened) to prescriptive (what should we do). Rather than simply showing that sales declined, AI-enhanced dashboards recommend specific actions like adjusting staffing levels, transferring inventory between locations, or launching targeted promotions.
Implementation barriers for AI analytics are falling rapidly. Pre-trained models require minimal configuration rather than expensive data science teams. Cloud-based ML platforms (AWS SageMaker, Google Vertex AI) handle infrastructure complexity. Retail-specific AI vendors offer turnkey solutions for common use cases like demand forecasting and price optimization.
Augmented Analytics and Natural Language Queries
Augmented analytics uses AI to make data analysis accessible to non-technical users through natural language. Retail managers can ask "Which products are trending in the Northeast region?" and receive instant visualizations without SQL knowledge or dashboard navigation.
Leading retail analytics platforms now support conversational interfaces where users type questions in plain language, automated insight generation that surfaces notable patterns without manual analysis, smart data preparation that cleans and structures data automatically, and automated anomaly detection alerting managers to unusual patterns.
This democratization of analytics extends advanced capabilities to frontline managers and store employees who previously couldn't access sophisticated analysis. When every employee can ask data questions and receive instant answers, organizations make faster, better-informed decisions at all levels.
Real-Time Streaming Analytics
Traditional batch processing (updating dashboards overnight or hourly) can't match the speed of modern retail operations. Real-time analytics platforms now process transaction streams as events occur, enabling second-by-second visibility.
Real-time retail use cases include flash sale monitoring tracking sales velocity and triggering inventory allocations dynamically, fraud detection identifying suspicious transaction patterns immediately, dynamic inventory allocation transferring stock between locations based on real-time demand, personalized promotion triggering sending targeted offers based on current shopping behavior, and supply chain optimization adjusting logistics based on real-time inventory movements.
Cloud data platforms (Kafka, Kinesis, Pub/Sub) make real-time streaming accessible without massive infrastructure investments. Retail dashboards connected to streaming platforms update continuously rather than refreshing on fixed schedules.
While real-time capabilities create competitive advantages, not every metric requires sub-second updates. Start with real-time for critical metrics (sales, inventory alerts) and expand based on demonstrated ROI. Real-time infrastructure costs more than batch processing, ensure the business value justifies the investment.
Embedded Analytics Becoming Table Stakes
Embedded analytics evolved from differentiator to table-stakes functionality for retail SaaS platforms. Retail clients now expect integrated dashboards as standard features, not optional add-ons requiring separate vendors.
This shift affects product strategy for retail tech companies. POS vendors, inventory platforms, and retail CRM systems must include analytics or lose deals to competitors offering integrated solutions. The question changed from "Should we add analytics?" to "How quickly can we ship analytics capabilities?"
Modern embedded platforms compressed implementation timelines from months to weeks, making analytics feasible even for early-stage retail SaaS companies. No-code dashboard builders enable product teams to create analytics features without extensive engineering resources. The democratization of embedded analytics means even small retail tech companies compete on analytics capabilities that previously required enterprise budgets.
Omnichannel Attribution and Unified Commerce
Retailers operating across physical stores, e-commerce, mobile apps, and marketplace channels need unified analytics showing complete customer journeys. Omnichannel attribution reveals which touchpoints drive conversions and how customers research across channels before purchasing.
Advanced omnichannel dashboards track customer cross-channel behavior mapping how shoppers research online and buy in-store, unified inventory showing real-time stock across all channels, attribution modeling assigning revenue credit across multiple touchpoints, BOPIS performance measuring buy-online-pick-up-in-store effectiveness, and ship-from-store metrics tracking inventory efficiency.
Creating truly unified commerce requires breaking down data silos between channels. Many retailers maintain separate systems for e-commerce, POS, and inventory, preventing unified visibility. Cloud-based retail platforms increasingly offer native omnichannel capabilities, simplifying data integration challenges.
Build retail analytics into your product
Ship white-label retail dashboards with Sumboard's embedded analytics platform and multi-tenant architecture.