Artificial intelligence is transforming how organizations analyze data. Traditional business intelligence required weeks of analyst work to generate static reports showing what happened in the past. AI analytics delivers instant, conversational insights accessible to everyone in the organization, predicting future outcomes and recommending optimal actions automatically.
This transformation extends beyond internal use cases. B2B SaaS companies now embed AI-powered features into their products, offering customers conversational interfaces, predictive recommendations, and automated insights. The challenge isn't accessing AI models (GPT, Claude, and Gemini are readily available via API), but rather building the infrastructure to integrate proprietary ML models, visualize AI outputs in branded dashboards, and serve thousands of customers with secure multi-tenant architecture.
This guide covers AI analytics fundamentals, implementation approaches, and infrastructure considerations for companies wanting to embed AI-powered insights into their products. Whether you're evaluating the embedded analytics alternatives or building internal capabilities, understanding the AI analytics landscape helps you make informed decisions about your data strategy.
What is AI Analytics?
AI analytics applies artificial intelligence (machine learning, natural language processing, neural networks) to automate and enhance data analysis. Rather than requiring manual analyst work to write queries, build visualizations, and interpret results, AI analytics systems automate these processes while discovering patterns humans might miss.
Three core capabilities define AI analytics:
Automated analysis processes vast datasets without human intervention. Machine learning models identify correlations, detect anomalies, and surface relevant insights automatically. Interest in AI has pushed data quality and management up the agenda for data leaders. We could not verify a specific percentage against a primary source we could link, so we are describing the direction rather than quoting a figure.
Pattern discovery uncovers relationships that traditional analytics would miss. Neural networks can weigh many more inputs at once than a person can hold in mind, identifying non-linear relationships that standard statistical methods are not built to surface. McKinsey's State of AI 2025 survey found 88% of organizations reporting regular AI use in at least one business function, up from 78% a year earlier, though most are still experimenting or piloting rather than scaling (McKinsey, State of AI 2025).
Predictive and prescriptive recommendations go beyond describing what happened to forecasting what will happen and recommending specific actions. AI models trained on historical data predict future outcomes with confidence intervals, then use optimization algorithms to recommend optimal decisions.
The evolution from traditional business intelligence to AI analytics represents a fundamental shift from reactive reporting to proactive decision-making. Rather than reviewing last quarter's performance, organizations anticipate next quarter's challenges and receive specific recommendations for addressing them.
How AI Analytics Works
AI analytics systems follow an end-to-end workflow that transforms raw data into actionable recommendations:
Data collection and integration pulls information from multiple sources, databases, APIs, file uploads, streaming data. Modern platforms handle both structured data (SQL databases, spreadsheets) and unstructured data (documents, images, audio). According to DataArt (2026), AI and ML integration into data analytics systems has become critical across industries, with AI representing a top investment priority for most organizations.
Data preprocessing and cleaning applies AI to repeatable preparation steps. ML algorithms can flag missing values, identify outliers, infer data types, and suggest transformations, while a person still decides whether those changes preserve the meaning of the source data.
Pattern discovery uses machine learning algorithms to identify relationships in data. Supervised learning models find correlations between known outcomes and input variables. Unsupervised learning discovers hidden clusters and segments without predefined categories. Deep learning neural networks detect complex patterns across high-dimensional datasets.
Insight generation and visualization translates mathematical models into business-friendly explanations. Natural language generation systems describe findings in plain language. Data visualization components render predictions, confidence intervals, and feature importance scores as interactive charts.
Predictive modeling applies trained algorithms to forecast future outcomes. Time series models predict revenue, customer behavior, and operational metrics. Classification algorithms estimate probability of events like customer churn, equipment failure, or fraud.
Continuous learning and refinement improves models over time as new data arrives. Online learning systems update predictions in real-time. Feedback loops incorporate user corrections and actual outcomes to enhance accuracy. Google Cloud (2026) reports that their conversational analytics agents use continuous learning from user interactions to improve answer quality.
AI Analytics Augments the Analyst Rather Than Replacing Them
Traditional analytics and AI analytics serve complementary roles, with AI augmenting rather than replacing human analysts. The comparison reveals fundamental differences in approach, speed, and capabilities:
| Dimension | Traditional Analytics | AI Analytics |
|---|---|---|
| Speed | Batch processing, hours to weeks | Real-time analytics, seconds to minutes |
| Accessibility | Requires SQL, BI tools, technical skills | Natural language interfaces, conversational |
| Insights Depth | Descriptive (what happened) | Predictive and prescriptive (what will happen, what to do) |
| Scalability | Manual analyst work, linear scaling | Automated processing, exponential scaling |
| User Experience | Static dashboards, scheduled reports | Conversational interfaces, dynamic exploration |
| Analysis Complexity | Pre-defined metrics, standard reports | Ad-hoc questions, multi-step reasoning |
| Data Volume | Sample-based when large datasets | Full dataset processing at scale |
The useful split is not between organisations that use AI and those that do not. It is between those still running experiments and those with something in production that a named person owns. Where AI is aimed only at cost, it tends to stay in the experiment column, because an efficiency gain is easy to claim and hard to attribute. Test that against your own portfolio rather than against a headline: count the initiatives with an owner and a production deadline, then count the ones still described as pilots.
However, AI analytics doesn't eliminate the need for human judgment. Analysts focus on strategic questions, validate AI-generated insights, and provide business context that algorithms lack. The combination of human expertise and AI automation delivers better results than either approach alone.
Seven Categories of AI Analytics, Each Answering a Different Business Question

AI analytics encompasses seven distinct categories, each addressing different business questions and requiring different techniques. The traditional four types (descriptive, diagnostic, predictive, prescriptive) are now complemented by three emerging types enabled by recent AI advances.
1. Descriptive Analytics: "What Happened?"
Descriptive analytics summarizes historical data to understand past performance and current trends. AI enhances traditional descriptive analytics by automatically processing vast datasets that would be impractical to analyze manually.
Machine learning algorithms identify patterns in millions of records, detecting seasonal trends, periodic cycles, and recurring patterns automatically. Natural language generation systems create human-readable summaries of findings. Anomaly detection highlights unusual events worthy of further investigation.
Retail example: AI analyzes point-of-sale data from thousands of stores over multiple years, automatically identifying seasonal purchasing patterns, regional preferences, and cross-sell opportunities. The system generates executive-friendly summaries describing key trends without requiring analysts to write custom queries for each pattern.
2. Diagnostic Analytics: "Why Did It Happen?"
Diagnostic analytics investigates root causes of observed patterns. AI accelerates root cause analysis by testing thousands of hypotheses simultaneously, identifying correlations that explain variance in outcomes.
Correlation analysis quantifies relationships between variables. Feature importance scoring ranks which factors most influence outcomes. Causal inference techniques distinguish correlation from causation using statistical methods like propensity score matching or instrumental variables.
Manufacturing example: When production defect rates spike, AI diagnostic systems analyze sensor data, material batches, operator schedules, and environmental conditions. The system identifies that defects correlate with specific material supplier batches and particular temperature ranges, providing actionable root causes rather than just reporting the defect rate increase.
3. Predictive Analytics: "What Will Happen?"
Predictive analytics uses statistical algorithms and machine learning to forecast future outcomes based on historical data. Models analyze patterns in past data to predict customer behavior, revenue trends, equipment failures, and other future events with quantified confidence intervals.
Time series forecasting predicts sequential data points like sales, inventory, or web traffic. Regression models estimate continuous outcomes. Classification algorithms predict categorical events like churn, conversion, or fraud.
Modern predictive analytics dashboards incorporate confidence intervals and scenario analysis. Rather than single-point forecasts, AI systems provide probability distributions showing range of likely outcomes and their associated probabilities.
Financial services example: Credit risk models predict loan default probability using hundreds of variables, credit history, employment stability, debt-to-income ratio, payment patterns. The system provides not just binary approve/reject decisions but probability scores enabling nuanced lending decisions with appropriate interest rate pricing for risk levels.
4. Prescriptive Analytics: "What Should We Do?"
Prescriptive analytics recommends optimal actions based on predictive models and business constraints. Optimization algorithms evaluate thousands of potential decisions to identify strategies maximizing desired outcomes.
Linear programming, integer programming, and constraint satisfaction techniques find optimal solutions given multiple objectives and limitations. Reinforcement learning systems discover effective strategies through trial and error in simulated environments.
Logistics example: Route optimization systems analyze delivery locations, vehicle capacities, traffic patterns, delivery windows, driver schedules, and fuel costs. The AI prescribes optimal routes that minimize total delivery time and costs while meeting all customer time window requirements, a problem with billions of potential solutions that would be impossible to solve manually.
5. Conversational Analytics: Natural Language Interfaces
Conversational analytics enables users to query data using natural language rather than SQL or BI tools. Large language models (LLMs) translate questions into database queries, execute analysis, and explain results in plain language.
Modern conversational analytics goes beyond simple question-answering. Multi-turn conversations maintain context across queries. The system asks clarifying questions when user intent is ambiguous. Follow-up analysis builds on previous answers without requiring users to repeat context.
Google Cloud (2026) reports that their conversational analytics agents are widely deployed in production, enabling business users to ask complex questions like "Why did revenue decrease in Q3?" and receive automatically generated analyses with visualizations.
Sales operations example: A sales manager asks "Show me deals at risk of churning." The system identifies high-value customers with declining engagement metrics, then proactively suggests "Would you like to see recommended retention actions for these accounts?" The conversation continues with natural back-and-forth without requiring the manager to write SQL queries or work through BI dashboards.
6. Agentic Analytics: Autonomous Multi-Step Analysis
Agentic analytics represents the frontier of AI capabilities, autonomous systems that conduct multi-step investigations without human guidance. Unlike conversational analytics that respond to explicit questions, agentic systems proactively identify issues, investigate root causes, and propose solutions.
Planning and reasoning capabilities allow AI agents to decompose complex analytical tasks into sequences of sub-tasks. Tool use enables agents to query databases, run statistical tests, generate visualizations, and access external APIs. Memory systems maintain context across extended investigations spanning hours or days.
OpenAI research (2026) demonstrates agents solving complex problems requiring coordinated use of multiple tools and multi-step reasoning chains. These systems represent qualitative advances beyond previous AI analytics approaches.
Supply chain example: An agentic analytics system monitoring inventory notices unusual stockout patterns in specific regions. Without human prompting, the agent investigates supplier delivery times, analyzes demand forecasts, checks weather patterns affecting logistics, and identifies that a regional supplier is experiencing production delays. The agent proactively alerts procurement teams with specific recommendations for alternative suppliers and expedited shipping options.
7. Embedded AI Analytics: Customer-Facing Applications
Embedded AI analytics delivers AI-powered insights within B2B SaaS products, enabling companies to offer predictive features and conversational interfaces to their customers. This represents the intersection of AI analytics and product development.
The technical challenge extends beyond model development to infrastructure: multi-tenant architecture isolating customer data, real-time dashboard delivery, white-label customization, secure API access, and usage-based pricing. Most B2B SaaS companies use embedded analytics platform infrastructure to handle these requirements while focusing ML teams on proprietary model development.
HR Tech example: An HR platform embeds AI analytics predicting employee flight risk. The system analyzes engagement surveys, promotion history, peer departures, and external job market data. HR managers at customer companies receive personalized retention recommendations through branded dashboards embedded in the HR platform, with all analysis running on the customer's isolated tenant.
AI Analytics Use Cases Vary by Industry Because the Challenges Do
AI analytics applications vary significantly across industries, with specific use cases addressing sector-specific challenges. The following examples illustrate production deployments rather than theoretical possibilities.
Healthcare: Clinical Decision Support
Healthcare AI analytics focuses on improving patient outcomes and operational efficiency. Predictive models identify high-risk patients requiring intervention. Diagnostic assistance tools help clinicians interpret medical imaging and lab results. Resource optimization algorithms improve bed utilization and staffing schedules.
Johns Hopkins research (2026) demonstrates AI systems predicting sepsis onset 6-12 hours before traditional recognition, enabling earlier treatment that significantly improves survival rates. These systems analyze vital signs, lab results, and patient history in real-time.
Implementation requires careful attention to regulatory compliance (HIPAA, GDPR), model interpretability for clinical acceptance, and integration with existing electronic health record systems. For organizations building healthcare dashboard solutions, embedding AI predictions alongside traditional clinical metrics requires specialized infrastructure.
Financial Services: Fraud Detection and Risk Management

Financial AI analytics addresses fraud detection, credit risk assessment, algorithmic trading, and regulatory compliance. Real-time transaction monitoring identifies fraudulent patterns. Credit scoring models predict default probability. Market prediction algorithms inform trading strategies.
What separates these models from rule-based systems is the breadth of signal they read: transaction patterns, device fingerprints, behavioral biometrics, and network relationships between accounts. No accuracy figure is quoted here. The numbers that circulate for this comparison trace back to press and vendor summaries rather than a published benchmark, and JPMorgan's own AI research page carries none of them (checked 6 August 2026).
Financial dashboard implementations must balance model sophistication with explainability requirements for regulatory review. Real-time inference at scale handles millions of transactions per hour while maintaining sub-100ms latency requirements.
Retail: Demand Forecasting and Personalization
Retail AI analytics optimizes inventory, personalizes recommendations, and predicts customer behavior. Demand forecasting models reduce stockouts while minimizing excess inventory. Recommendation engines increase average order value. Customer lifetime value predictions inform marketing spend allocation.
Amazon research (2026) demonstrates AI-driven inventory optimization reducing carrying costs by 20-30% while improving in-stock rates. The systems integrate point-of-sale data, weather forecasts, promotional calendars, and competitor pricing.
For companies building retail dashboard products, embedding demand forecasts and inventory recommendations requires handling massive SKU counts and real-time data synchronization across distributed store networks.
Manufacturing: Predictive Maintenance and Quality Control
Manufacturing AI analytics prevents equipment failures, optimizes production schedules, and detects quality defects. Predictive maintenance models forecast equipment failures before they occur. Computer vision systems identify product defects. Production optimization algorithms maximize throughput while minimizing energy consumption.
Siemens publishes a figure for this and credits it to McKinsey rather than to its own measurement: predictive maintenance typically reduces machine downtime by 30 to 50 percent and increases machine life by 20 to 40 percent (checked 6 August 2026). Read it as a category-level range rather than a number your plant will reproduce. The models analyze vibration sensors, temperature readings, and operational logs to predict failures days or weeks in advance.
Manufacturing dashboard implementations often require edge AI deployment for real-time inference at machine locations, with results aggregated to central analytics platforms.
Marketing: Attribution and Customer Journey Analysis
Marketing AI analytics attributes conversions across touchpoints, predicts campaign performance, and optimizes spend allocation. Multi-touch attribution models assign credit to marketing channels. Uplift modeling predicts which customers will respond to campaigns. Budget optimization algorithms allocate spend across channels to maximize ROI.
Meta research (2026) demonstrates AI attribution systems improving marketing ROI by 15-25% compared to last-touch attribution. The models use Shapley values and causal inference techniques to account for interaction effects between channels.
Companies offering marketing dashboard solutions must handle integration with dozens of marketing platforms (Google Ads, Facebook, email providers) while providing unified cross-channel attribution.
AI Analytics Infrastructure Spans Training, Inference, Pipelines, and Visualization

Successfully implementing AI analytics requires infrastructure addressing model training, inference serving, data pipelines, visualization, and (for embedded use cases) multi-tenant architecture. The requirements differ significantly between internal BI and customer-facing scenarios.
Data Warehouses Provide the Foundation, and Increasingly the Model Training Too
Modern data warehouses (Snowflake, BigQuery, Databricks) provide the foundation for AI analytics. These platforms handle petabyte-scale data storage, SQL query processing, and increasingly, ML model training and inference.
Real-time data pipelines using Kafka, Flink, or cloud-native streaming services enable low-latency analytics. Feature stores (Tecton, Feast) manage feature engineering, ensuring consistency between training and inference environments.
Vector databases (Pinecone, Weaviate) support similarity search and retrieval-augmented generation for LLM applications. Graph databases (Neo4j) enable network analysis and relationship discovery.
Model Training Platforms Run the Experiments, and MLOps Tools Track Them
Model training platforms (SageMaker, Vertex AI, Azure ML) provide managed environments for experimentation and production training. MLOps tools (MLflow, Weights & Biases) track experiments, manage model versions, and monitor production performance.
Model serving infrastructure handles inference requests at scale. Options range from managed endpoints (SageMaker, Vertex AI) to custom Kubernetes deployments. Real-time serving requires sub-100ms latency for customer-facing applications. Batch inference suffices for internal reporting.
Model monitoring detects data drift, prediction drift, and performance degradation. Automated retraining pipelines update models as distributions shift over time.
Traditional BI Tools Add AI Features but Struggle With Custom Models and Embedding
Traditional BI tools (Tableau, Power BI, Looker) increasingly incorporate AI features but struggle with custom ML models and embedded scenarios. The gap between "AI analytics" as marketing buzzword versus production-grade embedded implementations is vast.
For companies embedding AI into customer-facing products, requirements include:
The architecture must isolate every customer's data through row-level security and tenant-specific model serving. Branding must extend to dashboards, custom domains, and configurable themes, which are capabilities addressed by white label analytics platforms.
Product integration requires an API-first analytics architecture, React/Vue/Angular SDK integration, and programmatic dashboard configuration. Real-time products add streaming ingestion, low-latency inference, and live dashboard updates to that surface.
The platform must also scale across the expected customer and request volume without weakening its compliance controls. That means automatic scaling alongside encryption at rest and in transit, audit logging, relevant certifications such as SOC 2, and GDPR controls where they apply.
The challenge most organizations face is the "build vs buy vs infrastructure" decision. Building all components in-house takes 24-36 months with teams of 8-15 people. Buying complete platforms with built-in AI provides generic models but lacks differentiation. Using infrastructure platforms for visualization while building proprietary ML models balances speed and competitive advantage.
Proper multi-tenancy architecture is particularly critical for B2B SaaS companies. Each customer's data must be isolated, models must serve predictions specific to that customer's data, and dashboards must be customized to that customer's branding, all while maintaining performance at scale.
Three Routes to AI Analytics: Build It, Buy It, or Use Infrastructure
Organizations face three primary approaches for implementing AI analytics: build, buy, or use infrastructure. The optimal strategy depends on competitive positioning, internal capabilities, and use case requirements.
Option 1: Building AI Analytics In-House
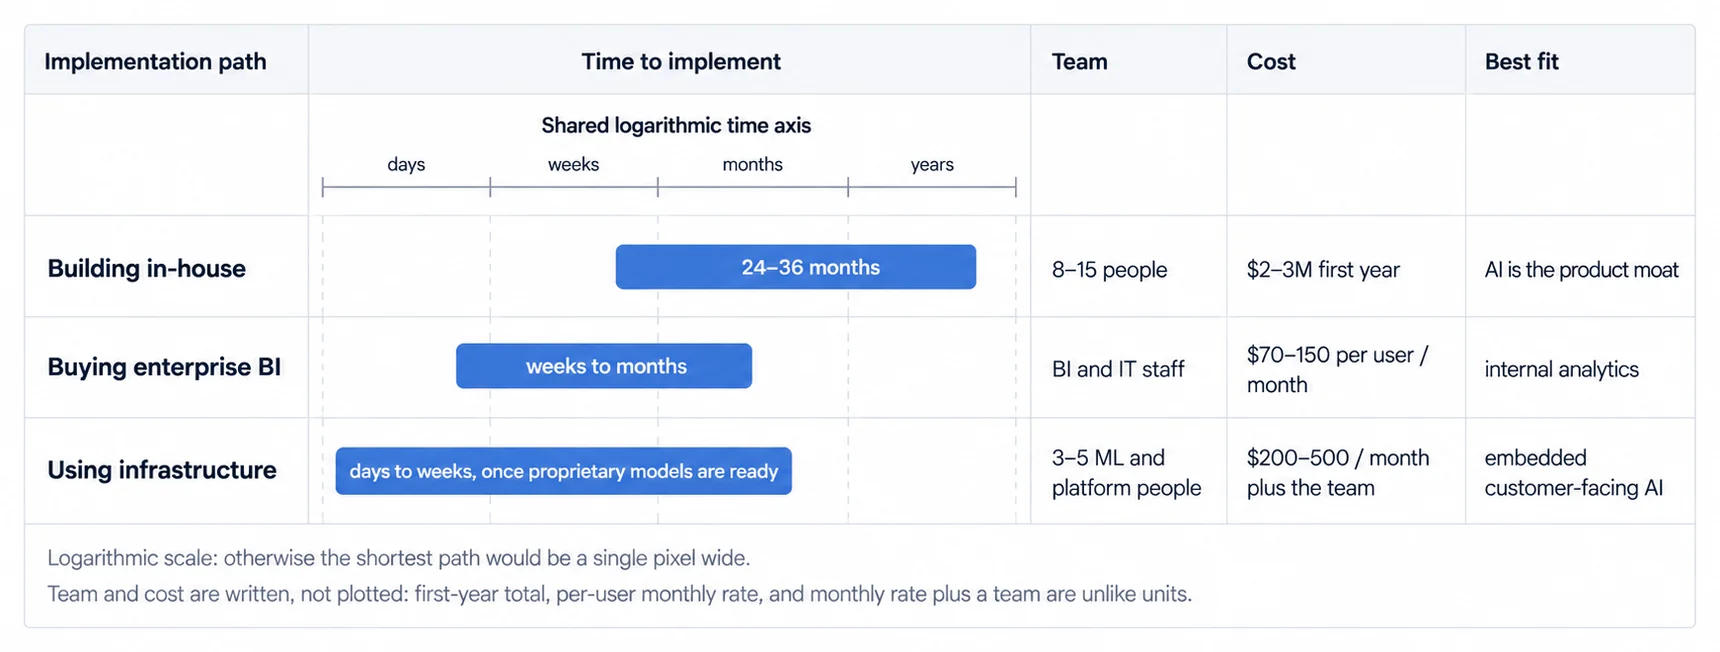
Building provides maximum control and differentiation but requires significant investment. Full-stack development includes data pipelines, feature engineering, model training, inference serving, monitoring, visualization, and (for embedded cases) multi-tenant architecture.
For planning purposes, a production-grade in-house system can run 24-36 months and require an 8-15 person team spanning data, ML, backend, frontend, and DevOps. At the staffing and infrastructure assumptions used in this guide, the first-year cost case is $2-3M. This route best fits companies where AI analytics is the competitive differentiator, such as analytics platforms, vertical SaaS products with unique datasets, or algorithmic trading firms.
The build approach makes sense when your AI capabilities create defensible moats. If competitors could buy similar AI features from enterprise BI vendors, building in-house won't provide sustainable advantage.
Option 2: Buying Enterprise BI Platforms
Enterprise BI platforms (Tableau Pulse, ThoughtSpot Spotter, Power BI Copilot) now incorporate AI features. These provide out-of-box natural language query, anomaly detection, and automated insights without requiring data science teams.
Enterprise BI deployment usually takes weeks to months and can be operated by BI analysts and IT staff without a dedicated data-science team. The commercial model is commonly per-user licensing; the planning range used here is $70-150 per user per month. This route best fits internal BI, standard analytics requirements, and organizations without ML teams.
Limitations include generic AI models (not trained on your proprietary data), limited customization, vendor lock-in, and poor support for customer-facing embedded scenarios. These platforms optimize for internal analyst productivity, not product embedding.
Option 3: Using Infrastructure Platforms
Infrastructure platforms provide visualization and embedding capabilities while you build proprietary ML models. This approach balances speed (use existing infrastructure) with differentiation (custom models on your data).
The platform handles multi-tenant architecture, white-label customization, SDK/API access, real-time pipelines, and dashboard delivery. Your ML team focuses on models, feature engineering, and predictive algorithms, the components creating competitive advantage.
Once the models are ready, an infrastructure platform can reduce embedding work to days or weeks. The operating model is a focused ML team of roughly 3-5 people plus the platform; the planning case used here combines $200-500 per month in platform fees with that team's salaries. This route best fits B2B SaaS companies embedding AI into products and data-science teams that want to focus on models rather than dashboard infrastructure.
This approach acknowledges that while AI models create differentiation, dashboard infrastructure does not. Similar to how companies use SendGrid for email rather than building SMTP servers, infrastructure platforms handle undifferentiated heavy lifting.
For context on infrastructure decisions, reviewing build vs buy embedded analytics considerations provides frameworks for evaluating when each approach makes sense.
No Route Is Right in General, So the Decision Comes From Your Own Context
The optimal implementation strategy depends on specific organizational context. Consider these factors when deciding between build, buy, and infrastructure approaches.
For Internal BI Teams
Organizations using AI analytics internally for operations, business reporting, and analyst workflows should generally buy enterprise platforms rather than build. Internal use cases rarely justify custom development unless analytics is your core business.
Platforms like Tableau Pulse, ThoughtSpot Spotter, and Power BI Copilot provide sufficient AI capabilities for most internal needs. Focus internal teams on business logic, data quality, and user adoption rather than infrastructure.
Exception: If your organization requires highly specialized models on proprietary data (quantitative trading, specialized scientific research), building may be justified. But most internal BI scenarios benefit more from faster deployment and lower maintenance of commercial platforms.
For organizations wanting to empower business users, understanding self-service analytics capabilities helps identify which platform features enable non-technical users to explore data effectively.
For Companies Without ML Teams
Organizations wanting AI analytics but lacking ML expertise have options. Understanding augmented analytics capabilities can help identify platforms that provide AI features without requiring data science teams.
Enterprise BI with built-in AI like Tableau Pulse, ThoughtSpot Spotter, AI features out-of-box without requiring data science team.
Managed AI platforms with industry-specific models, vertical SaaS providing pre-built AI for specific sectors.
AI consultancies offering custom model development and implementation services.
Trade-off: Less control and differentiation, but no need to hire scarce ML talent. Best for standard use cases, internal BI scenarios, faster time-to-value priority.
For Hybrid Requirements
Organizations needing both internal BI with AI AND customer-facing embedded analytics face complex decisions:
Unified data platform supporting both use cases. Consistent AI models across internal and external. Separate governance for internal vs external access. Different UX requirements (analysts want depth, customers want simplicity). Pricing that scales for both scenarios.
For exploring the full landscape, review dashboard types to understand which visualization approaches suit different user needs, and explore chart types for guidance on AI output visualization.
May require multi-vendor approach or carefully evaluate platforms supporting both (rare, most specialize in one or the other).
When selecting your platform, consider the full spectrum of options: an embedded analytics platform for product integration, a customer-facing analytics product for external user experiences, or an embedded dashboard solution for visualization-focused use cases.
Ready to launch customer-facing analytics?
Stop losing customers to competitors with better analytics. Sumboard's customer-facing analytics platform lets you launch self-service dashboards in days, not months.