

What Augmented Analytics Means in a Verified BI Workflow
Augmented analytics uses AI methods to assist decisions in a BI workflow, but it does not reduce the responsibility for choosing what counts as a reliable conclusion. A useful view is to think in terms of where automation is applied: data prep, recommendation, and explanation are assisted, while interpretation and release boundaries stay explicit.
This page is a guardrail for those boundaries.
Where Augmented Analytics Fits in the Insight Workflow
Augmented analytics typically contributes to three parts of the same lifecycle:
- Question definition: narrowing what decision the team is making now.
- Discovery and drafting: proposing patterns, anomalies, and narrative drafts from source data.
- Verification and packaging: checking assumptions, confidence, and action risk before release.
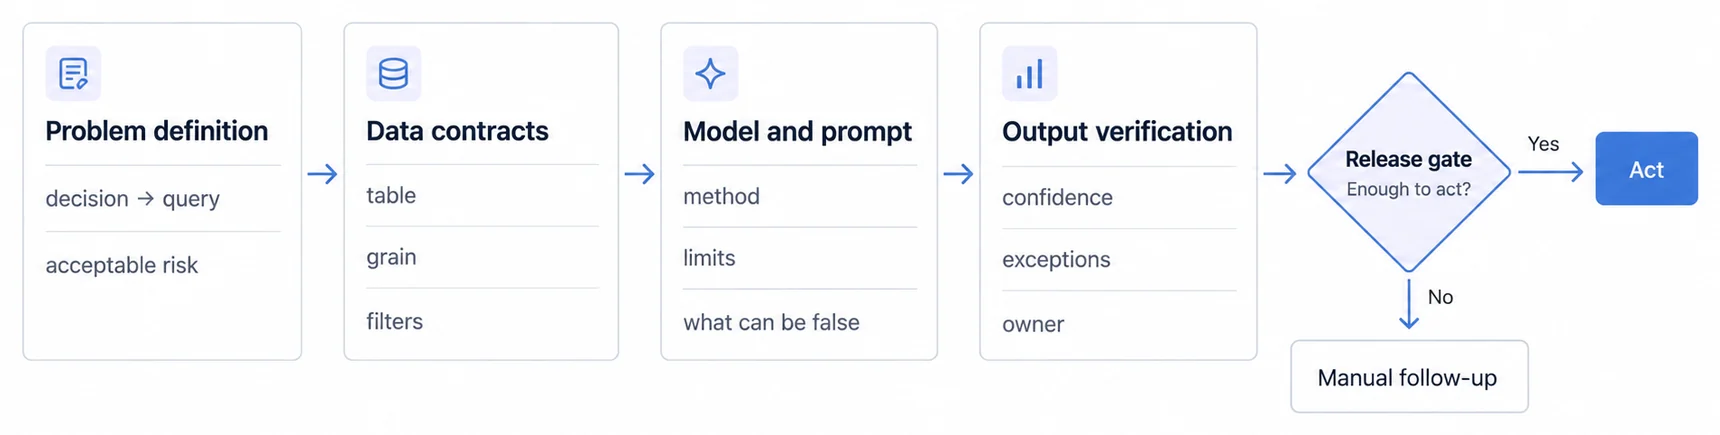
Machine Learning, NLP, and Automation Are Helpers, Not One Brain
The section in many guides that says "ML, NLP, and automation" is still valid when read as tool categories, not as promises.
- Machine learning is strongest when it can test many transformations consistently.
- Natural language interfaces are strongest when they lower the cost of asking the right question.
- Automation is strongest when it removes repeated mechanical steps.
A useful rule is: these are not substitutes for judgment, they are accelerators for a defined question.
The Value Comes From the Missing Pieces
A lot of teams describe value as speed alone. In practice, the value often comes from consistency in three places:
- Repetition cost drops. Analysts spend less time cleaning and rerunning the same query path.
- Coverage gets broader. Teams see patterns they might not search for manually.
- Explanations become more repeatable. Different analysts can apply the same framing and receive similar draft language.
Each one is real, but each one is conditional on setup quality.
Silent Drift Is the Biggest Risk, So the Evidence Packet Ships Before the Output Does
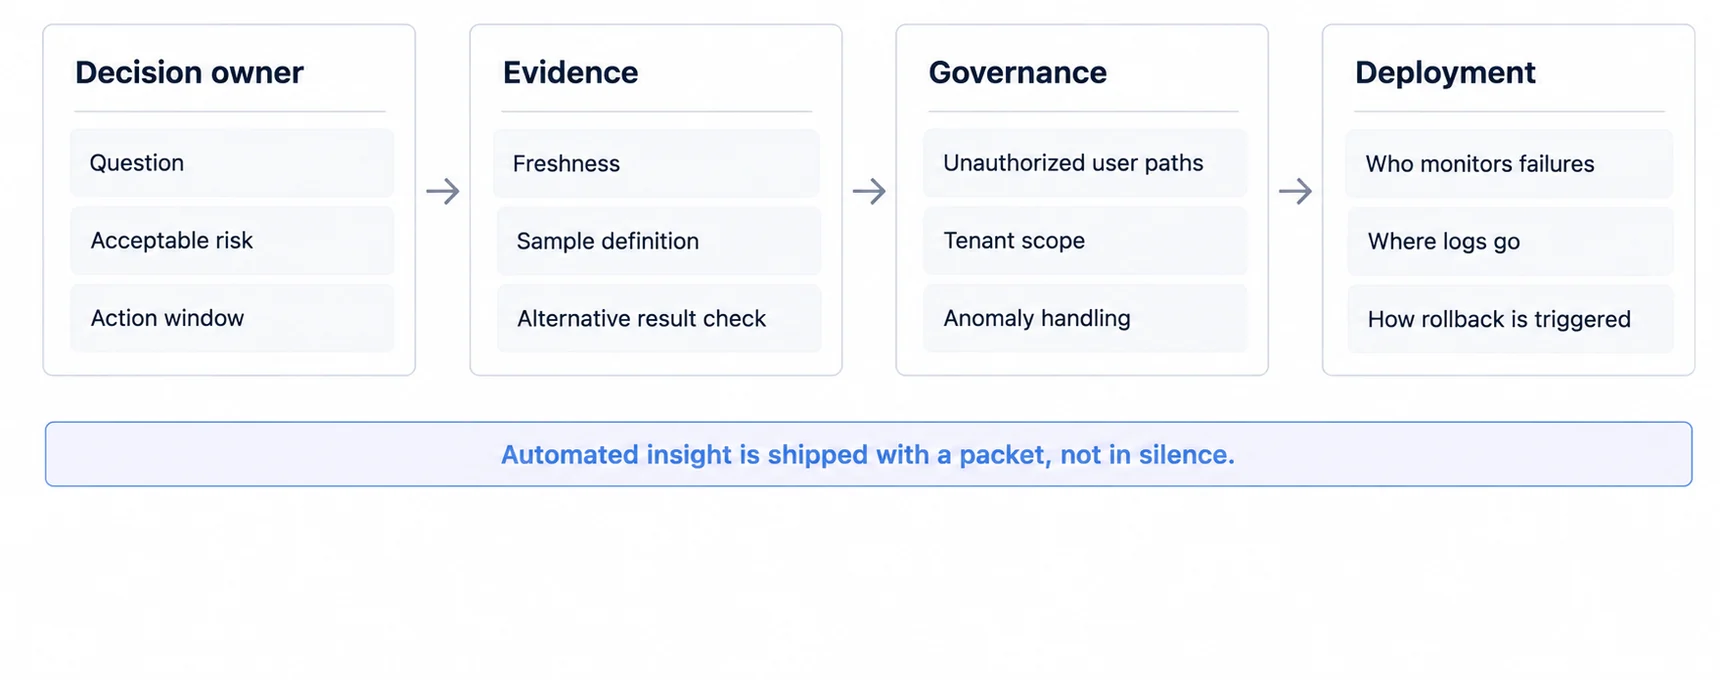
When output is used in customer-facing analytics, the biggest risk is silent drift. We prefer a packet-first approach.
- Decision owner names the intended action and acceptable uncertainty.
- Evidence states freshness, sample scope, and fallback behavior.
- Trust checks make access, tenancy, and redaction explicit.
- Monitoring checks define what triggers rollback and who is on call.
Five Features Carry This Label, and Each One Has the Same Question to Answer
Vendor pages use a single label for a handful of separable features. Naming them makes an evaluation concrete instead of atmospheric.
- Automated data preparation proposes joins, types, and cleaning steps. Ask what it does when it is unsure.
- Anomaly and trend detection flags a movement as unusual. Ask against which baseline, and how it behaves during your own quiet weeks.
- Natural language query turns a question into a query. Ask what happens to an ambiguous question and whether the compiled query is visible before it runs. The natural language query analytics guide works through that interpretation step.
- Generated narrative writes a sentence over a chart. Ask whether it states its comparison baseline, and whether it is able to decline.
- Recommended next view suggests where to look next. Ask whether it can ever suggest a view the viewer is not permitted to open.
All five reduce to the same underlying question, which is what the feature does when it does not know.
Augmented Is Not Agentic, and the Difference Is Who Acts
Augmented analytics assists a person who is already asking. An agentic system watches without being asked and proposes or takes an action on its own. That difference decides the review model: an assistant's mistake is caught by the person reading it, while an unattended system's mistake is caught only by whatever monitoring was built for it. Agentic analytics covers that shift and where it is actually being deployed.
Traditional BI and Augmented Analytics Solve Different Bottlenecks
The relationship is more useful when viewed as non-exclusive.
- Traditional BI solves repeated internal reporting and governed analysis patterns.
- Augmented analytics helps teams move from static reporting to faster iteration on next action.
- Both need disciplined data contracts and ownership.
The strongest pattern is to design a product process where both can coexist and share the same contract language.
Placement Is Not Trust, and Responsibility for the Output Stays With Your Decision Process
In embedded contexts, this boundary is often where teams get into trouble. The chart and UI can be inside your product, but responsibility for the output still follows your decision process.
- Do not confuse placement with trust. A chart embedded in your product does not guarantee it is correct for that user at that moment.
- Do not confuse automation with authority. Automated outputs should be reviewed against your own risk model.
- Do not skip the fallback for exception cases. If a result is outside your confidence envelope, the output should state that.
Use Cases With Failure Modes
Good use cases are strongest when they match a clear question:
- Support and product operations: why demand changed this week, and what exception case is most likely.
- Finance and billing teams: identifying unusual patterns, then checking them against policy and period boundaries.
- SaaS operations: spotting cohort shifts while preserving customer-level privacy rules.
Each case is a candidate for a pilot with a hard stop if the failure check does not meet your bar.
How We Use This in Product Decisions
For teams building analytics products, the practical sequence is this:
- Define a strict question.
- Define the acceptable exception case.
- Define the evidence packet.
- Run a small pilot with real users.
- Expand only where the packet is reliable.
If the sequence breaks at any step, the output does not move to the next phase.
Related Augmented Analytics Concepts and Analytics Foundations
-
AI analytics guide: the seven categories of AI analytics and the different question each one answers.
-
Two jobs behind one self-service name, for the structured-access half
-
Seven categories of AI analytics, seven different questions, which separates what these tools actually do
-
From a question to a governed answer, where automated analysis meets a definition it must respect
-
Sumboard's embedded analytics product, where trust and contract design become production critical
Experience Reliable AI-Assisted Analytics
See how we design augmented analytics as an assistive workflow with visible evidence and human release control.