

Data analytics is the process of examining, cleaning, transforming, and modeling raw data to extract meaningful patterns, insights, and trends that drive informed business decisions.
What Data Analytics Means for Business Decisions
Data analytics transforms raw data into actionable intelligence by examining, cleaning, and modeling information to discover useful patterns, draw conclusions, and support decision-making. For B2B SaaS companies, embedded analytics platforms make data analytics capabilities accessible directly within applications.
At its core, data analytics answers critical business questions: What's happening in operations? Why are certain outcomes occurring? What's likely to happen next? What actions should we take? Organizations use analytics to understand performance, identify opportunities, and make evidence-based decisions.
Modern analytics increasingly incorporates automated insights, machine learning, and real-time processing. B2B SaaS products embed analytics directly into user interfaces, what embedded analytics means in practice is delivering these capabilities as native product features, enabling customers to analyze data without exporting to external tools. This approach transforms analytics from a back-office function into a customer-facing product feature.
The evolution from manual reporting to automated, embedded analytics reflects growing expectations for data-driven decision-making at every organizational level. Users now expect immediate access to insights within their workflows, not separate reporting tools.
The Four Types of Data Analytics
Industry-standard analytics frameworks recognize four distinct types, each serving different business needs:
1. Descriptive Analytics: "What Happened?"
Descriptive analytics examines historical data to understand past performance and trends through KPI dashboards, summary reports, and trend analysis. This includes tracking metrics over time, identifying patterns in customer behavior, and generating operational reports. See KPI dashboard examples for how these are structured in practice.
Example: A SaaS company reviewing last quarter's user engagement metrics to understand feature adoption rates using self-service analytics dashboards.
2. Diagnostic Analytics: "Why Did It Happen?"
Diagnostic analytics investigates root causes and correlations behind observed patterns. It digs deeper than descriptive analytics to understand why sales dropped in a specific region, which factors contributed to customer churn, or how marketing spend correlates with conversions.
Example: Analyzing why free trial conversion rates declined by examining user behavior patterns, onboarding completion rates, and feature usage data through operational dashboards.
3. Predictive Analytics: "What Will Happen?"
Predictive analytics uses historical data, statistical algorithms, and machine learning to forecast future outcomes. Organizations forecast revenue and demand, predict customer churn risk, estimate future resource needs, and anticipate market trends.
Example: Using machine learning models to predict which trial users are most likely to convert to paid accounts based on their engagement patterns. Learn more about AI-powered analytics approaches and see our complete AI analytics guide for the full picture.
4. Prescriptive Analytics: "What Should We Do?"
Prescriptive analytics recommends specific actions by analyzing data alongside business rules and constraints. It optimizes pricing strategies, recommends next-best actions for sales teams, automates resource allocation decisions, and suggests product improvements based on usage patterns.
Example: An embedded analytics platform recommending which dashboard features to prioritize based on user behavior data and business impact projections.
Data Analytics Capabilities That Turn Raw Data Into Decisions
What defines modern data analytics:
- Multi-Source Integration: Connects data from databases, APIs, cloud storage, and real-time streams to create unified analytics
- Automated Processing: Handles data cleaning, transformation, and preparation automatically without manual intervention
- Visual Insights: Transforms complex data into intuitive visualizations through charts, dashboards, and interactive reports. See data visualization best practices for implementation guidance
- Real-Time Analysis: Processes streaming data for immediate insights rather than batch reporting
- Self-Service Access: Enables non-technical users to explore data and generate insights independently through the self-service tools whose choosing is the smaller half of the job
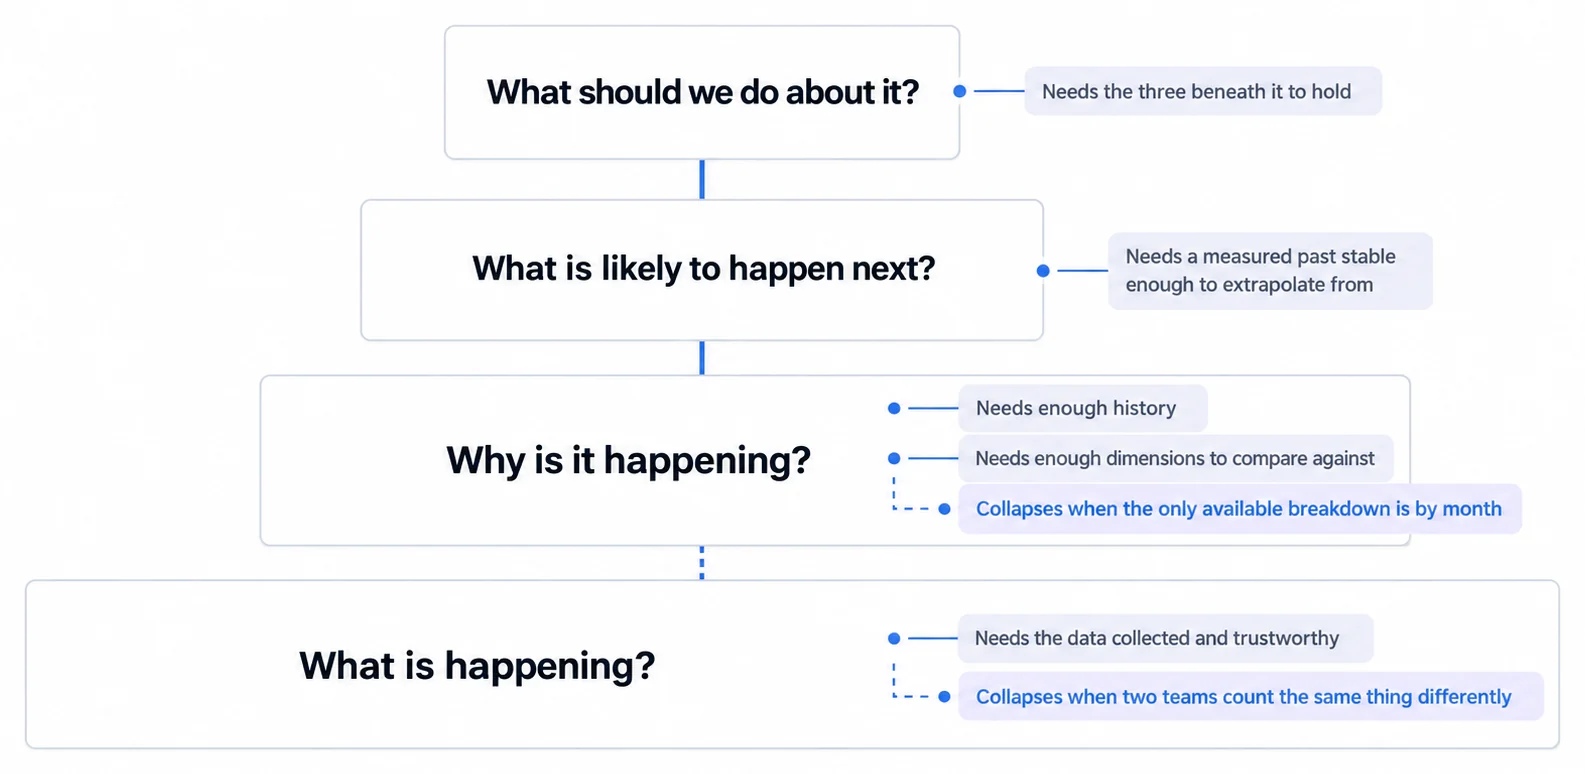
The Four Types Are a Ladder, and Skipping a Rung Is the Common Mistake
The categories are usually presented as options. In practice they depend on each other, and each one inherits every weakness below it.
Diagnostic work needs descriptive numbers that are trusted, because explaining a change nobody agrees happened is wasted effort. Predictive work needs both, since a model trained on a metric whose definition shifted midway learns the shift. Prescriptive work needs all three plus something the others do not require, which is a decision someone is actually willing to hand over.
The pattern worth avoiding is a team investing in prediction while its descriptive layer is still disputed. The forecast will be defensible in isolation and rejected in the meeting, because the argument reopens at the definition rather than at the model.
Analytics, Analysis and Reporting Are Not Interchangeable
The three words get used as synonyms and describe different work, which matters when scoping a request.
Reporting delivers agreed numbers on a schedule to people who already know what they mean. Analysis is a person investigating a specific question, with a beginning and an end. Analytics is the standing capability underneath both: the definitions, the pipelines, the access model, and the surfaces that let reporting and analysis happen without rebuilding the foundation each time.
A request for "analytics" is often a request for one report or one analysis. Establishing which it is changes the estimate by an order of magnitude, and asking is cheaper than discovering.
Related Data Analytics Concepts and Analytics Guides
- Chart types guide: more than forty charts grouped by the question each one answers.
- Customer-facing and internal analytics run on different clocks, which decides more than the tooling does
- What data visualization practice actually holds up, and which habits do not
- Embedded analytics guide, covering the three routes and what each costs in calendar time
- KPI dashboard examples, worked through by team and use case
Embed data analytics in your product
Deliver customer-facing analytics dashboards in days, not months with Sumboard's embedded analytics platform