

Business intelligence (BI) is the technology-driven process of collecting, analyzing, and transforming organizational data into actionable insights that inform strategic business decisions. BI combines data management tools, analytics software, and visualization platforms to help organizations understand past performance, identify patterns, and make data-driven decisions.
What Business Intelligence Means for Modern Data Teams
Business intelligence works through a systematic workflow: data is collected from multiple sources (databases, APIs, applications), transformed and stored in data warehouses or lakes, analyzed using query tools and statistical methods, then visualized through dashboards and reports. The goal is to convert raw data into meaningful insights that non-technical stakeholders can understand and act upon.
For B2B SaaS companies, BI has evolved beyond internal analysis. Modern BI increasingly focuses on customer-facing analytics, embedding dashboards directly into products so end-users can analyze their own data. This shift from internal BI tools to embedded analytics platforms is where traditional BI and embedded BI diverge, democratizing data access while maintaining security and scalability. Teams weighing their options will find the BI tools comparison hub and embedded analytics alternatives guide helpful for mapping the market, while the build vs. buy framework clarifies the make-or-buy decision.
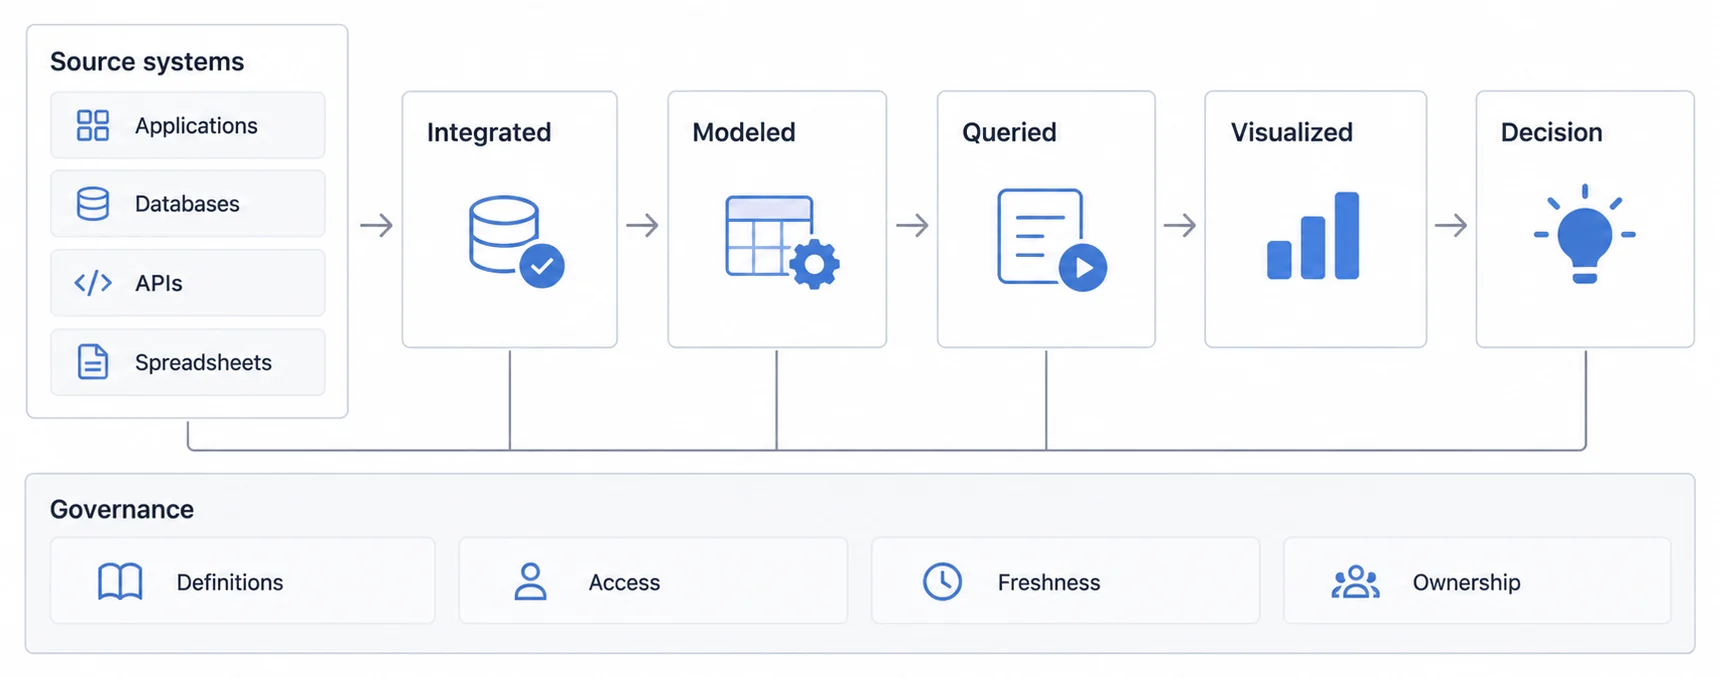
Five Capabilities Define Modern Business Intelligence, Starting With Data Integration
What defines modern business intelligence:
- Data Integration: Aggregates information from multiple sources (databases, CRMs, ERPs, APIs) into unified datasets for complete analysis.
- Self-Service Analytics: Enables non-technical users to explore data, create reports, and generate insights without requiring SQL knowledge or IT support.
- Visual Reporting: Transforms complex datasets into intuitive dashboards, charts, and interactive visualizations that communicate insights clearly.
- Real-Time Analysis: Provides up-to-date insights through live data connections and automated refresh cycles, enabling timely decision-making.
- Predictive Capabilities: Uses historical data patterns to forecast trends, identify opportunities, and anticipate business challenges before they occur.
Business Intelligence and Data Analytics Answer Different Questions About the Same Data
The two terms get used interchangeably and describe different work. Business intelligence is oriented at what happened and whether the operating decision in front of someone has a trusted number behind it: defined metrics, governed sources, and a reporting surface people agree on. Data analytics extends past that into why it happened and what is likely next, which brings statistical method and modelling with it. A team can run BI without predictive work, and analytical work without a governed reporting layer, which is exactly how organisations end up holding two numbers for the same thing.
A BI Stack Is Four Layers, and Most of the Cost Sits Below the Dashboard
Sources come first: databases, CRMs, ERPs, event streams, and third-party APIs, each with its own freshness and reliability. A storage and modelling layer lands and shapes that data. A semantic layer holds the metric definitions so several surfaces can read one version of them. Only then comes the presentation surface, which is the layer everyone evaluates in a demo and the smallest part of the build. A platform decision made on the top layer alone tends to be revisited once the three underneath it are real.
Business Intelligence Fails on Definitions Long Before It Fails on Tools
The failure that repeats is not a missing feature. It is two teams holding two definitions of the same metric, both able to defend theirs, which turns every review into a reconciliation meeting. A definition is a product artefact: it names the source, the filter, the time grain, and the person who owns it. self-service, which is two jobs behind one name widens who can ask questions and raises the cost of leaving those definitions implicit, while one metrics layer behind any front end exists largely to hold one definition in one place while several surfaces read it. Choosing a platform before the definitions are settled buys a faster route to disagreeing.
Customer-Facing BI Changes the Acceptance Criteria, Not Just the Audience
When the reader is a customer rather than a colleague, the same dashboard picks up requirements an internal one never had: a tenant boundary enforced in the query layer, branding across every state a user can reach, performance under concurrency you do not control, and error copy someone outside your company will read. Analytics built for a customer to read covers the contracts that shift, and it is why an internal BI deployment rarely converts into a customer-facing one by configuration alone.
Choosing a BI Platform Starts With Who Reads the Output, Not With the Feature Grid
Feature grids compare well and predict badly, because two deployments with an identical checklist can differ entirely in who opens the result. An internal analyst team with SQL fluency and a governance owner needs something different from a product team shipping the same numbers to customers who never log into an analytics tool at all. Reader first, then the decision, then the categories that survive: that order eliminates most of the market before anyone compares rows, and it is also the order in which a deployment tends to fail when it is reversed.
Data Freshness Is a Promise, and Most BI Disputes Start There
When a number is disputed it is often not wrong but old, and the argument that follows is really about an unstated promise. Freshness has three parts worth writing down: the grain the data is collected at, the lag between an event and its appearance, and a visible timestamp so a reader can tell the difference between a quiet metric and a stalled pipeline. Agreeing those three converts a recurring argument into a monitorable condition.
Related Business Intelligence Concepts and Comparisons
- BI tools comparison guide: which platforms survive being embedded, judged on the embedding rather than the connector list.
- How embedded BI differs from traditional BI, and which one your customers are actually asking for
- Why a self-service platform does not remove the work, only moves who does it
- Choosing a dashboard type by how fast the reader must act, before choosing a layout
- Which BI tool survives being embedded, judged on the embedding rather than the connector list
- BI Tools Comparison, side-by-side breakdown of leading platforms
- Open-Source BI Tools, free and open-source alternatives
Ready to launch customer-facing analytics?
Stop losing customers to competitors with better analytics. Sumboard's customer-facing analytics platform lets you launch self-service dashboards in days, not months.