Traditional BI tools tightly couple data processing with presentation layers, creating inflexibility for modern use cases. Headless BI separates the backend (data modeling, metrics, APIs) from the frontend (UI components, visualizations), enabling programmatic control and flexible presentation.
This guide covers headless BI for both internal analytics and embedded analytics customer-facing analytics, with emphasis on the latter, a major gap in current market coverage. Headless BI enables use cases that traditional BI tools cannot support: fully branded customer analytics, multi-tenant SaaS architectures, and native-feeling embedded experiences.
Headless BI Separates the Metrics Backend From the Presentation Layer
Headless BI architecture separates the data and logic layer from the presentation layer. The backend handles semantic layers, metrics definitions, query engines, and caching. The frontend consumes data via APIs or SDKs using any UI technology.
Think of headless CMS as an analogy. Just as headless CMS separates content management from presentation, headless BI separates analytics logic from visualization. The backend exposes data through APIs and SDKs. The frontend renders it however needed.
Traditional BI tools like Tableau, Power BI, and Looker integrate data layers tightly with visualization. You cannot separate components. Customization is limited. You face vendor lock-in to their UI.
Traditional BI Couples the Query Engine to Its Own UI, and Headless BI Does Not
Traditional BI uses monolithic stacks where data layer, semantic layer, query engine, caching, and UI are tightly coupled. This creates several problems: limited UI customization, inability to serve multiple frontends, difficulty embedding in external applications, and no programmatic control.
Headless BI uses modular architecture where the backend is independent from the frontend. This enables custom UI development, multiple frontends from one backend, embedding in customer applications, and programmatic analytics control.
According to Thoughtspot (May 2026), headless BI gives product teams full creative control to build analytics that feel like natural extensions of products, not third-party add-ons.
The Headless BI Stack Is Three Layers, and the Middle One Is What Gets Reused
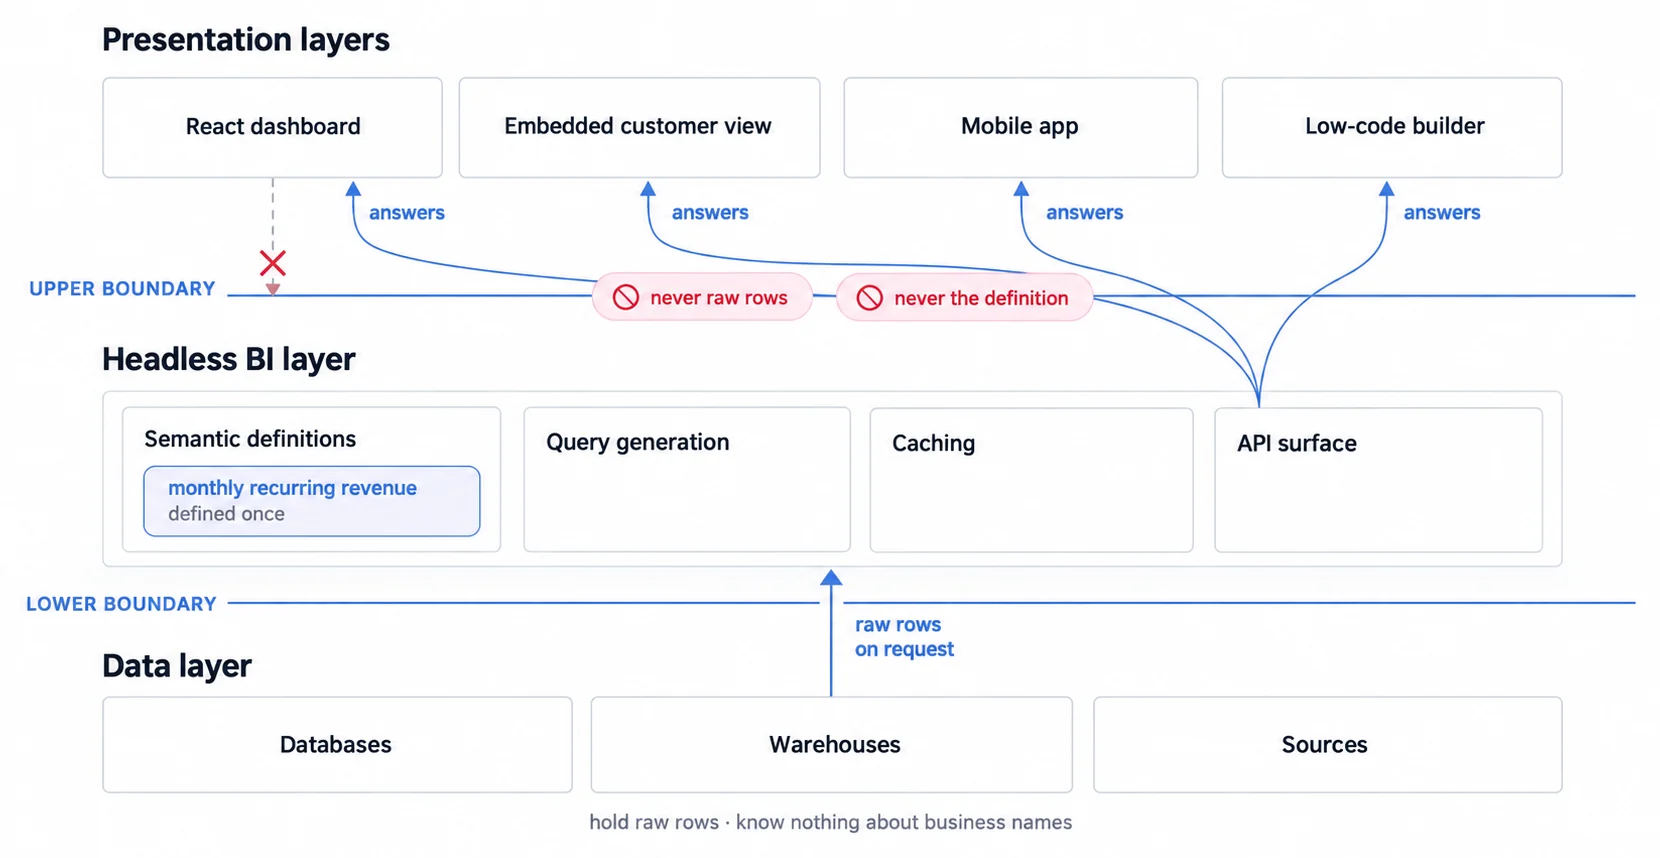
The headless BI stack has three layers:
Data Layer: Databases, data warehouses, and data sources provide raw information.
Headless BI Layer: This is the semantic layer with metrics definitions, query generation, caching, and API exposure. The backend defines what data means (metrics logic).
Presentation Layer: Custom UIs, embedded dashboards, React components, and mobile apps control how data appears (visualization).
The practical argument for this separation is reuse: one metrics backend can power several different frontends at once, so a definition written once stays consistent everywhere it appears.
Traditional BI Was Not Designed for Embedding, Which Is Why Headless BI Matters
B2B SaaS companies need headless BI to deliver a customer-facing analytics product, for several critical reasons.
Traditional BI was not designed for embedding. UI cannot be fully customized. Branding remains limited. White-label analytics requires complete presentation layer control to match product UX.
Multi-tenant architectures demand that backends handle data isolation while frontends render per-tenant customization. Organizations implementing headless BI ship analytics features faster, because the semantic layer stops each new surface re-deriving the same metrics. We have no independent measurement of the speed-up and are not quoting a vendor's.
Programmatic control through API-first analytics implementation and SDKs allows dynamic view generation based on user context, something impossible with traditional BI's fixed interfaces.
Four Building Blocks Make Up a Headless BI System
Headless BI architecture consists of four essential building blocks. Each component serves specific technical functions while remaining accessible to product managers and engineering leads.
The Semantic Layer Defines a Metric Once So Every Frontend Computes It the Same Way
A semantic layer is an abstraction that translates raw database schemas into business-friendly metrics and dimensions. It centralizes metric definitions in YAML or JSON configuration files, ensuring consistent calculations across all applications consuming the data.
The semantic layer abstracts raw database schemas into business-friendly metrics and dimensions. Instead of complex SQL joins, business intelligence users reference "Monthly Recurring Revenue" or "Customer Lifetime Value."
Technical implementation uses YAML or JSON configuration files defining metrics, dimensions, joins, and time grains. dbt describes its own Semantic Layer in the same terms: it "allows you to define metrics and use various interfaces to query them", and it "does the heavy lifting to find where the queried data exists in your data platform and generates the SQL to make the request (including performing joins)" (dbt Semantic Layer architecture).
We are not calling any of these the standard. We had a sentence here that did, sourced to a vendor blog rather than to a measurement, and a market-position claim with no count behind it is an opinion wearing a citation.
Benefits include consistency across applications, all frontends use identical metric definitions. Business logic centralizes in one location. Duplication reduces dramatically.
Key platforms include Cube.dev's semantic layer, dbt MetricFlow, and Looker's LookML (though LookML remains tightly coupled to Looker's BI tool).
A semantic layer is what gives an AI system the context to answer accurately. We are not routing that through an analyst prediction, because the version we had was a vendor's description of what Gartner said rather than Gartner's own words. Without semantic layers, AI systems lack the context needed for accurate analysis.
The Transformation Layer Belongs in the Warehouse With dbt, Not in a BI Tool
The transformation layer converts raw data into analytics-ready structures. dbt (Data Build Tool) leads this space with SQL-based transformations that are version controlled and tested.
dbt defines models as SELECT statements, builds dependencies automatically, and executes transformations in correct order. Version control integration (Git) enables collaborative development and rollback capabilities.
Transformation tooling has moved decisively toward dbt and its peers, away from legacy ETL. If your warehouse already has a dbt project, that is where your metric definitions belong rather than inside a BI tool.
The Query Layer Turns a Metric Request Into SQL and Applies Tenant Filtering for You
The query layer translates semantic requests ("show me revenue by region") into optimized SQL queries. This abstraction hides database complexity from consuming applications.
Key optimizations include:
- Join elimination when dimension tables aren't needed
- Query result caching for repeated requests
- Pre-aggregation for common query patterns
- Partition pruning for time-based queries
Platforms like Cube.dev generate SQL queries dynamically based on requested metrics and dimensions, automatically applying security context and tenant filtering.
The Exposure Layer Ships REST, GraphQL, or Native SDK Components
The exposure layer provides REST APIs, GraphQL endpoints, and native SDKs (SDK integration) for consuming applications.
REST APIs serve JSON responses for requested metrics. GraphQL endpoints enable flexible querying with precise field selection. Native SDKs (React, Vue, Angular) provide pre-built components that render visualizations directly.
SDK-first architectures cut frontend work because the components arrive built; API-first hands you data and leaves the rendering to you. Which saves more depends on how closely the charts need to match your product.
The Exposure Layer Decides Who Handles Every Later Request
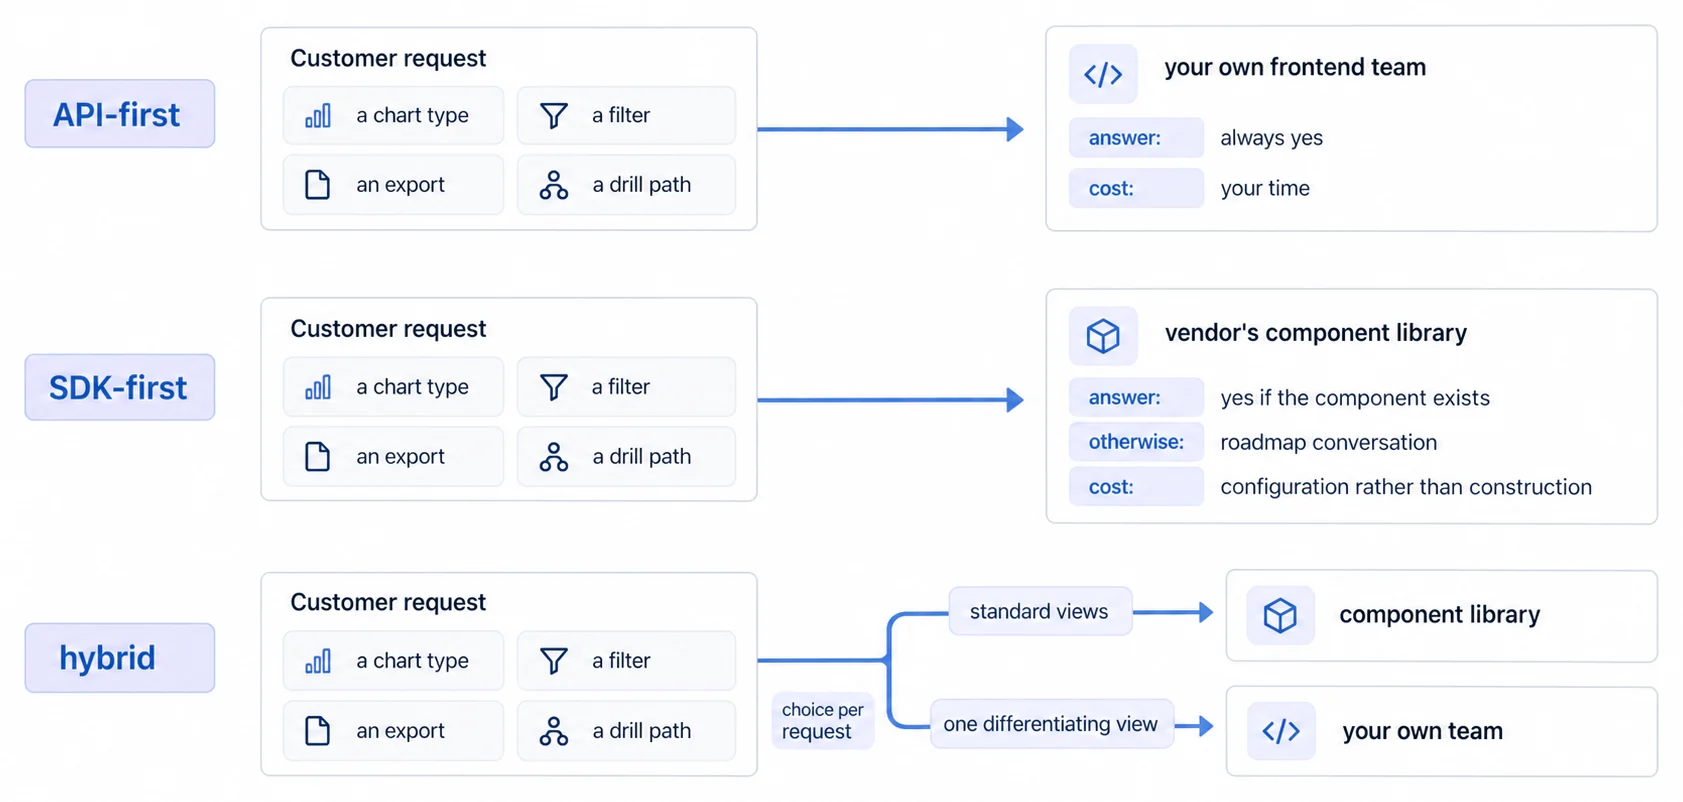
The exposure layer is usually compared on how long the first build takes, and that is the least durable part of the difference. A dashboard is never finished: a customer asks for a chart type, then a filter, then an export that keeps its formatting. What separates the two routes is who that request lands on, every quarter, for as long as the product lives.
Check Which Protocol the Semantic Layer Actually Speaks Before Assuming REST
"Exposes an API" is not one capability, and the protocol set differs by platform in a way that decides which consumers can connect at all.
dbt is the clearest case because its documentation names the protocols. The Semantic Layer's interfaces "allow users to submit metric queries using GraphQL and JDBC APIs", with ADBC listed alongside GraphQL as an available interface, and the architecture places "a Gateway service for executing SQL against the data platform" behind them (dbt Semantic Layer architecture).
JDBC is the detail worth noticing. It is how established BI clients connect, and it is not something a browser-side chart component can call, so a frontend consuming that layer needs the GraphQL route rather than the driver one. A shortlist that records only "has an API" will not surface that split.
We did not verify Cube's current protocol list from its documentation: the reference page we could open groups them as "Embed APIs" and "Core Data APIs" without naming the protocols. Treat any per-platform protocol table you build as something to confirm against each vendor's own reference rather than inferred from a category.
API-First Headless BI Buys Maximum UI Control and Charges Frontend Time for It
API-first platforms expose raw REST or GraphQL APIs. Frontend teams build custom components consuming these APIs.
Advantages:
- Maximum UI flexibility and control
- Custom interaction patterns
- Integration with existing component libraries
- No vendor UI lock-in
Disadvantages:
- Requires frontend development expertise
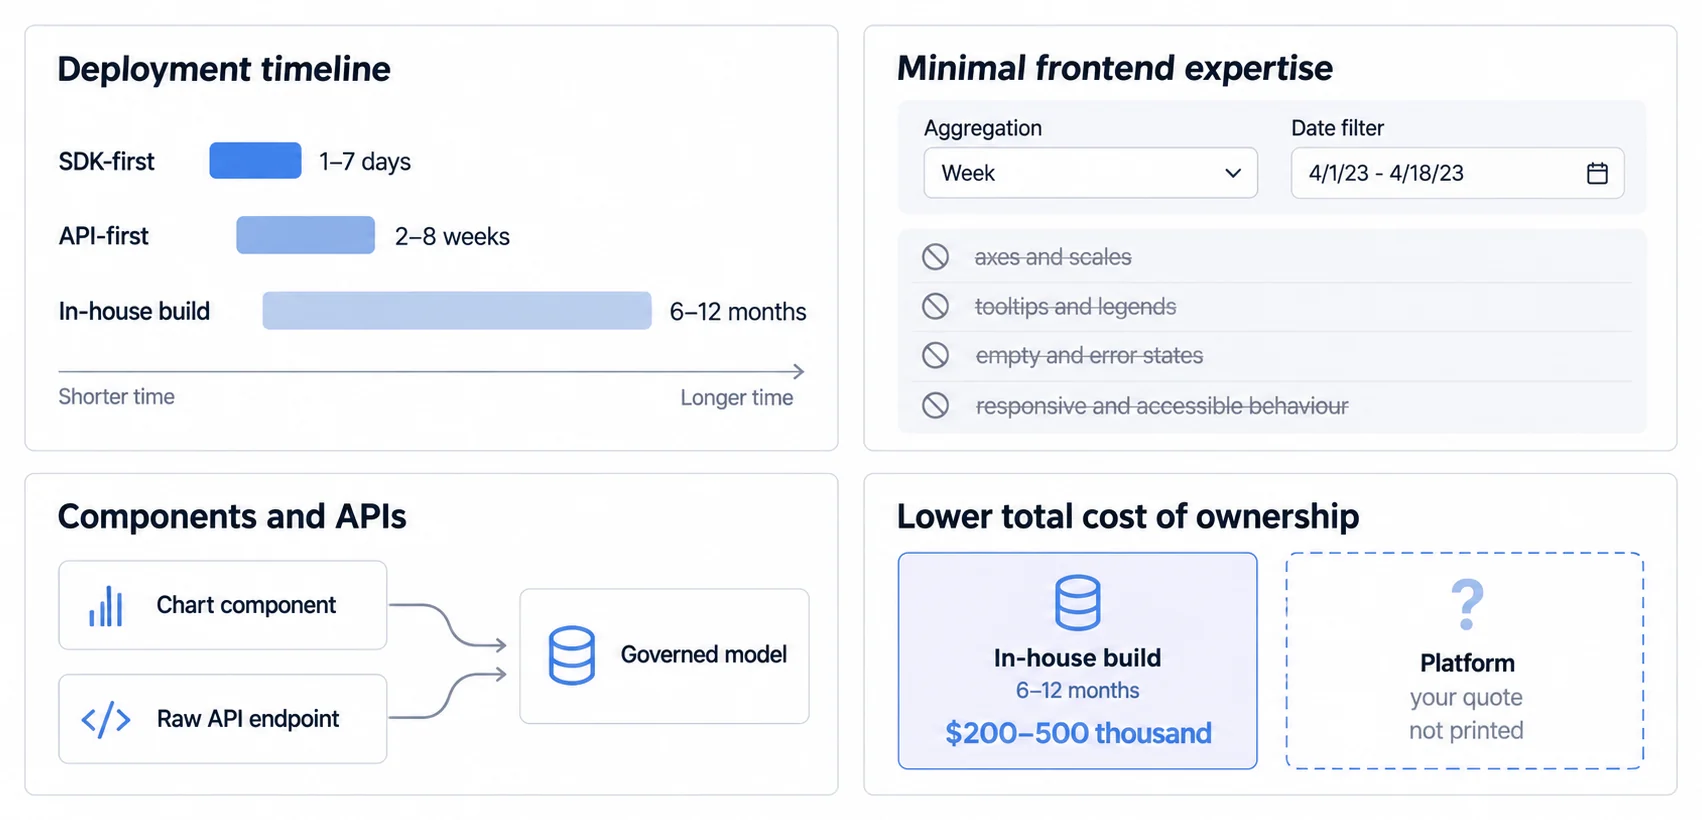
- 2-8 week implementation timeline
- Ongoing maintenance of custom components
- Higher total cost of ownership
Best For: Teams with dedicated frontend resources, differentiated UX requirements, or existing design systems requiring exact adherence.
SDK-First Headless BI Ships in Days and Constrains How Far the UI Can Diverge
SDK-first platforms provide pre-built React, Vue, or Angular components alongside APIs. Teams configure components rather than building from scratch.
Advantages:
- deployment measured in days rather than months, on our own planning figures
- Minimal frontend expertise required
- Maintained components (security updates, feature additions)
- Lower total cost of ownership than an in-house build, by a margin your own build estimate sets
Disadvantages:
- Limited to vendor-provided components
- Customization constrained by configuration options
- Potential vendor lock-in to component library
Best For: Resource-constrained teams, standard analytics use cases, speed-critical situations, or budget-conscious organizations.
SDK-first platforms deploy in days; API-first implementations take longer because you build the rendering layer yourself. For customer-facing analytics where speed matters, SDK-first replaces the rendering build with a component call, which is where most of the frontend effort goes. What it saves you depends on what your own build would have cost.
A Hybrid Headless BI Route Starts on SDK Components and Drops to the API Where It Must
Some platforms offer both APIs and SDKs, allowing teams to start with SDK components and progressively customize specific views with API calls when needed.
This approach optimizes for both speed and flexibility. Teams deploy standard dashboards quickly using SDK components, then build custom visualizations for differentiated features using underlying APIs.
Hybrid implementations deliver faster than pure API-first approaches while keeping customization where it matters, because the parts that do not need bespoke treatment stop being built by hand. We have no independent measurement of the difference and are not quoting a vendor's.
Traditional BI Fails Customer-Facing Analytics on Branding, Tenancy, Scale, and Price
Traditional BI platforms (Tableau, Power BI, Looker, Sisense) were designed for internal business users, not external customers. This architectural mismatch creates fundamental problems when embedding analytics into customer-facing products.
Traditional BI White-Labelling Stops at Logos, and Users Read the Rest as Bolted On
Traditional BI tools allow basic logo swaps and color changes. They cannot deliver smooth brand integration. Navigation elements, toolbar layouts, and interaction patterns remain locked to vendor designs.
Customers perceive these embedded analytics as third-party add-ons, not native product features. Visual consistency matters more than it looks: when an embedded panel does not match the product around it, users read it as a bolted-on extra rather than a feature, and treat it accordingly.
Headless BI solves this through complete presentation layer control. Frontend teams build analytics experiences that perfectly match product design systems, using identical components, typography, spacing, and interaction patterns.
Traditional BI Assumes One Tenant, So Multi-Tenant Work Falls Back to iframes
Traditional BI handles single-tenant deployments well, one organization's data in one instance. Customer-facing analytics requires multi-tenant architecture where thousands of customers access the same platform with strict data isolation.
Traditional BI vendors struggle with multi-tenant requirements. Implementations often resort to iframe embedding, isolated widgets that cannot integrate deeply with parent applications.
Headless BI platforms build multi-tenant architecture as core functionality. Row-level security, tenant-specific caching, and programmatic view generation handle multi-tenant requirements natively.
Traditional BI Caching Assumes Stable Workloads That Customer Analytics Never Has
Traditional BI tools optimize for dozens or hundreds of internal users. Customer-facing analytics must serve thousands to millions of end users simultaneously.
Query caching strategies in traditional BI assume relatively stable workloads. Customer analytics sees unpredictable query patterns as different tenants access different datasets at different times.
Headless BI addresses scale through tenant-specific caching, aggressive query optimization, and database connection pooling designed for high-concurrency scenarios.
Per-Seat BI Pricing Breaks the Moment Your Customers Become the Users
Traditional BI uses per-user or per-seat pricing. Embedding analytics for external customers creates unsustainable cost structures, licensing fees scale with customer count, not value delivered.
A B2B SaaS company with 10,000 customers cannot pay per-seat fees for embedded analytics. Economics break down rapidly.
Headless BI platforms use tenant-based or usage-based pricing that scales appropriately. Flat-rate models or consumption-based billing align costs with value.
Four Headless BI Patterns, Each With a Different Reason for Choosing It
Headless BI implementation varies significantly by use case. Understanding common patterns helps teams avoid architectural mistakes and accelerate deployment.
B2B SaaS: White-Labelled Dashboards Embedded in the Customer's Own Product View
Scenario: SaaS platform needs white-labeled analytics embedded directly in customer UI.
Requirements:
- Complete brand customization matching product design system
- Multi-tenant data isolation (1,000+ customers)
- Self-service filtering and exploration
- Export capabilities (PDF, CSV)
- Mobile-responsive design
Implementation Approach: Use SDK-first headless BI with React components. Customize themes through configuration. Implement row-level security at backend. We would budget days to weeks for deployment rather than months.
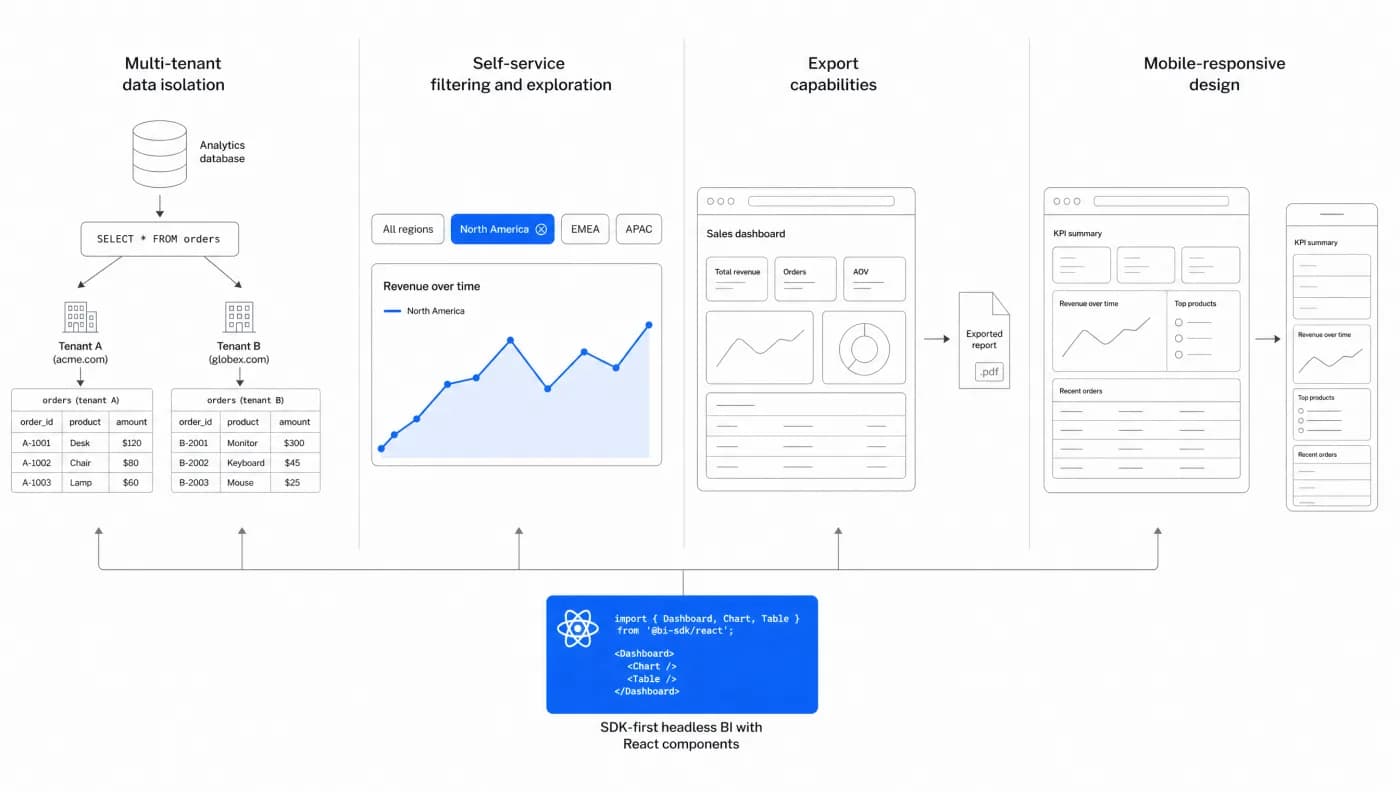
What this looks like in practice: an SDK-first headless setup ships in days rather than months and is paid for by infrastructure rather than by seats. The healthcare example that used to sit here came from a vendor's own case study we cannot link, so it is gone rather than reworded.
Internal Portal: One Analytics Hub Across Departments Without Per-Seat Licences
Scenario: Company needs centralized analytics hub for employees across departments.
Requirements:
- Single sign-on (SSO) integration
- Role-based access control
- Consistent metrics across all departments
- Scheduled reports and alerts
- Data governance and audit logging
Implementation Approach: Use semantic layer to define company-wide metrics. Build React portal consuming headless BI APIs. Implement SAML-based SSO. Deploy departmental views as distinct routes within portal.
Benefits Over Traditional BI: Programmatic view generation based on user roles eliminates manual dashboard maintenance. Semantic layer ensures metric consistency. Native SSO integration reduces authentication complexity.
Healthcare: A Patient-Facing Portal Where Compliance Constrains Every Layer
Scenario: Healthcare dashboard guide for patient-facing portal showing test results, health trends, and appointment history.
Requirements:
- HIPAA compliance
- Patient-specific data isolation
- Mobile-first responsive design
- Intuitive UX for non-technical users
- Integration with EHR systems
Implementation Approach: Use API-first headless BI for complete UI control. Build custom React components optimized for healthcare workflows. Implement backend multi-tenant implementation with encryption at rest and in transit. Deploy HIPAA-compliant infrastructure.
Compliance Advantage: Headless BI separates data processing from presentation, enabling healthcare organizations to maintain full control over data handling, storage, and access, critical for regulatory compliance.
Agencies: Client-Branded Analytics Where the Vendor Must Stay Invisible
Scenario: Digital marketing agency provides branded analytics dashboards to clients.
Requirements:
- Per-client white labeling (logos, colors, domains)
- Client-specific data sources
- Automated report scheduling
- Client self-service data exploration
- Usage-based billing per client
Implementation Approach: Use SDK-first headless BI with theming API. Configure per-client branding programmatically. Implement tenant-based data isolation. Expose self-service filtering through SDK components.
Economic Model: Headless BI's tenant-based pricing aligns with agency's client-based revenue model. Traditional BI per-seat pricing would be economically prohibitive.
The Embedding Method Sets User Experience, Maintenance, and What You Can Build
Understanding embedding techniques determines user experience quality, maintenance overhead, and technical capabilities.
SDK and Native Embedding Put Analytics Inside Your Component Tree
SDK embedding integrates analytics directly into application code using JavaScript SDKs, React components, or native mobile frameworks.
Advantages:
- Smooth UX, analytics feel like native features
- Deep integration with application state and routing
- Custom styling and theming
- Performance optimization opportunities
- Access to application context for dynamic filtering
Implementation: Install npm package, configure authentication, import components into React/Vue/Angular applications. Components render directly in DOM alongside application components.
When to Use: Customer-facing analytics requiring smooth brand integration, multi-step workflows, or deep application state integration.
iframe Embedding Isolates the Browser Context, and Isolation Is Both the Feature and the Cost
iframe embedding loads analytics in isolated browser contexts through iframe HTML elements.
Advantages:
- Simple implementation (single HTML tag)
- Strong security isolation
- No JavaScript version conflicts
- Works with any backend technology
Disadvantages:
- Poor UX, visible separation from parent application
- Limited cross-frame communication
- Responsive design challenges
- Performance overhead from additional HTTP requests
- Cannot access parent application state
When to Use: Internal analytics portals where UX seamlessness is less critical, or when embedding third-party analytics from vendors without SDK options.
SDK Against iframe, Compared on the Axes That Change the Build
| Aspect | SDK/Native | iframe |
|---|---|---|
| Implementation Complexity | Moderate (1-7 days) | Simple (hours) |
| UX Quality | Excellent (smooth) | Poor (isolated) |
| Customization | High | Limited |
| Performance | Optimal | Overhead |
| Security Isolation | Application-level | Browser-level |
| Use Case | Customer-facing | Internal portals |
Multi-Tenant Architecture Is What Lets One Deployment Serve Every Customer Safely
Multi-tenant architecture allows a single application instance to serve multiple customers (tenants) while each tenant's data stays separated by an enforced boundary rather than by convention. Sharing infrastructure across tenants is what makes the deployment economical; the size of that saving depends on your own workload and topology rather than on a general ratio.
Multi-tenant architecture enables single platform instances to serve multiple customers (tenants) with strict data isolation. For B2B SaaS customer-facing analytics, multi-tenant design is non-negotiable.
Multi-Tenancy Buys One Codebase and One Pipeline Instead of One Per Customer
Economic Efficiency: Single infrastructure serves thousands of customers, dramatically reducing per-customer costs.
Operational Simplicity: One codebase, one deployment pipeline, one monitoring stack.
Scalability: Add customers without infrastructure changes.
Feature Velocity: New analytics features deploy to all customers simultaneously.
The infrastructure argument for multi-tenancy is straightforward: one set of resources serves every customer instead of one stack per customer. The saving scales with tenant count, which is why it matters more at a hundred customers than at five.
Row-Level Security, Separate Schemas, and Separate Databases Trade Isolation Against Complexity
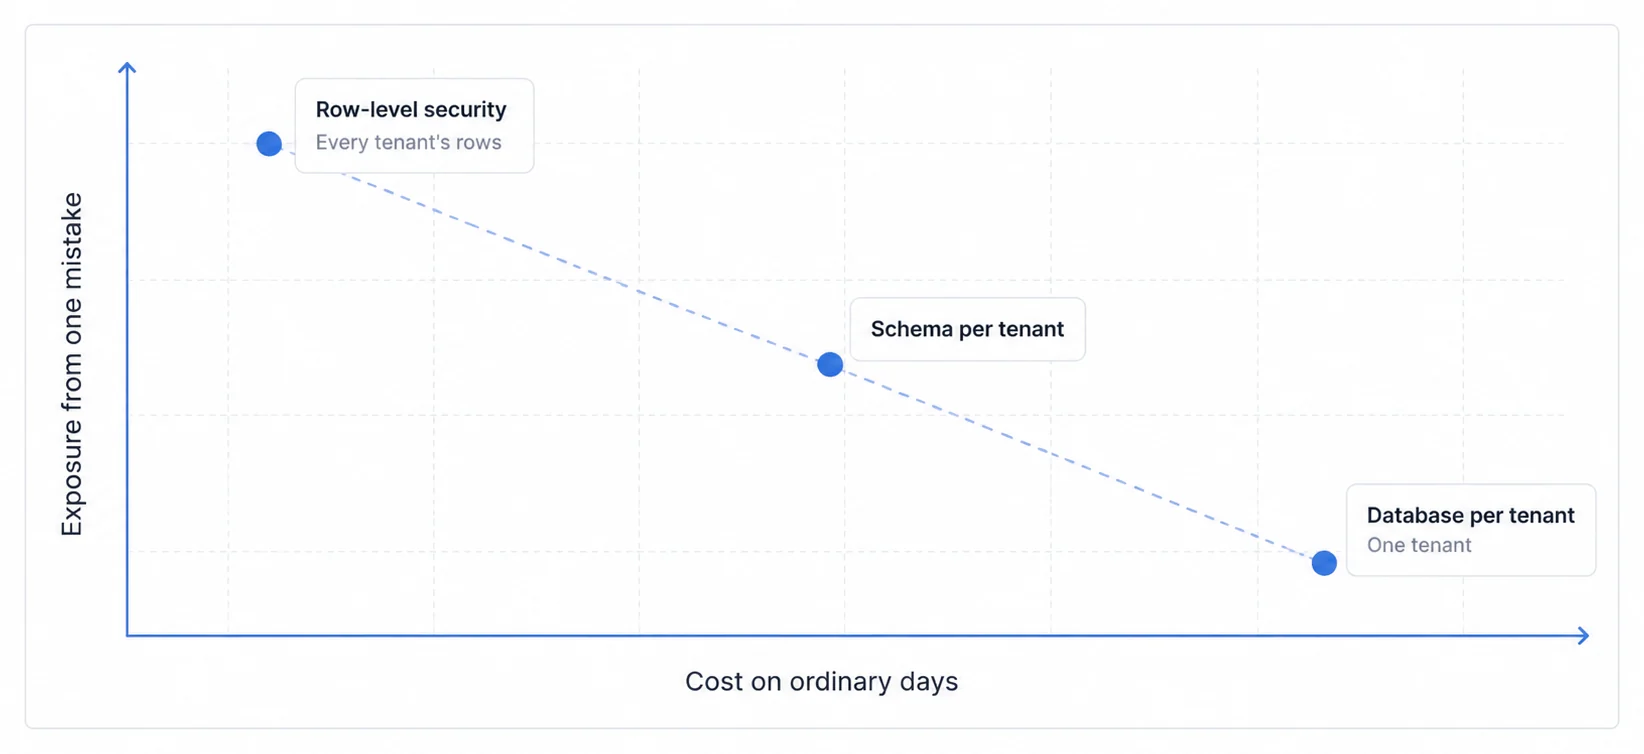
Row-Level Security (RLS): Database queries automatically filter results based on tenant context. Every query includes WHERE tenant_id = tenantID clauses. Row-level security implementation happens in semantic layer, application code never manually filters by tenant.
Schema-Level Separation: Each tenant gets dedicated database schema. Queries target tenant-specific schemas. Provides stronger isolation but increases database complexity.
Database-Level Separation: Each tenant gets dedicated database instance. Maximum isolation, highest cost, operationally complex.
Never trust frontend tenant filtering. All tenant isolation must occur at backend/database layer. Frontend tenant IDs are security suggestions, not security mechanisms. Always validate tenant access server-side before returning any data.
Every Tenant Needs Its Own Branding, Metrics, and Permissions From the Same Deployment
Multi-tenant systems must support per-tenant configuration:
- Branding (logos, colors, fonts)
- Custom metrics and dimensions
- Role-based access control
- Timezone and localization settings
- Data retention policies
Implementation approaches:
- Configuration tables: Store tenant-specific settings in database tables
- JSON blobs: Store configuration as JSON in tenant records
- File-based overrides: Tenant-specific config files in deployment
Store tenant configuration in the database rather than in files. It lets you onboard a tenant programmatically and change configuration without a redeploy, which is the difference between adding a customer and shipping a release.
Multi-Tenant Query Patterns Diverge by Tenant, So One Cache Strategy Will Not Hold
Multi-tenant queries face unique challenges:
- Query patterns vary dramatically between tenants
- Some tenants have 10 records, others have 10 million
- Cache invalidation must be tenant-specific
- Resource allocation must prevent tenant A's queries from impacting tenant B
Pre-Aggregations: Generate tenant-specific summary tables during low-traffic periods. Queries hit pre-aggregated data instead of raw tables.
Tenant-Aware Caching: Cache keys include tenant ID. Tenant A's cache doesn't serve tenant B's requests.
Query Queuing: Implement per-tenant query limits. Prevents single tenant from monopolizing database resources.
White-Label Analytics Comes in Three Depths, and the Depth Decides the Platform
White labeling transforms generic analytics into branded customer experiences. Requirements vary significantly between basic customization and full white-label implementations.
Basic White-Label Swaps the Logo and the Colours, and Stops There
Requirements:
- Custom logo upload
- Brand color configuration
- Custom domain (analytics.clientdomain.com)
Implementation: Simple theming configuration. Most embedded dashboards platforms support basic white labeling out-of-box.
Intermediate White-Label Reaches Typography, Spacing, and Component Styling
Requirements:
- Typography control (fonts, sizes, weights)
- Spacing and layout customization
- Icon library selection
- Button and form element styling
Implementation: CSS variable overrides or theme configuration objects. Requires SDK-based embedding for deep styling control.
Advanced White-Label Hands Over Layout and Interaction, Which Needs an SDK
Requirements:
- Custom dashboard layouts
- Branded interaction patterns
- Custom navigation structures
- Unique chart types or visualizations
- Integration with client design systems
Implementation: API-first headless BI with custom React components. Development team builds visualization layer from scratch using headless BI APIs as data source.
Decide the White-Label Depth Before You Choose the Platform, Not After
Before implementing white-label analytics:
- Define customization scope (basic, intermediate, advanced)
- Inventory required brand elements (logos, colors, fonts, spacing)
- Determine custom domain strategy
- Plan asset storage and CDN delivery for tenant-specific branding
- Implement tenant-specific configuration management
- Test brand consistency across breakpoints (desktop, tablet, mobile)
- Validate accessibility (WCAG 2.1 AA compliance with custom themes)
Analytics projects that start with written scope finish faster than those that do not, for the ordinary reason that undefined requirements get discovered late. Write down which dashboards ship at launch and which wait.
Headless BI Performance Is Won in Caching, Query Shape, and the Network
Analytics query performance directly impacts user experience. Slow dashboards get abandoned, and in an embedded context the abandonment lands on your product rather than on the analytics vendor. Headless BI platforms optimize performance through multiple strategies.
Result Caching and Pre-Aggregation Trade Freshness for Speed, Deliberately
Query Result Caching: Store query results in Redis or Memcached. Subsequent identical queries return cached results instantly. TTL (time-to-live) controls freshness. Typical TTLs: 5-60 minutes depending on data update frequency.
Pre-Aggregation: Generate summary tables during off-peak hours. Queries against pre-aggregated tables return in milliseconds versus seconds. Trade-off: slight staleness for dramatic speed improvement.
Request-Level Caching: Cache at API gateway layer. Identical HTTP requests return cached responses without hitting backend. Real-time dashboard requirements and real-time analytics use cases may preclude aggressive caching.
Materialized Views and Column-Store Databases Attack the Same Cost From Different Sides
Materialized Views: Database-level pre-computation. Complex joins and aggregations computed once, stored as views. Queries against views run 10-100x faster.
Column-Store Databases: Snowflake, ClickHouse, and BigQuery optimize for analytical queries through columnar storage. Queries scan only needed columns, not full rows.
Partition Pruning: Query planner eliminates scanning irrelevant data partitions. Time-based partitioning (daily/monthly) dramatically reduces data scanned for date-filtered queries.
Index Optimization: Ensure foreign keys and commonly filtered columns have appropriate indexes. Analyze query execution plans to identify missing indexes.
A CDN and Response Compression Fix the Latency the Database Cannot
CDN for Static Assets: Serve JavaScript bundles, CSS, and images through CDN. Reduces latency for geographically distributed users.
Response Compression: Enable gzip compression for API responses. Typical compression ratios: 5-10x for JSON payloads.
Pagination: Never return unbounded result sets. Implement cursor-based pagination for large datasets. Load data incrementally as users scroll.
Data Aggregation Server-Side: Aggregate at database layer, not application layer. Return summary data, not row-level details. Chart showing monthly revenue should return 12 data points, not 100,000 transactions.
Set Explicit Performance Budgets, Because Without a Number Nothing Regresses Visibly
Set explicit performance targets:
- Cached query responses: <200ms
- Uncached common queries: <1 second
- Complex analytical queries: <3 seconds
- Dashboard initial render: <2 seconds
Monitor performance continuously. Set up alerts when queries exceed budgets. Use APM tools (Datadog, New Relic) to track query performance across tenants.
Headless BI Security Has to Cover Identity, Encryption, Compliance, and the Audit Trail
Customer-facing analytics handle sensitive business data. Security is architectural, not afterthought.
Authentication Proves Who Is Asking and Authorization Decides What They May See
Authentication Methods:
- OAuth 2.0 for API access
- JWT tokens for SDK embedding
- SAML SSO for enterprise customers
- API keys for server-to-server communication
Authorization Patterns:
- Role-Based Access Control (RBAC)
- Attribute-Based Access Control (ABAC)
- RLS (Row-Level Security) for multi-tenant data isolation
- Tenant-specific permission models
Encrypt Analytics Data at Rest and in Transit, Because the Warehouse Is Not the Only Hop
Encryption at Rest: Database-level encryption for stored data. Cloud providers (AWS RDS, GCP Cloud SQL) support encryption with managed keys.
Encryption in Transit: TLS 1.2+ for all API communication. Enforce HTTPS for dashboard embedding.
Field-Level Encryption: Encrypt sensitive columns (PII, financial data) with application-level encryption before database storage.
GDPR, HIPAA, and SOC 2 Each Add Requirements the Analytics Layer Must Meet Itself
GDPR: Implement data access controls, audit logging, and data deletion capabilities. Support data portability through export APIs.
HIPAA: For healthcare use cases, ensure BAA (Business Associate Agreement) with headless BI vendor. Implement audit logging for all data access. Maintain encryption for PHI (Protected Health Information).
SOC 2: Many headless BI platforms maintain SOC 2 Type II compliance. Verify vendor compliance before deployment.
Log Every Analytics Data Access, Because Regulators Ask Who Saw What and When
Log all data access:
- User ID and tenant ID
- Query executed
- Timestamp
- Data returned
- API endpoint accessed
Store logs in tamper-proof, append-only storage. Typical retention: 1-7 years depending on compliance requirements.
Headless BI Build Versus Buy Turns on Roles You Must Hire, Not on Licence Fees
Should you build headless BI in-house or buy a platform? Economic analysis reveals significant differences in TCO (Total Cost of Ownership).
Building Headless BI In-House Costs Roles, Which Is Why This Section Names Them Instead of a Total
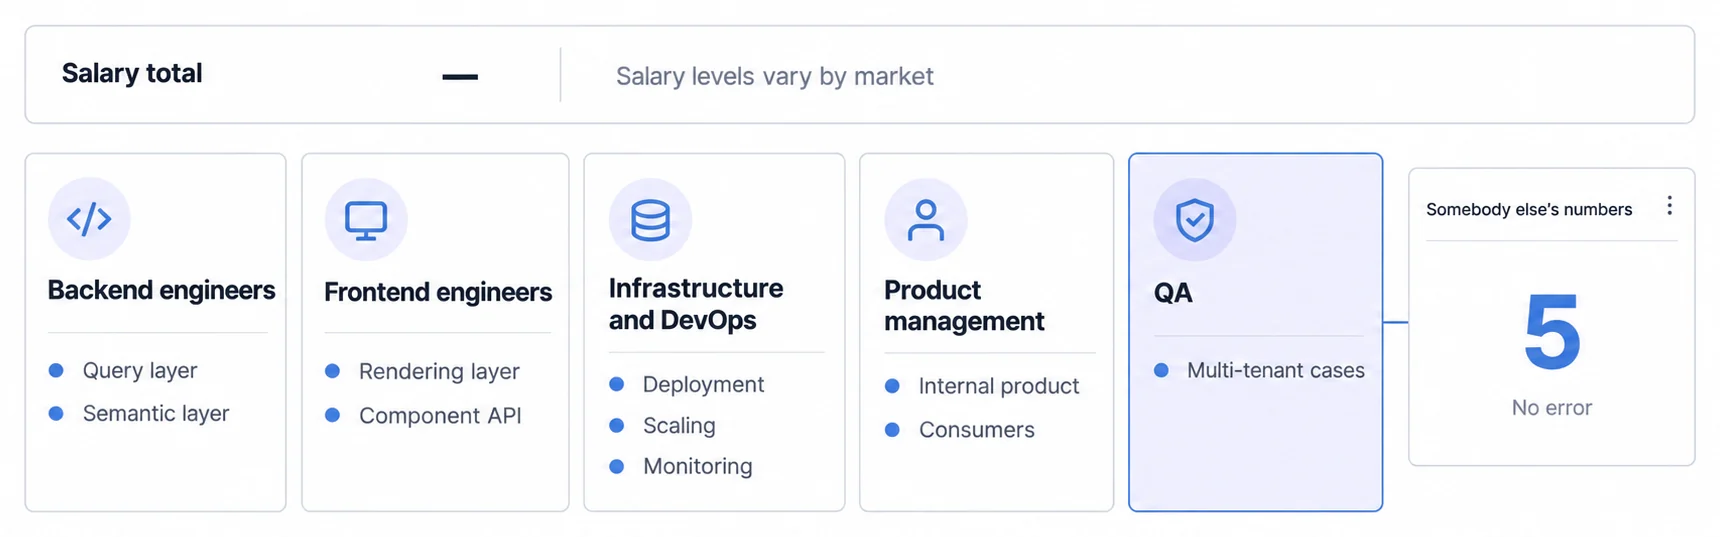
Engineering resources (initial 6-12 months). Salary levels vary too much by market for a single total to be useful, so here are the roles a headless build actually needs. Price them at your own rates:
- Backend engineers for the query and semantic layer
- Frontend engineers for the rendering layer and the component API your product consumes
- Infrastructure and DevOps for deployment, scaling and monitoring
- QA for the multi-tenant cases, which are the ones that fail quietly
- Product management, because a headless layer is an internal product with internal customers
Our own site puts a custom build at $200K-500K+ over 6-12 months, and that is the range to work from. Where your number lands inside it depends on how many of those roles you staff and for how long.
Ongoing, annual. Three lines that do not stop after launch: maintenance and updates, infrastructure, and continued feature development. The first is unavoidable, the third is the one teams forget to budget, and together they are usually the difference between a build that looked cheap and one that was.
Three-year view: the build plus three years of those ongoing lines. Run it with your own rates.
Buying Headless BI Prices the Platform, and Leaves Integration With Your Team
API-First Platform (e.g., Cube.dev, GoodData):
- Platform fees: €30K-€80K/year depending on usage
- Frontend development: €80K-€120K initial, on a three to six month build we would budget
- Integration/customization: €40K
- Ongoing maintenance: €40K/year
- 3-year TCO on those lines: €120K-€160K to stand it up, then €70K-€120K a year, so €330K-€520K over three years. The spread is wide because the platform fee and the maintenance line are both ranges; substitute your own and re-run it.
SDK-First Platform:
- Platform fees: €8K-€20K/year (flat-rate pricing)
- Setup/customization: €10K-€20K initial (1-2 weeks)
- Ongoing maintenance: €5K/year (minimal)
- 3-year TCO on those lines: €10K-€20K to stand it up, then €13K-€25K a year, so €49K-€95K over three years.
Headless BI Build Against Buy, Compared on Initial Cost, Ongoing Cost, and Time
| Approach | Initial cost | Ongoing | Time to production |
|---|---|---|---|
| Build In-House | $200K-500K+ in engineering cost | maintenance, infrastructure and continued feature work | 6-12 months |
| API-First Platform | quoted per deal by most vendors in this category | licence plus your own integration | 2-8 weeks |
| SDK-First Platform | Sumboard is €199/month on Growth and €499 on Business, with Enterprise custom; others quote per deal | licence plus your own dashboard work | days |
We have left the savings column out. Two of these three rows depend on a quote you have not received yet, so any percentage we printed would be arithmetic on a number we invented. Time to production is the column that compares cleanly.
Four Headless BI Decisions Are Expensive to Reverse, So Make Them First
Define Five to Ten Core Metrics First, Because Metric Bloat Costs Focus
Define 5-10 essential metrics first. Revenue, active users, conversion rates, and churn typically provide highest impact. Avoid metric bloat, too many metrics reduce focus.
Use semantic layer to standardize definitions. "Monthly Recurring Revenue" means the same thing across all dashboards and applications.
Design for Multi-Tenancy on Day One, Because Retrofitting It Is Extremely Difficult
Design for multi-tenancy from day one. Retrofitting multi-tenant analytics architecture later proves extremely difficult.
Use tenant IDs in all queries. Apply row-level security at the backend, never trust frontend filtering. Test data isolation thoroughly before production deployment.
Set the Performance Budget Before the First Dashboard, Not After the Complaint
Set performance budgets: Under 500ms for cached queries, under 2 seconds for uncached queries.
Implement caching strategies early. Use pre-aggregations for common queries. Monitor query performance continuously.
Authentication and Authorization Are Architecture Decisions, Not Later Additions
Authentication and authorization must be architectural decisions, not afterthoughts.
Use established standards: OAuth 2.0, JWT tokens, SAML for SSO. Implement audit logging from the beginning. Never store credentials in frontend code.
A Headless BI Implementation in Five Steps, Semantic Layer First
Step 1: Define the Semantic Layer, Because Every Later Step Reads From It
Create YAML configuration defining metrics and dimensions:
# metrics.yml
metrics:
  - name: monthly_recurring_revenue
    type: sum
    sql: subscription_amount
    filters:
      - subscription_status = 'active'

  - name: customer_count
    type: count_distinct
    sql: customer_id

dimensions:
  - name: created_date
    type: time
    sql: created_at

  - name: plan_type
    type: string
    sql: subscription_plan
Step 2: Configure the Data Sources the Semantic Layer Will Query
Connect to data warehouse:
// cube.js
module.exports = {
  dataSource: 'default',

  driverFactory: () => {
    return new SnowflakeDriver({
      account: process.env.SNOWFLAKE_ACCOUNT,
      username: process.env.SNOWFLAKE_USER,
      password: process.env.SNOWFLAKE_PASSWORD,
      database: 'ANALYTICS_DB',
      warehouse: 'COMPUTE_WH'
    });
  }
};
Step 3: Implement Multi-Tenant Security Before Any Dashboard Renders
Add tenant context to all queries:
// security-context.js
module.exports = {
  contextToAppId: ({ securityContext }) => {
    return `CUBEJS_APP_${securityContext.tenantId}`;
  },

  queryRewrite: (query, { securityContext }) => {
    query.filters.push({
      member: 'Orders.tenantId',
      operator: 'equals',
      values: [securityContext.tenantId]
    });
    return query;
  }
};
Step 4: Embed the Dashboard Components Inside Your Own Component Tree
Install SDK and render components:
npm install @sumboard/react-sdk
// Dashboard.jsx
import { Dashboard, Chart } from '@sumboard/react-sdk';

function CustomerDashboard() {
  return (
    <Dashboard>
      <Chart
        type="line"
        metric="monthly_recurring_revenue"
        dimension="created_date"
        dateRange="last_12_months"
      />

      <Chart
        type="bar"
        metric="customer_count"
        dimension="plan_type"
      />
    </Dashboard>
  );
}
Step 5: Configure White-Label Theming So the Analytics Stop Looking Bought
Customize appearance programmatically:
// theme.js
const tenantTheme = {
  colors: {
    primary: tenant.brandColor,
    background: '#ffffff',
    text: '#2d3748'
  },

  fonts: {
    body: tenant.fontFamily,
    heading: tenant.fontFamily
  },

  logo: tenant.logoUrl
};

<Dashboard theme={tenantTheme} />
SDK-First Headless BI Wins on Speed, Team Size, Standard Patterns, and Budget
SDK-first platforms optimize for specific scenarios. Understanding when SDK-first makes strategic sense prevents over-engineering.
Choose SDK-First When Competitive Pressure Measures the Deadline in Weeks
Product teams need analytics features shipped within weeks, not months. Competitive pressure demands rapid deployment. Embedded analytics implementation timelines dictate platform selection.
SDK-first delivers working dashboards in 1-7 days. Teams install packages, configure authentication, customize themes, and deploy. No custom component development required.
Choose SDK-First When There Is No Dedicated Frontend Team to Assign
Organizations lack dedicated frontend engineering resources. Product managers and backend engineers need to deliver analytics without hiring specialized frontend talent.
SDK-first provides pre-built React components that non-specialist developers can configure and deploy. Complexity remains hidden in maintained packages.
Choose SDK-First When the Requirement Matches a Pattern the Components Already Cover
Analytics requirements match common patterns: revenue dashboards, user activity tracking, operational metrics, customer health scores.
These use cases don't require differentiated UI. SDK components provide sufficient customization through configuration, colors, fonts, logos, layouts.
Choose SDK-First When the Budget Cannot Absorb a Six-Month Build First
Startups and small SaaS companies operate on tight budgets. Embedded analytics platforms must deliver ROI quickly without major upfront investment.
SDK-first platforms cost €8K-€20K annually. The API-first route lands in the low hundreds of thousands over three years on the assumptions above, and building in-house runs $200K-500K+ before the maintenance that follows it.
The Headless BI Backend Does Not Care Which Presentation Layer Consumes It
The presentation layer renders analytics to users. Technology choices depend on user base, performance requirements, and development resources.
React Is the Most Common Headless BI Frontend, With the Widest Charting Ecosystem
Most popular option for modern web applications. Rich ecosystem of JavaScript charting library options. Component-based architecture enables reusability.
Popular Libraries:
- Recharts (simple, declarative)
- D3.js (maximum flexibility, steep learning curve)
- Chart.js (lightweight, good defaults)
- Plotly (feature-rich, scientific visualization)
Native Mobile Gives the Best Performance for Mobile-First Analytics Products
For mobile-first applications, native implementations provide best performance and UX.
iOS: Swift/SwiftUI with Charts framework or third-party libraries Android: Kotlin with MPAndroidChart or similar
Headless BI APIs serve data to native mobile components. Platform SDKs may provide native mobile libraries.
Low-Code Builders Put Non-Technical Users on Top of the Same Headless BI Backend
For non-technical users, low-code platforms provide drag-and-drop dashboard builders on top of headless BI backends.
Users configure dashboards through visual interfaces. Platform generates code automatically. Useful for rapid prototyping and internal analytics portals.
The Four Headless BI Routes Differ by an Order of Magnitude in Time to Production
Time-to-market increasingly determines competitive outcomes in B2B SaaS. Analytics features directly impact customer acquisition and retention.
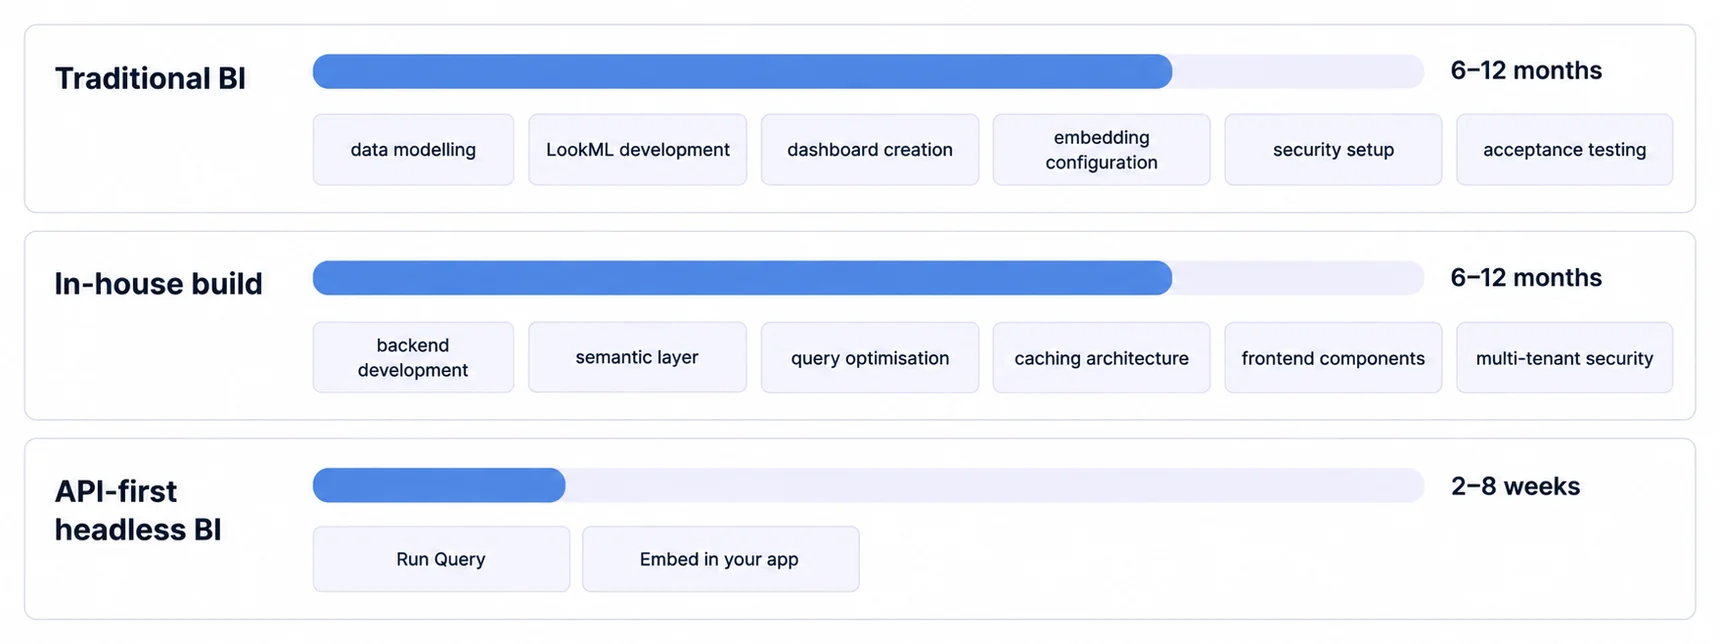
Traditional BI runs to months rather than weeks, 6-12 of them in practice
Enterprise BI embeddings run to months rather than weeks from contract signature to production. We had a Gartner figure here and could not link it, so it is gone; the shape of the claim is what survives.
Implementation includes data modeling, LookML development, dashboard creation, embedding configuration, security setup, and user acceptance testing.
An in-house build takes 6-12 months, most of it backend before any chart appears
Custom analytics platforms require 6-12 months of development. Backend development, semantic layer implementation, query optimization, caching architecture, frontend component development, and multi-tenant security each consume multiple sprints.
In-house analytics projects fail to reach production more often than teams expect, and the usual cause is not the charts but everything underneath: tenant isolation, query performance at real data volumes, and the export formats customers turn out to need.
API-first removes the backend work and leaves the frontend, so 2-8 weeks
API-first platforms eliminate backend development but require custom frontend work. Total implementation: 2-8 weeks depending on UI complexity.
Teams focus on presentation layer development while platform handles data processing, caching, and query optimization.
SDK-first ships a working dashboard in 1-7 days
SDK-first platforms provide working dashboards within days. Install SDK package, configure authentication, customize themes, deploy.
Time from trial to production is short for SDK-first platforms, typically days rather than weeks, because the integration is a component call rather than an infrastructure project. Measure it yourself during a trial.
Earlier analytics deployment means earlier customer feedback, faster iteration, and competitive advantage. Companies deploying analytics in days versus months gain 6-12 month market lead, time competitors cannot recover.
Ready to launch customer-facing analytics?
Stop losing customers to competitors with better analytics. Sumboard's customer-facing analytics platform lets you launch self-service dashboards in days, not months.