Supply Chain Dashboard: Real-Time Visibility & KPI Tracking Guide
Modern supply chain operations demand instant visibility across complex networks of suppliers, warehouses, transportation, and delivery channels. What that visibility usually becomes is a dashboard, and a well-designed supply chain dashboard transforms fragmented data into actionable insights, enabling teams to monitor performance, identify bottlenecks, and make data-driven decisions in real time.
This guide explores how to build effective supply chain dashboards that provide end-to-end visibility, track critical KPIs, and support operational excellence across procurement, logistics, inventory management, and delivery operations.
Live demo: Interactive supply chain dashboard built with Sumboard, explore supplier on-time delivery, procurement spend, shipment status, inventory levels, and freight costs.
What is a Supply Chain Dashboard?
A visual analytics interface that consolidates key metrics and performance indicators across the entire supply chain network, from supplier management and procurement to warehousing, logistics, and final delivery, providing real-time visibility for proactive decision-making.
A supply chain dashboard provides real-time visibility into:
- Supplier Performance: On-time delivery rates, quality scores, lead times
- Inventory Levels: Stock positions, turnover rates, aging analysis
- Logistics Operations: Shipment tracking, carrier performance, route optimization
- Order Fulfillment: Order accuracy, cycle times, delivery performance
- Cost Management: Transportation costs, warehousing expenses, total landed cost
Unlike traditional static reports, supply chain dashboards offer interactive, real-time monitoring that enables proactive management and rapid response to disruptions. Modern supply chain dashboards use business intelligence principles to transform operational data into strategic insights that drive competitive advantage.
Supply Chain Dashboard vs. General Business Dashboards
| Feature | Supply Chain Dashboard | General Business Dashboard |
|---|---|---|
| Primary Focus | End-to-end supply chain visibility | Overall business performance |
| Update Frequency | Real-time analytics for operations | Daily/weekly for most metrics |
| Key Stakeholders | Supply chain teams, logistics, procurement | Executive leadership, all departments |
| Typical Metrics | On-time delivery, inventory turnover, supplier performance | Revenue, profit margins, customer acquisition |
| Integration Complexity | High (ERP, WMS, TMS, supplier portals) | Medium (CRM, finance, marketing platforms) |
Core Components of Supply Chain Dashboards
1. Executive Supply Chain Overview
Purpose: Provide senior leadership with high-level visibility into supply chain health and performance against strategic objectives.
Key Metrics:
- Perfect Order Rate (on-time, complete, damage-free, accurate documentation)
- Total Supply Chain Cost as % of Revenue
- Cash-to-Cash Cycle Time
- Supply Chain ROI
- Customer Satisfaction Score (CSAT)
Visualization Types:
- Scorecard showing current vs. target performance
- Trend lines for historical performance
- Geographic heat maps showing regional performance
- Exception alerts for critical issues
Use Case: A CPO reviews the executive dashboard daily to monitor overall supply chain health, identify emerging risks, and allocate resources to address performance gaps.
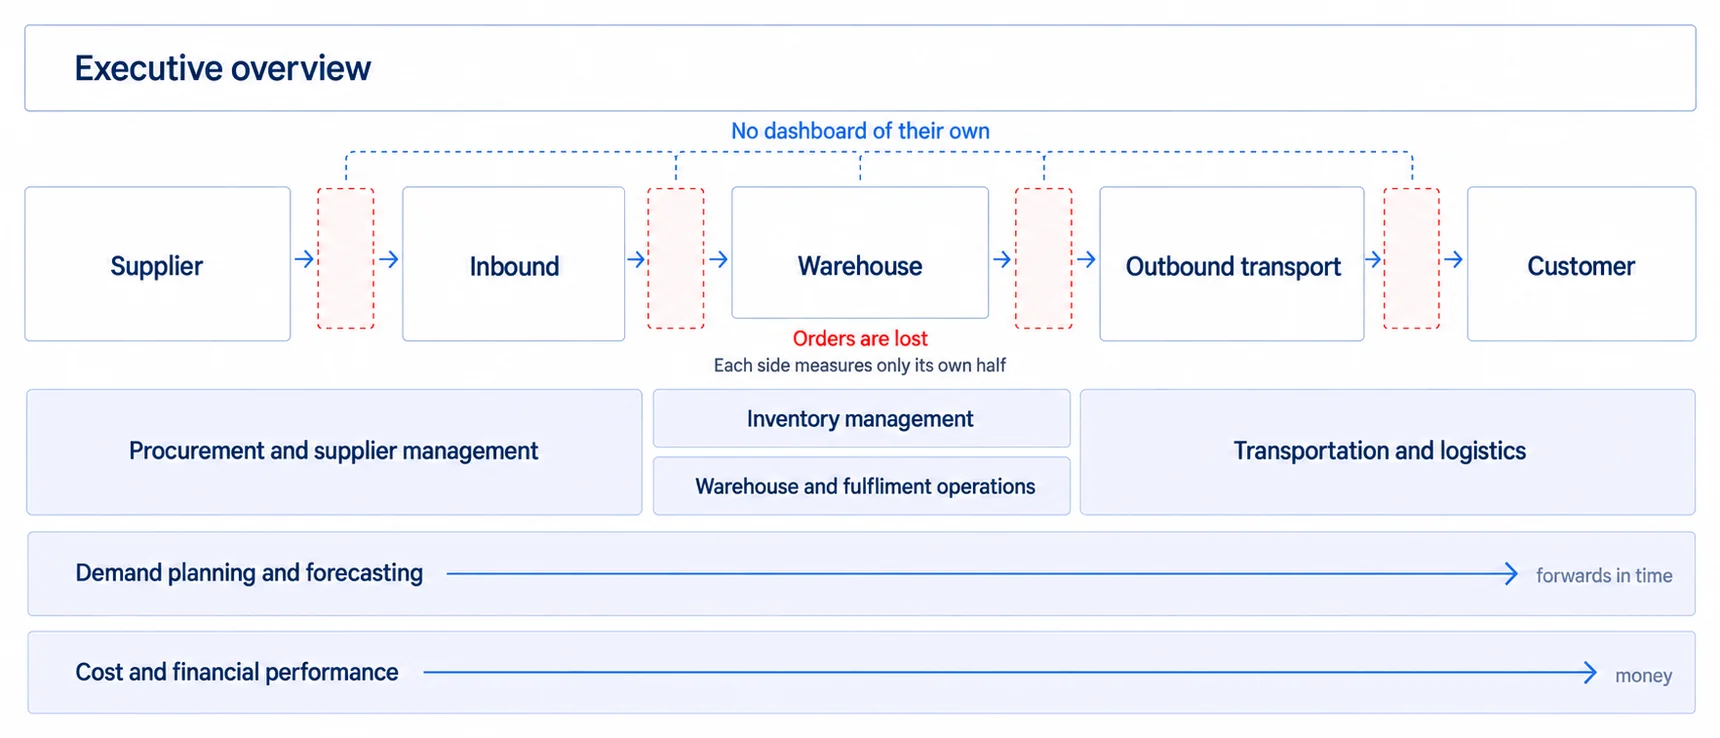
2. Procurement & Supplier Management
Purpose: Track vendor delivery reliability, quality, lead-time variability and cost performance, so procurement decisions and supplier relationships rest on observed behaviour rather than on the last conversation.
Key Metrics:
- Supplier On-Time Delivery Rate
- Supplier Quality Rating (defect rates, returns)
- Purchase Order Cycle Time
- Supplier Lead Time Variability
- Cost Savings from Negotiations
- Number of Active Suppliers by Category
Visualization Types:
- Supplier scorecards comparing performance across vendors
- Pareto charts identifying top suppliers by spend
- Trend analysis of delivery performance
- Risk heat maps for supplier concentration
Use Case: A procurement manager monitors supplier delivery performance weekly, identifying vendors consistently missing deadlines and initiating corrective action plans.
3. Inventory Management
Purpose: Optimize inventory levels, reduce carrying costs, and prevent stockouts or overstocking.
Key Metrics:
- Inventory Turnover Ratio
- Days of Inventory on Hand
- Stock-Out Rate
- Excess Inventory Value
- Inventory Accuracy (cycle count results)
- Safety Stock Levels by SKU
Visualization Types:
- Inventory aging analysis (bar charts by time period)
- ABC classification visualization
- Stock level trend lines with reorder points
- Heat maps showing slow-moving inventory
Use Case: An inventory planner uses the dashboard to identify slow-moving stock, plan promotional activities to clear excess inventory, and adjust reorder points based on demand patterns.
Real-time inventory visibility reduces carrying cost by removing the buffer that teams hold against not knowing. We could not find a benchmarking study that publishes its method, so we are not quoting a percentage range for it.
4. Warehouse & Fulfillment Operations
Purpose: Monitor warehouse efficiency, track order fulfillment accuracy, and optimize picking/packing processes.
Key Metrics:
- Order Fill Rate (% of orders shipped complete)
- Pick Accuracy Rate
- Average Order Cycle Time
- Warehouse Capacity Utilization
- Labor Productivity (units per labor hour)
- Shipping Accuracy Rate
Visualization Types:
- Real-time order status tracking
- Warehouse zone utilization heat maps
- Hourly/daily productivity trends
- Error rate tracking by warehouse location
Use Case: A warehouse manager monitors real-time order volume and labor productivity, reallocating staff to high-demand zones and identifying training needs based on error patterns. For manufacturers managing warehouse operations, see our manufacturing dashboard guide for production-specific metrics.
5. Transportation & Logistics
Purpose: Monitor shipment tracking, carrier performance, route efficiency and freight cost together, since optimising any one of them in isolation usually moves the cost into another.
Key Metrics:
- On-Time Delivery Rate
- Average Transit Time by Route
- Freight Cost per Unit
- Carrier Performance Score
- Shipment Tracking Accuracy
- Damage/Loss Rate in Transit
Visualization Types:
- Geographic maps showing shipment locations
- Carrier comparison scorecards
- Route optimization analysis
- Cost trend analysis by lane
Use Case: A logistics coordinator tracks carrier performance across regions, identifying underperforming carriers and negotiating service improvements or switching providers.
6. Demand Planning & Forecasting
Purpose: Improve forecast accuracy, align production with demand, and reduce inventory obsolescence.
Key Metrics:
- Forecast Accuracy Rate
- Demand Variability (Coefficient of Variation)
- Forecast Bias (over/under-forecasting trends)
- Planning Cycle Time
- SKU-Level Forecast Performance
Visualization Types:
- Actual vs. forecast comparison charts
- Demand pattern analysis (seasonal, trending)
- Forecast error distribution
- Statistical accuracy metrics by product category
Use Case: A demand planner reviews forecast accuracy monthly, identifying products with persistent forecast errors and adjusting forecasting models or parameters.
7. Cost & Financial Performance
Purpose: Track procurement spend, logistics expense, inventory carrying cost and operational overhead as one picture, because a saving in one of the four is often a transfer into another rather than a reduction.
Key Metrics:
- Total Landed Cost per Unit
- Cost to Serve by Customer/Region
- Freight Cost as % of Sales
- Inventory Carrying Cost
- Procurement Spend by Category
- Cost Variance vs. Budget
Visualization Types:
- Waterfall charts showing cost build-up
- Spend analysis by category
- Cost trend lines with budget comparisons
- Variance analysis dashboards
Use Case: A supply chain finance analyst monitors cost trends quarterly, identifying categories exceeding budget and working with operations teams to implement cost reduction initiatives.
For Supply Chain SaaS, a Customer-Facing Dashboard Has Become the Expectation Rather Than the Extra
For B2B supply chain SaaS companies and logistics service providers, offering customer-facing dashboards has become a competitive necessity. Modern embedded analytics platforms enable you to provide clients with real-time visibility into their shipments, inventory, and performance metrics without building dashboards from scratch.
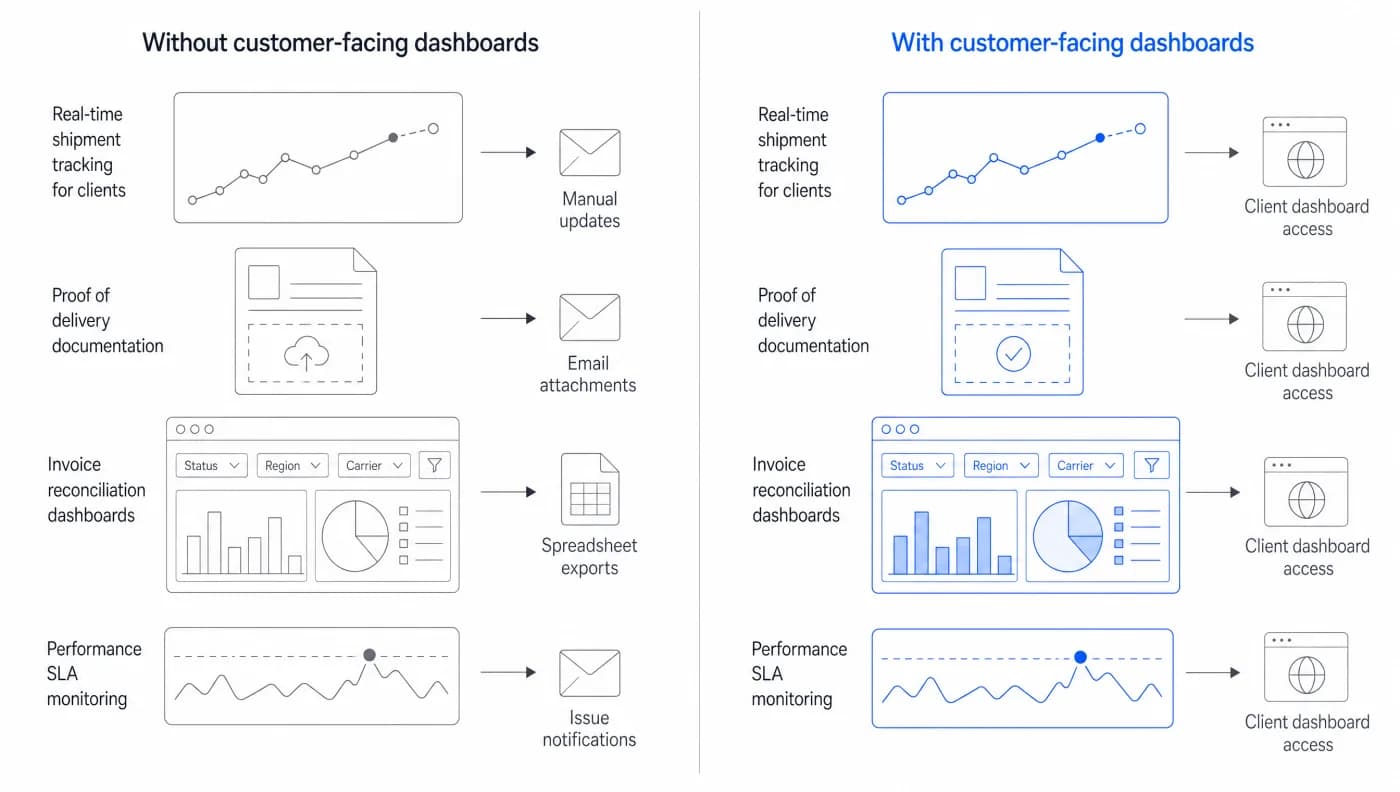
Customer-Facing Dashboard Use Cases:
For 3PLs & Freight Forwarders:
- Real-time shipment tracking for clients
- Proof of delivery documentation
- Invoice reconciliation dashboards
- Performance SLA monitoring
For Warehouse Management Systems:
- Client inventory visibility across multiple warehouses
- Order status tracking and fulfillment metrics
- Billing transparency dashboards
- Warehouse capacity reporting
For Procurement Platforms:
- Supplier performance scorecards shared with buyers
- Spend analytics by category
- Contract compliance tracking
- Savings realization dashboards
By providing an embedded dashboard directly within your platform, you eliminate the need for customers to export data and build their own reports, significantly improving user experience and reducing support burden.
Supply chain SaaS companies offering embedded analytics treat visibility into operations as a core product differentiator rather than an add-on feature. We are not quoting a retention uplift, for the same reason given above: no benchmarking study we could find publishes its method.
Supply Chain KPIs Differ by Organisation, So the List Below Is a Starting Set
Understanding and tracking the right KPIs is essential for effective supply chain management. While every organization's needs differ, the following metrics form the foundation of most complete supply chain dashboards. For a focused breakdown, see the supply chain KPI dashboard guide.
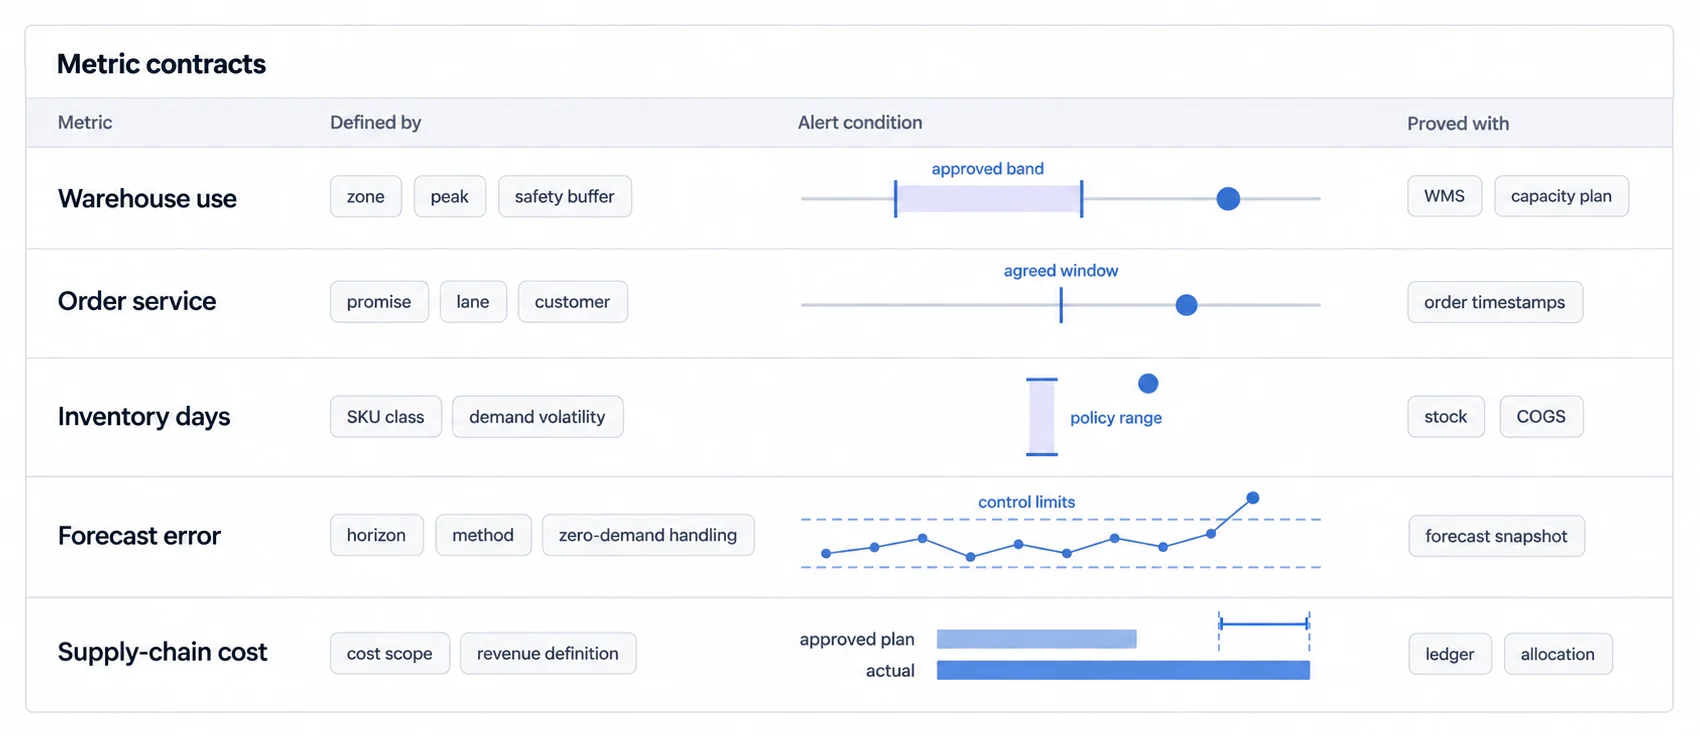
Supplier Performance KPIs
| KPI | Formula | Decision rule |
|---|---|---|
| Supplier On-Time Delivery | On-Time Deliveries / Total Deliveries | Define “on time” from the agreed delivery promise; segment by supplier and lane |
| Supplier Quality Rate | Accepted Units / Total Units Received | Set acceptance rules by item class and inspection policy |
| Supplier Lead Time Variance | Variation of Actual Lead Time | Compare with the approved planning buffer for the same lane and item class |
| Purchase Order Cycle Time | Time from PO Creation to Approval | Use the internal approval SLA for that order type and risk tier |
Inventory Management KPIs
| KPI | Formula | Decision rule |
|---|---|---|
| Inventory Turnover | Cost of Goods Sold / Average Inventory Value | Compare like-for-like item classes and the approved inventory policy |
| Days of Inventory | Average Inventory / COGS over a stated period | Set ranges by SKU class, replenishment lead time, and demand variability |
| Stock-Out Rate | Stockout Incidents / Eligible Demand Events | Define the demand event and alert from the service-level policy |
| Inventory Accuracy | Correct Counts / Total Counts | Set tolerance by count method, location, and item risk |
Logistics & Transportation KPIs
| KPI | Formula | Decision rule |
|---|---|---|
| On-Time Delivery Rate | On-Time Deliveries / Total Deliveries | Evaluate against the customer promise for the same service and lane |
| Freight Cost per Unit | Total Freight Cost / Units Shipped | Compare within a consistent unit, mode, lane, and surcharge scope |
| Average Transit Time | Sum of Transit Times / Number of Shipments | Pair with variation and the promised window for the route |
| Damage/Loss Rate | Damaged or Lost Units / Eligible Units | Set action levels by handling class, carrier terms, and loss policy |
Warehouse & Fulfillment KPIs
| KPI | Formula | Decision rule |
|---|---|---|
| Order Fill Rate | Complete Orders / Eligible Orders | Define complete and eligible from the customer promise |
| Pick Accuracy | Accurate Picks / Audited Picks | Set tolerance by item risk and audit method |
| Order Cycle Time | Time from Order Receipt to Shipment | Compare with the service promise for the order class |
| Warehouse Utilization | Used Capacity / Usable Capacity | Set an approved band by zone, peak buffer, layout, and safety constraints |
Financial & Cost KPIs
| KPI | Formula | Decision rule |
|---|---|---|
| Cash-to-Cash Cycle | DIO + DSO - DPO | Compare with the approved working-capital plan using consistent accounting periods |
| Total Supply Chain Cost | In-Scope Supply Chain Costs / Defined Revenue | Record the cost and revenue boundary; compare with the approved plan |
| Cost per Order | In-Scope Fulfillment Costs / Eligible Orders | Segment by order class and keep the allocation method stable |
| Inventory Carrying Cost | Defined Carrying Costs / Average Inventory Value | Build from the organization's capital, storage, service, and risk cost policy |
External benchmarks can provide context, but they do not define an operational target. Record each metric's formula, scope, direction, segment, owner, review window, action threshold, and evidence source. Approve the target against your service commitments, constraints, baseline, and risk policy before using it as a status colour.
Dashboard Design Best Practices
1. Prioritize Visual Clarity
Effective data visualization is critical for supply chain dashboards where users need to make rapid decisions based on real-time information. Follow these visualization principles:
Use the Right Chart Types:
- Scorecards: For high-level KPI summaries (on-time delivery %, inventory turnover)
- Line Charts: For trends over time (shipment volume, cost trends)
- Bar Charts: For comparisons across categories (supplier performance, warehouse productivity)
- Heat Maps: For geographic or zone-based analysis (regional delivery performance)
- Gauge Charts: For metrics with clear targets (capacity utilization, SLA compliance)
Status Coding Strategy:
- Normal: Within the metric's approved operating band
- Watch: A documented early-warning condition has been met
- Act: The owner must follow the linked response procedure
Do not assume that “higher is better”: excess utilization, inventory, or speed can introduce different risks. Pair colour with a text label or icon, and define thresholds by metric direction, segment, decision window, and action owner.
2. Design for Different User Roles
Supply chain dashboards serve diverse stakeholders with different information needs. Understanding the various dashboard types helps ensure each role gets the insights they need:
Executive Level:
- High-level KPI scorecards showing overall supply chain health
- Exception-based reporting (only show issues requiring attention)
- Strategic metrics (ROI, cost ratios, customer satisfaction)
- Weekly/monthly trend analysis
Operations Managers:
- Detailed performance breakdowns by location/product/supplier
- Historical comparisons and variance analysis
- Drill-down capabilities to root causes
- Daily/hourly operational metrics
Frontline Staff:
- Task-oriented views (orders to pick, shipments to process)
- Simple, action-focused layouts with minimal clutter
- Mobile-optimized for warehouse floor access
- Real-time status updates
3. Enable Real-Time Monitoring
Supply chain disruptions require immediate response. Ensure dashboards display real-time or near-real-time data for:
- Shipment tracking and delivery status
- Warehouse operations and order fulfillment
- Inventory levels and stock movements
- Supplier performance alerts
Batch updates (daily/weekly) are acceptable for:
- Historical trend analysis
- Financial cost reporting
- Long-term forecast accuracy metrics
Avoid mixing real-time operational metrics with static historical data in the same view without clear visual distinction. Users need to know instantly which data is current and which is historical.
4. Implement Exception-Based Alerting
Configure dashboards to highlight exceptions automatically:
- Supplier delivery performance breaching the agreed service window
- Inventory levels approaching stockout or excess
- Transportation costs breaching the approved variance rule
- Order fulfillment errors above acceptable rate
Use progressive alert escalation:
- Visual indicator on dashboard (color change, icon)
- Email notification to responsible manager
- SMS/mobile alert for critical issues requiring immediate action
- Automated workflow triggering corrective actions
5. Focus on Actionable Metrics
Display metrics that drive decisions, not just interesting data points:
Actionable: Supplier on-time delivery rate by vendor (can switch suppliers) Non-Actionable: Historical average delivery time across all suppliers (no clear action)
Actionable: Inventory turnover by SKU category (can adjust purchasing) Non-Actionable: Total inventory value (no specific action)
Actionable: Route-specific transportation costs (can optimize routes) Non-Actionable: Overall freight spend (too broad to act on)
Building Custom and Adopting a Platform Differ in What You Keep Owning Afterwards
Organizations face a critical decision when implementing supply chain dashboards: build custom solutions in-house or adopt embedded analytics platforms. Understanding the trade-offs is essential for making the right choice.
Building In-House Means Owning the Delivery Scope and Everything That Follows It
Initial Delivery Scope:
- Data contracts, ingestion, metric definitions, and reconciliation
- Tenant isolation, authorization, embedding, and product integration
- Dashboard UX, accessibility, exports, observability, and acceptance testing
- Loaded internal cost based on the people and elapsed time actually assigned
Ongoing Ownership:
- Infrastructure capacity, upgrades, backups, recovery tests, and incidents
- Security patches, access reviews, audit evidence, and dependency changes
- Support, metric changes, tenant migrations, and product compatibility
- Recurring cost measured from invoices and loaded owner time
When Building Makes Sense:
- You have highly specialized visualization requirements not available in any platform
- You already have a large engineering team with available bandwidth
- You need 100% control over data infrastructure and security
- Your supply chain dashboard IS your core product differentiator
An Embedded Platform Moves the Work From Building Into Evaluation and Rollout
Evaluation and Rollout:
- Prove the highest-risk integration, tenant boundary, and workflow first
- Define production acceptance criteria for security, performance, accessibility, and operations
- Roll out by audience only after data reconciliation and owner sign-off
Cost Structure:
- Capture the vendor's current quote and the exact meter it uses
- Add implementation, internal administration, support, and migration work
- Record which operational and security responsibilities remain with your team
When Embedded Platforms Make Sense:
- You need to ship dashboards quickly (weeks, not months)
- Your engineering team should focus on core product development
- You want white-label, customer-facing dashboards without custom builds
- You need professional features (PDF export, scheduling, mobile apps) out-of-box
An embedded platform can transfer some hosting, upgrade, security, and multi-tenant product work to the provider, but the customer still owns data correctness, authorization design, integration, acceptance, and vendor oversight. Quantify the difference with a scoped proof and your own delivery records rather than a headline speed multiple.
Industry-Specific Supply Chain Dashboards
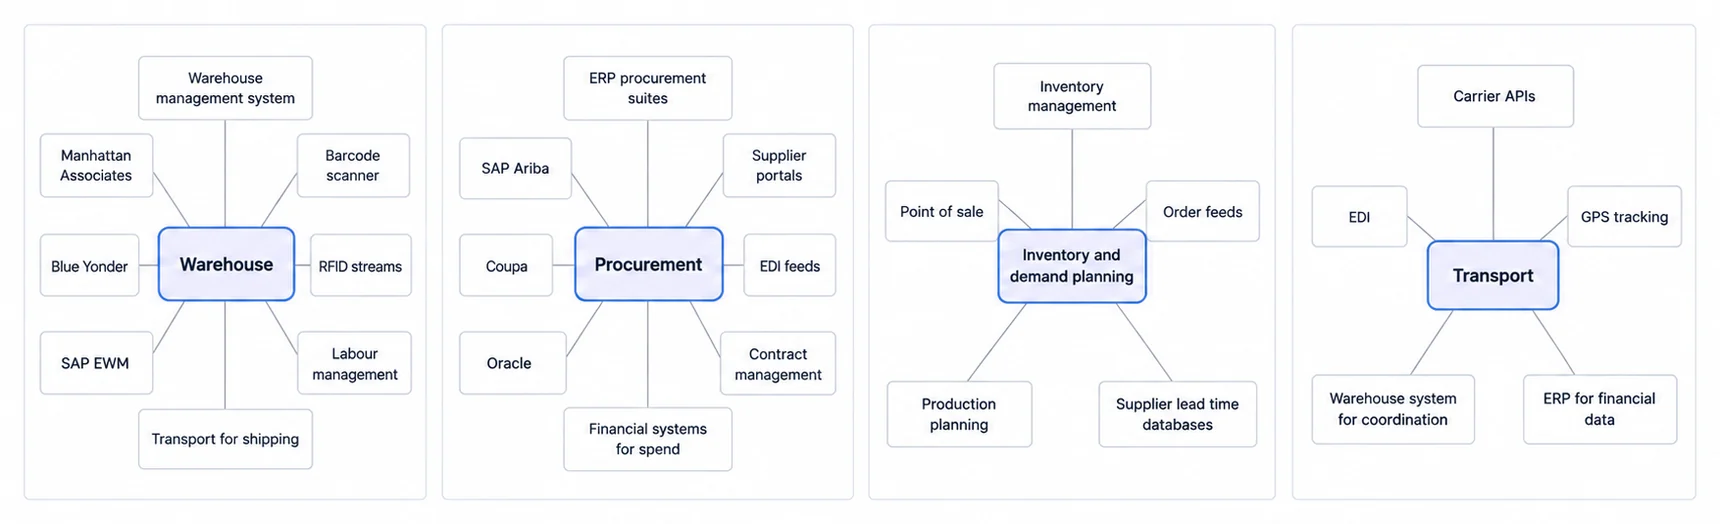
Warehouse Management Systems (WMS)
Core Dashboard Components:
- Real-time warehouse occupancy and utilization
- Picking/packing efficiency by zone and operator
- Inbound/outbound shipment tracking
- Labor productivity dashboards
- Quality control and accuracy metrics
Integration Requirements:
- WMS API integration (Manhattan Associates, Blue Yonder, SAP EWM)
- Barcode scanner and RFID data streams
- Labor management systems
- Transportation management systems (for shipping)
Customer-Facing Features:
- Inventory visibility for clients across multiple warehouses
- Order status tracking with estimated fulfillment times
- Proof of delivery and documentation
- Billing transparency with detailed breakdowns
For WMS providers, offering [embedded analytics use cases directly in your platform transforms a feature-parity requirement into a competitive differentiator that drives customer retention.
Procurement & Sourcing Software
Core Dashboard Components:
- Supplier performance scorecards (on-time delivery, quality, cost)
- Spend analysis by category, supplier, and business unit
- Contract compliance tracking
- Savings realization dashboards
- Risk monitoring (supplier concentration, geopolitical risks)
Integration Requirements:
- ERP integration (SAP Ariba, Coupa, Oracle Procurement)
- Supplier portals and EDI feeds
- Contract management systems
- Financial systems for spend data
Customer-Facing Features:
- Buyer-specific spend analytics
- Supplier performance visibility for procurement teams
- Contract renewal reminders and compliance alerts
- Savings opportunity identification
Procurement platforms benefit from white label analytics that can be customized with client branding, ensuring the dashboard experience feels native to each customer's procurement workflow.
Inventory & Demand Planning Systems
Core Dashboard Components:
- Forecast accuracy tracking by SKU and time period
- Inventory turnover and aging analysis
- Demand variability metrics
- Safety stock recommendations
- Replenishment planning dashboards
Integration Requirements:
- Inventory management systems
- Point-of-sale (POS) or order data feeds
- Production planning systems
- Supplier lead time databases
Customer-Facing Features:
- Inventory visibility across locations
- Demand forecast sharing with suppliers
- Replenishment recommendations
- Stockout risk alerts
Demand planning platforms increasingly use real-time dashboard capabilities to provide instant visibility into inventory positions, enabling proactive replenishment decisions that prevent stockouts while minimizing excess stock.
Transportation Management Systems (TMS)
Core Dashboard Components:
- Shipment tracking and delivery performance
- Carrier performance scorecards
- Route optimization analysis
- Freight cost analysis by lane and mode
- Claims and damage tracking
Integration Requirements:
- Carrier APIs and EDI integrations
- GPS tracking systems
- WMS for warehouse coordination
- ERP for financial data
Customer-Facing Features:
- Real-time shipment tracking
- Delivery performance SLA monitoring
- Freight cost visibility and invoice reconciliation
- Proof of delivery access
Technology Stack for Supply Chain Dashboards
Frontend Technologies
Vendor Evaluation Criteria:
- React-Based Frameworks: For maximum flexibility and customization
- Pre-Built Component Libraries: To accelerate development
- Mobile Responsiveness: Essential for warehouse and field operations
- White-Label Capabilities: For customer-facing analytics products
Popular Frontend Choices:
- React: Most widely adopted, extensive ecosystem
- Next.js: Server-side rendering for performance
- Chart Libraries: Recharts, Chart.js, D3.js for visualizations
For supply chain SaaS companies embedding dashboards, choosing the right charting library is critical. Our React chart libraries guide compares options for performance, customization, and ease of implementation.
Backend & Data Integration
Core Requirements:
- API Gateway: For connecting to multiple data sources (ERP, WMS, TMS)
- Data Warehouse: Centralized analytics database (Snowflake, BigQuery, Redshift)
- ETL/ELT Pipeline: Real-time data synchronization
- Caching Layer: For fast dashboard load times
Multi-Tenant Architecture: Supply chain SaaS platforms serving multiple customers must implement multi-tenant analytics architecture to ensure data security and performance. Modern embedded analytics platforms handle this complexity automatically.
Embedding Approaches
iFrame Embedding:
- Pros: Simple implementation, isolated security context
- Cons: Limited styling control, performance overhead
- Use Case: Quick proof-of-concept, legacy system integration
For details on iframe embedding trade-offs, including security considerations and responsive design challenges, consult platform-specific documentation.
SDK Integration:
- Pros: Native look and feel, full customization, better performance
- Cons: More complex implementation, requires frontend expertise
- Use Case: Production deployments, white-label dashboards
Modern SDK integration approaches provide smooth embedding with minimal code. For example, Sumboard's SDK enables dashboard embedding with just a few lines of React code, handling authentication, theming, and responsive design automatically.
Recommendation: Start with iFrame for evaluation, migrate to SDK for production deployments where user experience is critical.
Embedded Analytics Platform Pricing
Typical Pricing Models:
Per-User Licensing:
- Meter: Named, active, creator, or viewer accounts as defined by the vendor
- Evaluate: Role mix, inactive-user policy, external viewers, and expected account growth
Flat-Rate Subscription:
- Meter: A contracted platform fee with stated feature and capacity limits
- Evaluate: What “unlimited” excludes, overage rules, environments, support, and renewal terms
Usage-Based Pricing:
- Meter: Queries, API calls, data volume, compute, sessions, or dashboard loads
- Evaluate: The billable event, caching behavior, workload peaks, and spend controls
No pricing meter is automatically the best fit for a supply chain SaaS product. Model the same expected creators, tenants, viewers, queries, data volume, environments, support level, and growth under each current quote. Compare that scenario with the scoped ownership ledger for an in-house build and an embedded analytics platform.
Implementation Best Practices
Step 1: Define Stakeholder Requirements
Conduct stakeholder interviews to identify:
- Which metrics each role needs to monitor
- Frequency of dashboard usage (real-time, daily, weekly)
- Decision-making processes supported by the dashboard
- Integration requirements with existing systems
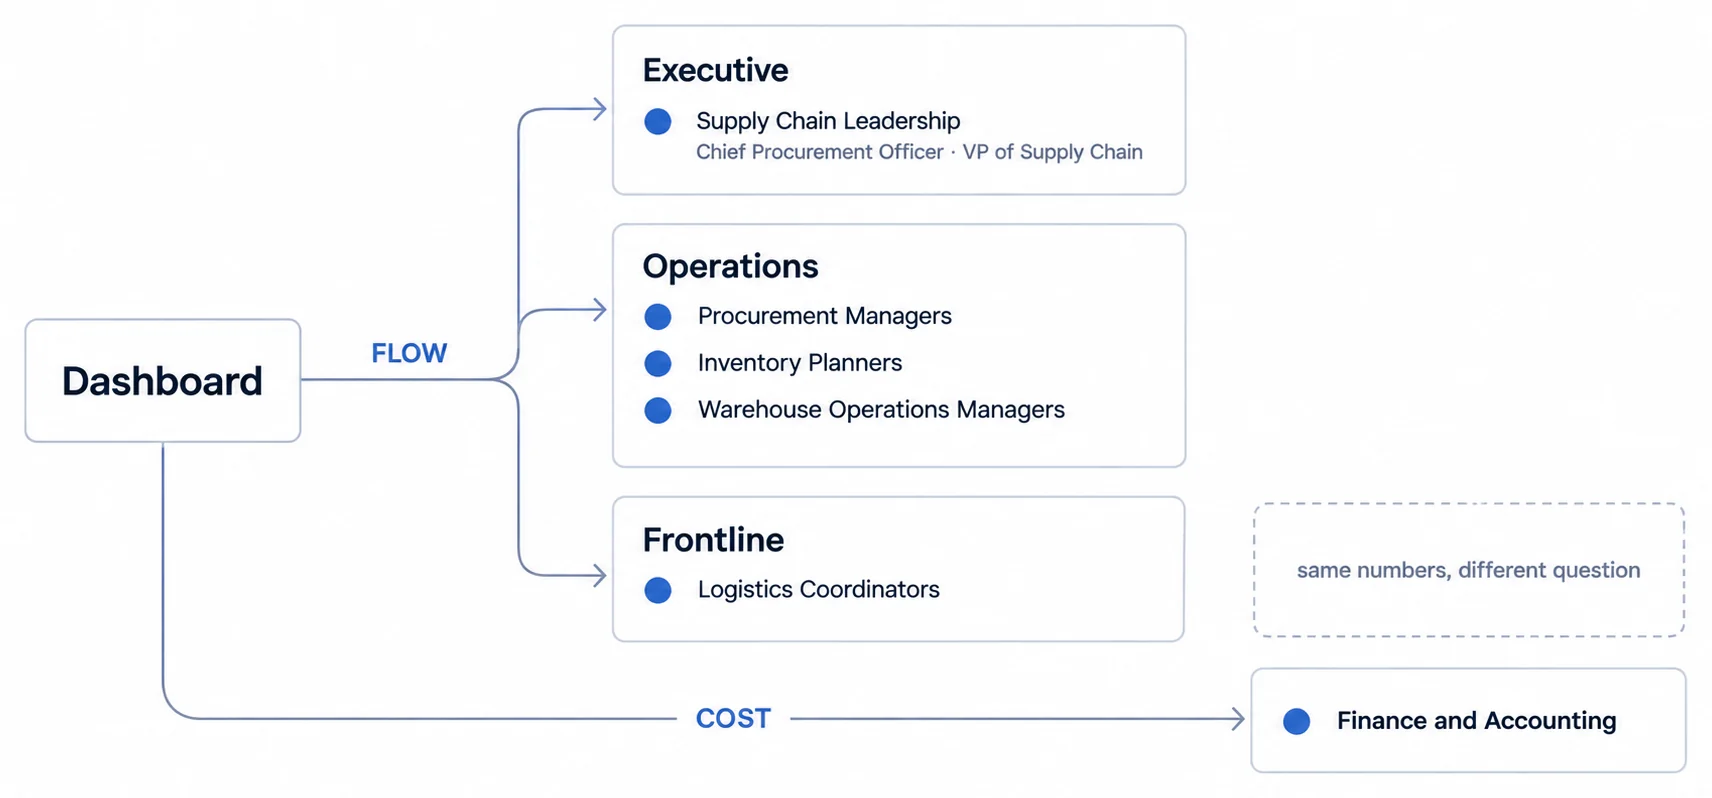
Key Stakeholders:
- Supply Chain Leadership (CPO, VP Supply Chain)
- Procurement Managers
- Inventory Planners
- Warehouse Operations Managers
- Logistics Coordinators
- Finance/Accounting Teams
Step 2: Establish Data Integration
Connect data sources across the supply chain network:
Core Systems:
- ERP (SAP, Oracle, Microsoft Dynamics)
- Warehouse Management System (WMS)
- Transportation Management System (TMS)
- Procurement/Supplier Management Platform
- Inventory Management System
External Data Sources:
- Supplier portals and EDI feeds
- Carrier tracking APIs
- Customer order systems
- Market demand data
Supply chain data often resides in siloed systems with inconsistent formats. Invest in data normalization and validation rules before building dashboards to ensure accuracy and reliability.
Step 3: Design Dashboard Hierarchy
Organize dashboards in a hierarchical structure:
Level 1 - Executive Overview: High-level scorecards showing overall supply chain health
Level 2 - Functional Dashboards: Procurement, Inventory, Logistics, Warehouse (separate views)
Level 3 - Detailed Analysis: Drill-down views for specific suppliers, SKUs, routes, or warehouses
Allow users to work through from high-level summaries to detailed analysis without switching systems.
Step 4: Configure Alerts and Notifications
Set up automated alerts for exception conditions:
- Email/SMS notifications for critical issues
- Dashboard visual indicators (color changes, icons)
- Escalation workflows for unresolved alerts
Alert Examples:
- Supplier delivery outside the contracted window
- Inventory below safety stock level
- Transportation cost outside the approved variance band
- Order fulfillment error rate breaching the service policy
Step 5: Implement Mobile Access
Enable mobile dashboard access for:
- Warehouse managers monitoring operations from the floor
- Logistics teams tracking shipments on the go
- Executives reviewing performance during travel
Optimize mobile views with:
- Simplified layouts prioritizing critical metrics
- Touch-friendly navigation
- Offline data caching for warehouse environments with connectivity issues
Common Challenges and Solutions
Challenge 1: Data Silos Across Systems
Problem: Supply chain data is fragmented across ERP, WMS, TMS, and supplier systems, making unified reporting difficult.
Solution: Implement a data integration layer (ETL/ELT process) that consolidates data into a centralized analytics database. Modern embedded analytics platforms can connect to multiple data sources and normalize data automatically, eliminating the need for custom integration code.
Challenge 2: Real-Time Data Latency
Problem: Some systems don't support real-time data extraction, causing dashboard metrics to be outdated during critical operations.
Solution: Prioritize real-time integration for high-velocity metrics (warehouse operations, shipment tracking) while accepting batch updates for slower-moving metrics (financial costs, long-term forecasts). Use visual indicators to show data refresh timestamps so users understand data recency.
Challenge 3: Inconsistent KPI Definitions
Problem: Different departments calculate the same KPI differently (e.g., "on-time delivery" measured at shipment vs. receipt).
Solution: Establish standardized KPI definitions across the organization. Document calculation methodologies and ensure all dashboard users understand how metrics are computed. Create a data dictionary accessible within the dashboard interface.
Challenge 4: White-Label Customization Complexity
Problem: Each customer demands different branding, terminology, and metric displays, making maintenance of customer-facing dashboards challenging.
Solution: Use embedded analytics platforms with built-in white-labeling capabilities. These platforms allow you to configure branding, color schemes, and terminology without code changes. However, some organizations still face challenges.
Challenge 5: User Adoption Resistance
Problem: Supply chain teams continue using spreadsheets or legacy reports instead of adopting new dashboards.
Solution:
- Involve end users in dashboard design from the beginning
- Provide hands-on training tailored to each role
- Demonstrate quick wins (e.g., time saved, issues identified early)
- Ensure dashboards are faster and easier than existing tools
- Identify internal champions who can advocate for adoption
Pilot dashboards with a small group of power users who can become internal champions. Their success stories and feedback will drive broader adoption across the organization.
Challenge 6: Dashboard Overload
Problem: Users face too many metrics and visualizations, making it difficult to focus on what matters.
Solution: Start from the decisions and exceptions the audience owns. Give every primary metric a definition, action owner, and direct route to supporting evidence. Remove sections that have no associated decision, and test whether users can reach the evidence they need without losing filter and time context.
Future Trends in Supply Chain Dashboards (2026 and Beyond)
1. AI-Powered Predictive Analytics
Modern supply chain dashboards are incorporating machine learning to:
- Predict supplier delivery delays based on historical patterns and external signals
- Forecast demand spikes using weather, events, and market trends
- Recommend optimal reorder points dynamically based on demand variability
- Identify anomalies in cost or performance automatically without manual rules
Organizations implementing AI-powered analytics in supply chain dashboards aim at better forecast accuracy and lower safety stock at the same service level. We are not quoting a figure for either: the size depends on how volatile your demand already is, and a number from somebody else's demand curve would not transfer.
2. Blockchain Integration for Traceability
Distributed ledger technology is enabling:
- End-to-end product traceability across multi-tier supplier networks
- Automated provenance verification for compliance (food safety, pharmaceuticals)
- Smart contract-based supplier performance penalties/rewards
- Tamper-proof documentation for regulatory audits
Use Case: A pharmaceutical company uses blockchain-integrated dashboards to track temperature-controlled shipments from manufacturing through distribution, automatically alerting if cold chain breaks occur.
3. IoT Sensor Data Integration
Real-time sensor data from:
- Warehouse IoT: Automated inventory tracking via RFID/beacons
- Transportation IoT: GPS tracking, temperature monitoring, shock detection
- Supplier IoT: Production status, quality metrics, capacity utilization
Dashboards now display sensor alerts alongside traditional metrics for complete visibility. For example, a food distributor's dashboard shows not just "shipment en route" but real-time temperature data ensuring refrigerated goods remain within safe ranges.
4. Collaborative Supply Chain Networks
Cloud-based dashboards enabling:
- Shared visibility between buyers and suppliers
- Collaborative forecasting and planning (CPFR models)
- Multi-party KPI tracking (e.g., joint delivery performance goals)
- Integrated exception management workflows across organizations
Example: An automotive manufacturer shares production schedules and component demand forecasts with tier-1 suppliers via a shared dashboard, enabling suppliers to optimize their own procurement and production plans proactively.
5. Sustainability & ESG Metrics
Supply chain dashboards increasingly track:
- Carbon footprint per shipment/product (Scope 3 emissions)
- Supplier ESG compliance scores
- Packaging waste reduction progress
- Circular economy metrics (recycling, reuse rates)
- Ethical sourcing and labor practice indicators
By 2026, leading companies are integrating sustainability KPIs directly into procurement scorecards, making environmental impact a core supplier selection criterion alongside cost and quality. Regulatory requirements (EU CSRD, SEC climate disclosure rules) are accelerating this shift.
Use Cases by Industry Vertical
For Supply Chain SaaS Companies
If you're building supply chain management software, offering embedded analytics platforms directly within your product is no longer optional. It's expected. Customers demand visibility into their operations without switching between systems.
Implementation Strategy:
- Embed dashboards within your core workflow (procurement portal, WMS interface, TMS)
- Enable white-label customization so dashboards match each customer's branding
- Provide role-based access controls (executives see high-level metrics, operations see details)
- Offer self-service reporting so customers can create custom views without support tickets
Business Impact:
- Reduced Churn: Customers stay because switching means losing familiar analytics
- Increased ARPU: Premium analytics tiers drive upsell opportunities
- Lower Support Costs: self-service dashboards move the "where's my data?" question from your inbox to a screen the customer already has open
Organizations facing build vs buy embedded analytics decisions should evaluate: Do you want to be a software company or an analytics company? If your core value is supply chain automation, buy analytics infrastructure so your team can focus on differentiated features.
For 3PLs & Logistics Service Providers
Third-party logistics providers benefit from offering customer dashboards that provide:
- Real-time shipment tracking with estimated delivery times
- Warehouse inventory visibility across multiple facilities
- Billing transparency and invoice reconciliation
- Performance SLA monitoring and exception alerts
Customer Retention Impact: When 3PLs embed analytics, clients view the relationship as strategic partnership rather than transactional service. Data visibility creates switching costs, clients would lose operational insights if they changed providers.
For cross-selling opportunities, consider linking supply chain dashboards to complementary verticals. For example, if serving e-commerce clients, offer retail dashboard capabilities showing not just logistics performance but also sales trends and inventory turnover insights.
For ERP & Enterprise Software Vendors
ERP platforms increasingly need supply chain-specific analytics modules:
- Procurement spend analysis
- Inventory optimization dashboards
- Supplier performance monitoring
- Financial supply chain metrics (DPO, DSO, cash-to-cash cycle)
Integration Strategy: Rather than building from scratch, ERP vendors can embed analytics platforms that handle visualization, mobile optimization, and white-labeling while the ERP focuses on transactional data integrity and workflow automation.
Build Supply Chain Dashboards Around Visibility, Response, and Cost Control
Supply chain dashboards have evolved from simple reporting tools into strategic platforms that drive operational excellence. By providing real-time visibility across procurement, inventory, logistics, and fulfillment, these dashboards enable proactive management, cost optimization, and rapid response to disruptions.
Successful implementation requires:
- Clear stakeholder requirements and standardized KPI definitions
- Reliable data integration across siloed systems (ERP, WMS, TMS, supplier portals)
- User-centric design tailored to different roles (executives vs. operations vs. frontline)
- Continuous refinement based on operational feedback and changing business needs
Whether you're optimizing supplier relationships, reducing inventory carrying costs, improving delivery performance, or managing warehouse operations, a well-designed supply chain dashboard transforms data into actionable insights that drive measurable business outcomes.
For supply chain SaaS companies, embedded analytics is no longer a differentiator. It's table stakes. The question is not whether to offer dashboards, but whether to build or buy. The economics increasingly favor embedded platforms that accelerate time-to-market while reducing total cost of ownership.
Ready to launch customer-facing analytics?
Stop losing customers to competitors with better analytics. Sumboard's customer-facing analytics platform lets you launch self-service dashboards in days, not months.