

Real-Time Analytics Definition and Latency Expectations
Real-time analytics is the practice of collecting, processing, and analyzing data instantly as it's generated, enabling businesses to gain immediate insights and make faster decisions without delay.
Unlike traditional batch analytics that processes data at scheduled intervals (hourly, daily, or weekly), real-time analytics delivers insights within seconds of data creation, allowing organizations to respond to opportunities or threats as they happen.
What Makes Analytics Real-Time Instead of Batch Reporting
Real-time analytics combines streaming data processing with instant visualization to deliver insights the moment data enters your system. For B2B SaaS platforms, this means your customers can monitor live metrics, detect anomalies immediately, and trigger automated responses without waiting for scheduled reports.
There are two primary types of real-time analytics:
On-demand real-time analytics waits for users to submit a query, then instantly processes current data to deliver results. This approach works well for interactive dashboards where users explore data at their own pace.
Continuous real-time analytics proactively monitors incoming data streams and automatically alerts users or triggers actions when specific conditions are met, such as fraud detection systems that block suspicious transactions instantly.
Real-Time Analytics Requirements for Reliable Live Dashboards
Real-time analytics platforms must deliver:
- Minimal latency: Processing data within seconds (not minutes or hours) of generation
- Streaming architecture: Continuous data ingestion from multiple sources simultaneously
- Instant visualization: Dashboard updates reflect current data without manual refresh
- Automated responses: Trigger alerts, notifications, or actions based on real-time conditions
- High availability: Systems must handle large data volumes while maintaining fast query performance
- Multi-tenant isolation: Secure data separation when embedding analytics in customer-facing products
Real-Time Analytics for SaaS Products
For B2B SaaS companies, embedding real-time analytics into your product transforms how customers interact with their data. Instead of exporting CSV files or waiting for overnight batch processes, users get instant visibility into their business operations.
Common use cases include financial dashboards showing live transaction data, manufacturing dashboards tracking equipment performance, and customer-facing analytics products monitoring user engagement metrics as events occur. For a dedicated implementation reference, see real-time data visualization and the streaming dashboard architecture guide.
The competitive advantage comes from speed, companies using real-time analytics can identify fraud within seconds, optimize inventory before stockouts occur, and personalize customer experiences during active sessions rather than hours later.
Real Time Is a Deadline, Not a Speed
The useful definition is not a number of seconds. It is whether the data arrives before the decision has to be made, which means the requirement comes from the decision rather than from the pipeline.
An incident console where someone must respond within minutes has a real deadline, and missing it has a cost. A weekly review does not become better analysis when its numbers update every second; it becomes a page that changes while someone is reading it. Asking "what decision is waiting on this, and how long does it have" replaces an argument about architecture with a specification.
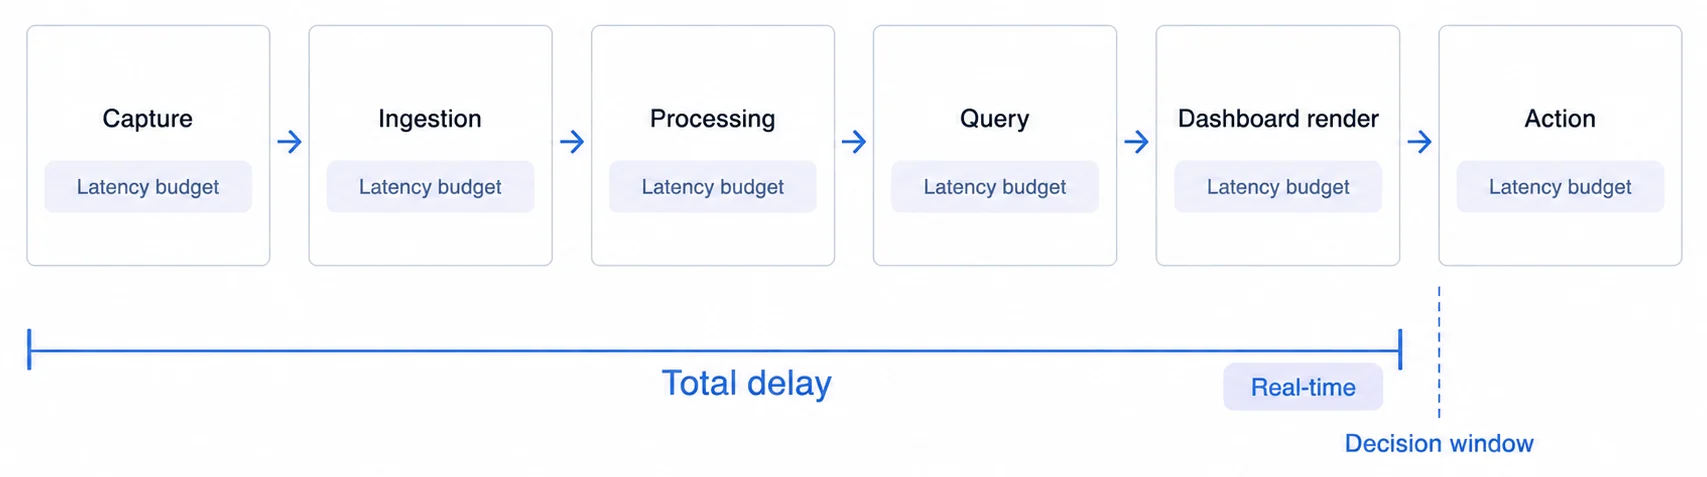
The Latency a User Feels Is a Sum, and the Refresh Interval Is One Term in It
A dashboard set to refresh every five seconds can still show data that is ten minutes old, and the setting gives no indication of that.
The path has several stages and each adds delay: the event occurring, its capture and transmission, ingestion, transformation, any aggregation or cache, query execution, and finally rendering in a browser. Measuring the total from source event to visible result is the only number that answers the user's question. Optimising the last stage while an upstream one dominates is the most common way a team spends money without changing what anyone sees. The streaming dashboard architecture notes work through where the time usually goes.
A Live Number Without a Timestamp Cannot Be Told Apart From a Stalled One
This is the failure mode specific to live data, and it is worse than being slow. A stopped pipeline and a genuinely quiet period render identically: a number that is not changing.
The interface has to distinguish them. Show when the data was last updated rather than when the page last redrew, mark the view explicitly when the feed is degraded or reconnecting, and prefer a visible stale state over a confident stale number. A user who knows the data is ten minutes old can decide what to do about it. A user looking at a stale number they believe is current cannot.
Real Time Costs More Than Fresh Enough, and the Gap Is Wider Than It Looks
Continuous processing is not simply a faster version of batch. It brings always-on compute rather than scheduled compute, a query rate that scales with how many people leave a dashboard open, state that has to survive restarts and replays, and an on-call expectation, since a pipeline that stops during the night is only useful if somebody finds out.
That is worth paying where a deadline justifies it. It is worth checking first, because a micro-batch running every minute meets a surprising number of stated real-time requirements at a fraction of the operating cost, and the difference between one second and one minute is invisible to most decisions while being very visible on an invoice.
Establish the deadline, then buy the cheapest architecture that clears it.
Related Real-Time Analytics Concepts and Architecture Guides
- Headless BI guide: the metrics layer underneath all of this, and what each exposure route leaves you owning.
- What live dashboards need that periodic ones do not, from refresh behaviour to what a stale panel should say
- Operational dashboards guide, which is what most real-time requests are really asking for
- Automated insights dashboards, the step after the number moves
- Dashboard Types, which dashboard format fits which use case
- Real-Time Dashboard, guide to building streaming dashboards
Real-Time Analytics for Your Product
Streaming dashboards that state their own freshness, so a quiet feed is never mistaken for a current one.