Freshness is valuable only when it changes a decision before the next update would arrive. A delayed operational state can be unacceptable while a daily strategic metric can be correct and useful. Real-time dashboard design therefore starts with the decision window and source semantics, not an assumption that every user expects instant motion.
This guide covers real-time dashboard fundamentals, technical architecture, implementation strategies, and why embedded analytics platforms matter for B2B SaaS companies deploying customer-facing real-time streaming at scale.
What is a Real-Time Dashboard?
A real-time dashboard makes source changes visible within a freshness budget defined by the decision it supports, while preserving ordering, authorization, failure recovery, and a clear indication of stale or partial state.
“Real-time,” “near-real-time,” and “batch” are not standards with universal boundaries. Define a measurable source-to-visible service level and failure behavior. A sales metric may tolerate a longer window than a machine-stop alert; the correct boundary comes from the action and cost of stale information.
A live surface needs source acquisition, transformation, delivery, and client-state contracts, but each layer has alternatives. Change data capture, webhooks, polling or scheduled queries may acquire changes; a broker may or may not be necessary; delivery can use polling, SSE, WebSockets or another channel. Dashboard types serve different decisions, and the freshness budget can differ by panel.
Customer-facing implementations must also prove tenant isolation, identity propagation, branding, accessibility, embedding lifecycle, load boundaries, exports and observability. A purpose-built embedded analytics platform can own some of that surface, but the exact boundary must be verified in the selected product and edition.
Real-Time vs Near-Real-Time vs Batch Processing
| Delivery pattern | Example decision window | Candidate use | Contracts to prove |
|---|---|---|---|
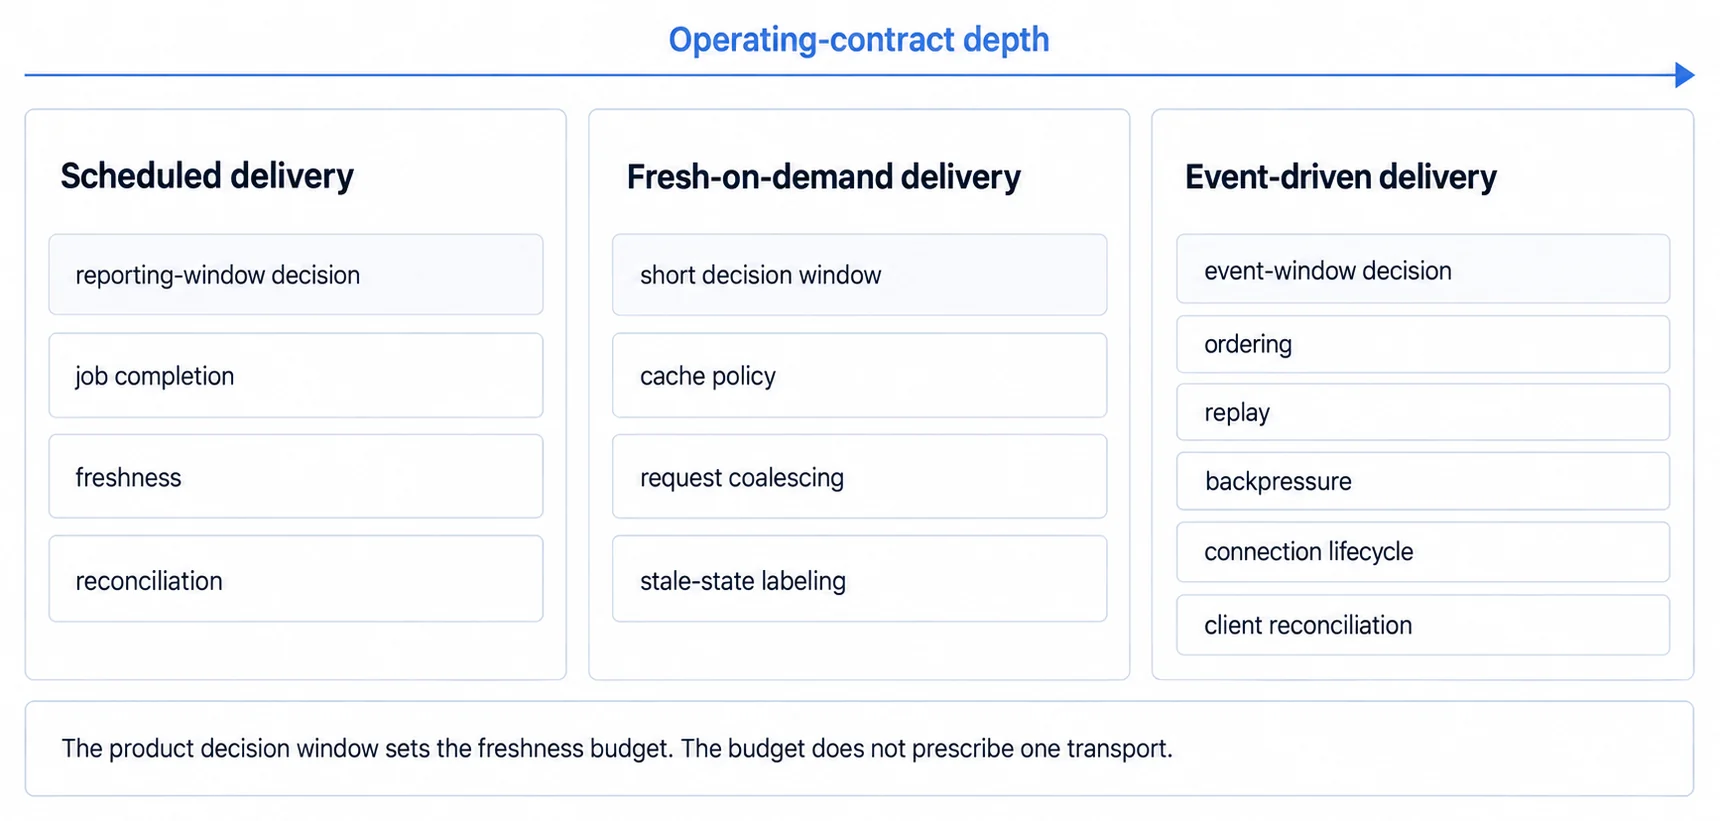
| Event driven | Event-window action | Dispatch, machine state, transaction monitoring | Ordering, replay, backpressure, connection lifecycle, client reconciliation |
| Fresh on demand | Short-window action | Queues, usage, operational summaries | Cache policy, request coalescing, stale-state labeling |
| Scheduled | Reporting-window action | Period close, review packs, historical trends | Job completion, freshness, reconciliation |
These are delivery patterns, not fixed latency classes. Event-driven delivery may be justified when an action must follow a source event within a measured window. Fresh-on-demand delivery can serve a short-window decision through polling, caching or revalidation. Scheduled delivery remains correct when the decision follows a reporting cycle.
Faster freshness can add ordering, replay, fan-out, connection, reconciliation and recovery obligations, but no single component list is mandatory. Record the actual source, decision, load and failure contract before selecting a delivery pattern.
Cost follows the contracts the team must implement and operate. Match refresh frequency to the action window, then measure the complete source-to-visible distribution, including the slow tail, rather than assigning one cadence to an industry label.
Core Components of Real-Time Dashboards
A live dashboard must cover six responsibilities even when some share infrastructure: source acquisition, transformation, current-state access, delivery, client reconciliation, and failure recovery. Change Data Capture (CDC), webhooks, event subscriptions, polling, and scheduled queries are alternative acquisition mechanisms. Kafka, Kinesis, or Pub/Sub are candidates when a brokered stream fits the delivery and replay contract.
WebSockets provide bidirectional browser-server communication; SSE provides a server-to-client event stream; polling remains viable when its request and freshness budgets pass. The stable WebSocket interface does not provide automatic backpressure, so a design must decide what happens when messages arrive faster than the client processes them. Connection state includes authentication refresh, reconnect jitter, resubscription, missed-event recovery and lifecycle across servers.
A current-state store or cache can reduce repeated computation when its invalidation and tenant scope are correct. The client may apply snapshots, deltas, or both; it must reconcile gaps and duplicates before updating a data visualization. Measure bandwidth, CPU, memory, frames and correctness rather than assuming delta updates are always cheaper.
Error handling and reconnection logic must define behavior for network interruptions, server restarts, authorization expiry and browser state changes. Heartbeats, health monitoring, retry jitter, snapshots, replay or polling fallback are candidates; test recovery without duplicate, missing or cross-tenant state.
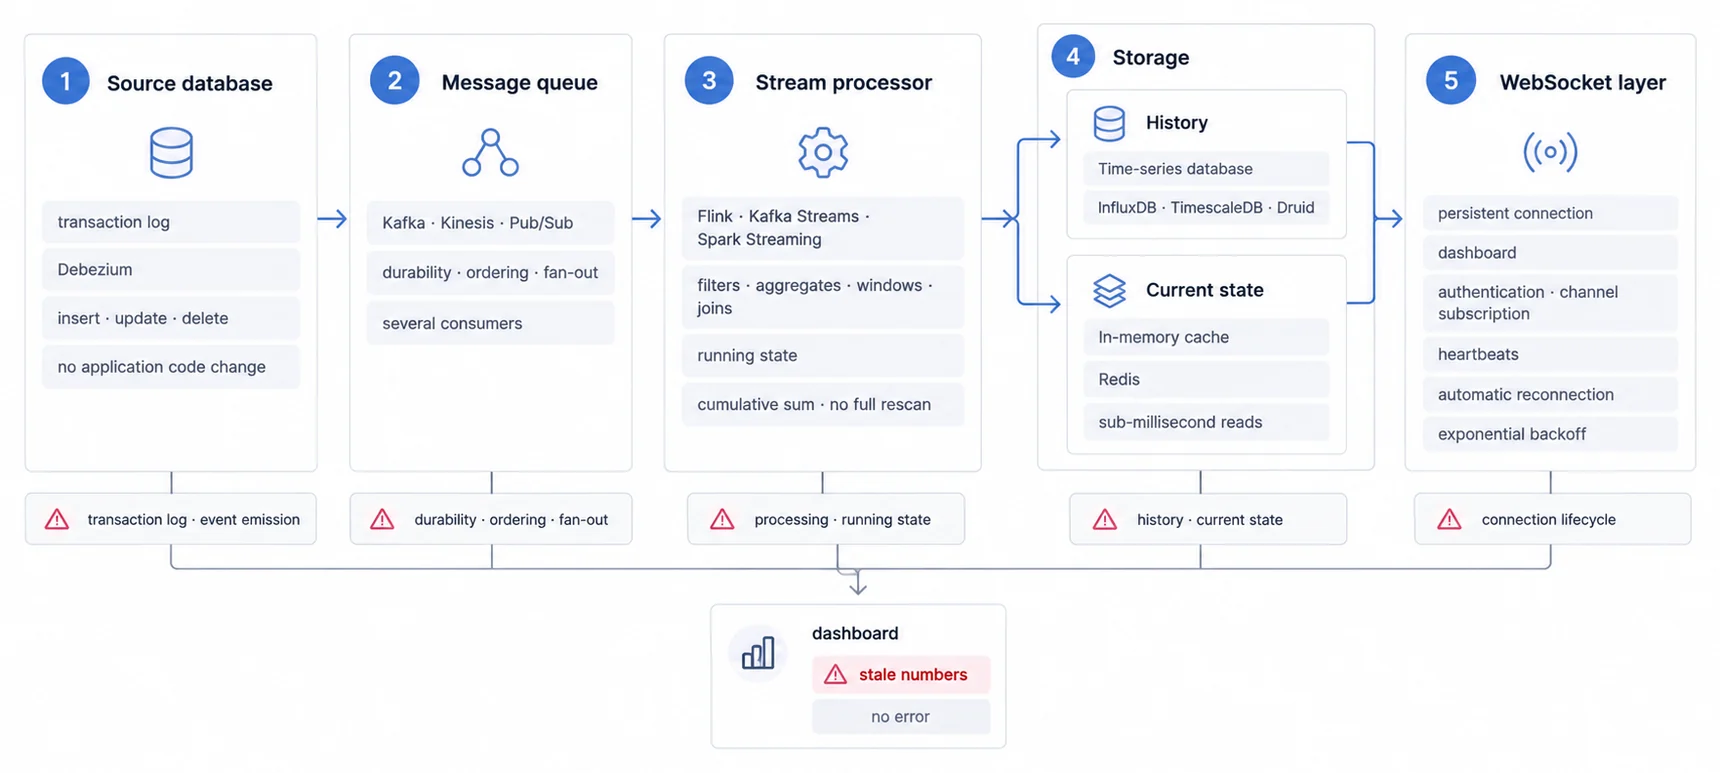
Production-grade real-time dashboards separate data ingestion, stream processing, and client communication into independent layers. This architectural separation enables horizontal scaling, allows different update frequencies per dashboard component, and isolates failures, streaming pipeline issues don't crash WebSocket servers, and client disconnections don't impact data ingestion.
How Real-Time Dashboards Work (Technical Overview)
A live-data flow can be direct or brokered. Sources may emit events, expose webhooks, accept polling, or publish change logs. A message queue or event stream adds persistence, replay, fan-out and operational contracts when the product needs them; it is not present in every implementation.
A stream processing layer (Apache Flink, Spark Streaming, or Kafka Streams) transforms, aggregates, and enriches raw events, calculating running totals, applying windowing operations, or joining data from multiple sources. Processed events land in a fast-access data store optimized for real-time queries, often with separate hot/warm/cold storage tiers based on access patterns.
When PostgreSQL is the source, its official LISTEN and NOTIFY documentation describes asynchronous channel notifications to listening sessions. The contract includes commit timing, startup race handling, payload limits and queue behavior. A notification can signal that state changed; the application still owns authorization, durable state, replay and delivery to browser clients.
The client-side dashboard can apply a delta, request a new snapshot, or combine both. Record sequence or version information, reject stale state, recover gaps, and test whether incremental work actually improves the target device. Smoothness and correctness are measured outcomes, not properties conferred by the word “delta.”
API-first analytics architectures expose these streaming capabilities through standardized endpoints, making real-time data accessible to embedded dashboards, mobile apps, and third-party integrations without duplicating infrastructure.
Why Real-Time Dashboards Matter for B2B SaaS
For B2B SaaS companies, a fresher customer-facing state can support usage monitoring, operational response and transparent consumption. It can also add motion and infrastructure without improving a decision. Treat support reduction, retention and differentiation as hypotheses to measure in the product rather than guaranteed outcomes of a live label.
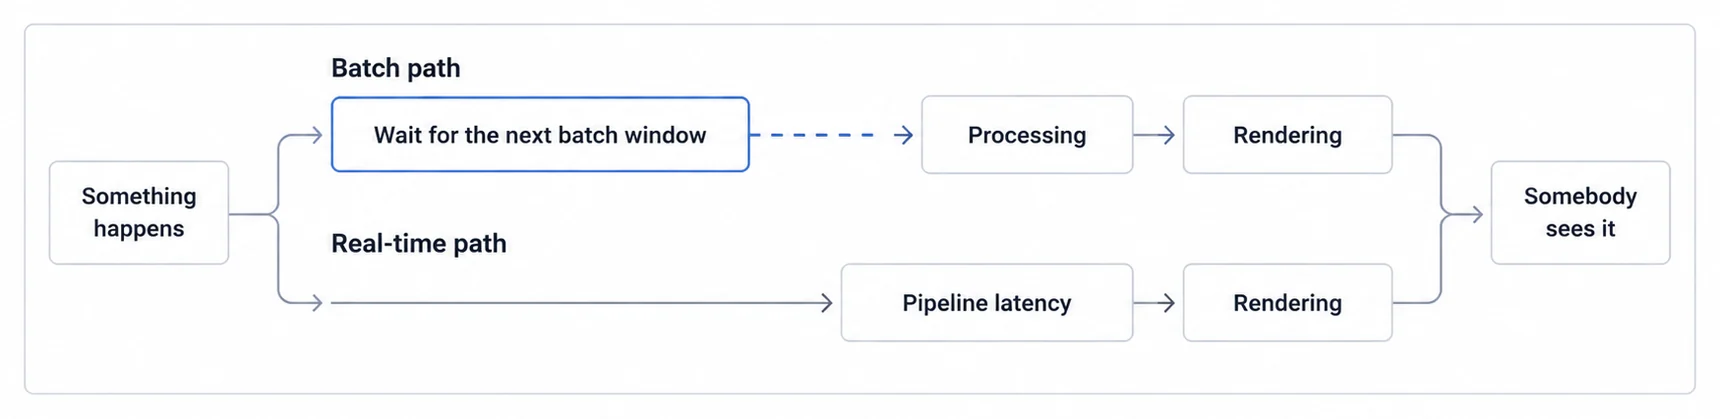
The economic case rests on a mechanism rather than a measurement. Real-time operational dashboards shorten detection and resolution time for a structural reason: the wait for the next batch is removed, so what remains is pipeline latency rather than a reporting cycle. We could not find a study measuring the size of that gain, so we are not putting a multiple on it. For customer-facing use cases, live data in a product demo does something a screenshot cannot: prospects watch the number move and understand they're buying modern infrastructure, not legacy batch processing.
Customer-Facing Use Cases
A customer-facing analytics product turns real-time dashboards from internal tools into revenue-generating product features. SaaS platforms embed usage analytics showing API calls, feature adoption, and resource consumption in real-time, helping customers optimize their own operations. E-commerce platforms provide seller dashboards with live sales, inventory levels, and customer behavior metrics.
Payment processors may display transaction volumes, success rates and settlement status within a fraud or operations response budget. White-label analytics can match the host product's brand when that is part of the customer-facing contract.
For B2B SaaS companies, real-time customer-facing dashboards take load off support, though we are not putting a percentage on it for the reason given above. Customers self-serve rather than emailing "what's my current usage?" questions. Transparency about resource consumption prevents surprise overages and reduces churn by making value visible continuously.
Operational Excellence and Monitoring
Real-time operational dashboards monitor system health, application performance, and business metrics across distributed infrastructure. DevOps teams track deployment pipelines, server health, error rates, and latency metrics with seconds of refresh. Site reliability engineering (SRE) practices depend on real-time visibility, mean time to detection (MTTD) drops from minutes to seconds when dashboards update continuously.
Embedded dashboardsolutions provide pre-built components for common operational metrics: request throughput, error rates, latency distributions, resource utilization. Engineering teams configure alerting thresholds and notification channels without building custom real-time infrastructure.
Data-Driven Decision Making
Experiment and campaign dashboards can surface accumulating data during execution, but freshness must not bypass sample-size, guardrail, attribution or statistical decision rules. A faster partial result is not automatically a faster valid decision.
Financial dashboards track revenue recognition, payment processing, and cash flow with real-time updates.
Types of Real-Time Dashboards
Different use cases demand different real-time dashboard architectures and update frequencies. Understanding these distinctions helps match technical implementation to business requirements and user expectations.
Financial and Trading Dashboards
Financial use cases have different budgets. An execution interface may require a measured sub-second path, while portfolio reporting may tolerate a longer validated window. Define market-data timestamps, ordering, entitlement, calculation, audit and stale-state behavior for each surface.
Payment processing dashboards track transaction volumes, approval rates, and settlement status in real-time. Fraud detection systems display suspicious activity patterns and automated decision outcomes as they occur. Cryptocurrency exchanges require ultra-low latency order books and trade history displays to maintain competitive positioning.
Operational Dashboards
Manufacturing dashboards may monitor throughput, quality, equipment state and inventory within a response budget derived from the process. Predictive-maintenance systems can surface deviations, but alert latency, false positives, acknowledgement and safe response behavior must be tested with the operating procedure.
Supply chain dashboards provide end-to-end visibility into logistics networks. Order status, shipment tracking, inventory levels, and delivery estimates update as events occur throughout the supply chain. Distribution centers monitor receiving, picking, packing, and shipping operations with real-time throughput metrics.
IoT and Sensor Monitoring Dashboards
IoT dashboards aggregate telemetry from distributed sensors for environmental conditions, equipment state or system performance. Building and healthcare workflows must derive freshness, alerting and escalation from the operating or clinical procedure, including sensor gaps and false alarms, rather than a universal seconds target.
Industrial IoT platforms monitor equipment across manufacturing facilities, construction sites, and utilities infrastructure. Real-time anomaly detection algorithms flag unusual patterns in sensor data, triggering automated responses or alerting human operators.
Marketing and Customer Analytics Dashboards
Marketing dashboards can track spend, impressions, clicks, conversions and ROI at the cadence each source validates and each control decision uses. Social monitoring may need a shorter window for an active incident than a weekly campaign review; define freshness per workflow instead of assigning one interval to the department.
Customer behavior analytics dashboards show website traffic, user sessions, conversion funnels, and product engagement in real-time. E-commerce platforms display sales velocity, cart abandonment rates, and inventory turnover with minutes of latency.
Building or Buying Real-Time Infrastructure Is a Multi-Year Maintenance Decision, Not a Launch One
The build-versus-buy decision for real-time dashboards significantly impacts engineering timelines, ongoing maintenance burden, and total cost of ownership over multi-year horizons.
Building Real-Time Infrastructure In-House
Building live-dashboard infrastructure creates delivery and recurring ownership work. Estimate it from the named scope: ingestion, transformation, ordering, replay, state, tenant isolation, delivery, client reconciliation, observability, load tests, recovery, regions, compliance and support. The build-versus-platform decision must include infrastructure and ongoing engineering capacity, but a universal month or salary total cannot represent different scopes.
Core infrastructure components include WebSocket server clusters with load balancing and sticky sessions, message queues or event streams for reliable event delivery, stream processing frameworks for data transformation and aggregation, time-series databases optimized for high-throughput writes and fast queries, caching layers for frequently accessed data, and monitoring systems tracking connection health and system performance.
Ongoing maintenance keeps a share of engineering capacity permanently committed once the system reaches production. Engineering teams maintain infrastructure updates, handle scaling challenges as usage grows, fix bugs in custom streaming code, add support for new data sources and visualization types, and monitor system performance and connection health.
Using Embedded Analytics Platforms
White label analytics platforms may provide connectors, update APIs, tenant controls, embedding and scaling infrastructure. Verify which responsibilities the selected product actually owns, what remains in the application, and whether the same failure, load and accessibility tests pass. Compare unresolved delivery units rather than a generic “weeks versus months” promise.
Embedded platforms may provide React components, connectors and client update behavior. Verify the supported chart and transport paths, styling, accessibility, state integration and connection lifecycle. SDK-based embedding can expose more host integration surface, but it does not automatically share state or connections or eliminate custom rendering work.
Compare the current pricing terms, capacity units, viewer and connection rules, environments, support and overages with the salaries, infrastructure, on-call, maintenance and opportunity cost of the same custom scope. Run the horizon on your own inputs and include migration or exit costs; today's plan price is not a ten-year guarantee.
Open-Source and Hybrid Approaches
Open-source real-time dashboard frameworks like Grafana, Apache Superset, or Metabase provide starting points but require significant customization for customer-facing embedded use cases. Self-hosting adds infrastructure management burden, security hardening, and ongoing software updates to engineering responsibilities.
Hybrid approaches combine open-source components with managed services, using Apache Kafka on AWS MSK for event streaming, Grafana Cloud for dashboard rendering, or Redis Enterprise for caching. This approach reduces some infrastructure complexity but still requires substantial integration work and ongoing operational oversight.
Connection lifecycle, scaling coordination, replay, stream failure recovery, authorization refresh, client reconciliation and browser edge cases create recurring work. Track that work as named ownership and operational service levels. We found no reproducible cross-company evidence for a universal multiple over the initial estimate, so the comparison should use the product's incident, staffing and infrastructure model.
Production Real-Time Systems Converge on the Same Patterns for Scaling and Fault Tolerance
Production real-time dashboard systems follow consistent architectural patterns that enable horizontal scaling, fault tolerance, and efficient resource utilization.
Event Streaming Pipeline
Continuous computation on data streams as events arrive, enabling real-time transformations, aggregations, and filtering before data reaches dashboards or storage systems. Unlike batch processing that operates on complete datasets, stream processing handles unbounded data flows with millisecond latency.
The event streaming pipeline forms the foundation of real-time systems, capturing source data changes and making them available to downstream consumers. Change Data Capture (CDC) tools like Debezium monitor database transaction logs, emitting events for inserts, updates, and deletes without application code changes. Event producers publish to message queues (Apache Kafka, AWS Kinesis, Google Pub/Sub) providing durability, ordering guarantees, and fan-out to multiple consumers.
Stream processing frameworks (Apache Flink, Kafka Streams, Spark Streaming) transform raw events through filtering, aggregation, windowing, and joins. Stateful stream processing maintains running calculations (cumulative sums, moving averages, session windows) without requiring full dataset scans for each event.
Event schemas and versioning strategies enable pipeline evolution without breaking consumers. Forward-compatible schema changes (adding optional fields) allow gradual rollout, while breaking changes require coordinated deployment across producers and consumers.
WebSocket Communication Layer
A communication protocol providing full-duplex persistent connections between client and server, enabling real-time bidirectional data streaming without repeated HTTP requests. Unlike traditional HTTP polling, WebSocket maintains an open connection for instant message delivery in both directions.
WebSocket connections provide persistent bidirectional channels between server and client, enabling server-push updates without polling overhead. Connection lifecycle management handles authentication, channel subscription, heartbeat messages, and graceful disconnection. Load balancers with sticky sessions ensure connection persistence as backend servers scale horizontally.
SDK integration provides client libraries abstracting WebSocket connection details, automatic reconnection with exponential backoff, message queuing during temporary disconnections, and delta-only updates to minimize bandwidth. API-first analyticsarchitectures expose WebSocket endpoints alongside REST APIs for hybrid polling/streaming implementations.
Alternative server-push protocols include Server-Sent Events (SSE) for unidirectional updates and HTTP/2 server push for initial page loads. iFrame embedding complicates WebSocket communication through cross-origin restrictions, making SDK-based approaches preferable for embedded real-time dashboards.
Data Storage and Caching Architecture
Time-series databases (InfluxDB, TimescaleDB, Apache Druid) optimize for high-throughput writes and time-range queries common in real-time analytics. Columnar storage formats reduce scan costs for analytical queries, while time-based partitioning enables efficient data retention policies and query pruning.
In-memory caches (Redis, Memcached) provide sub-millisecond read access for frequently accessed aggregates, current state, and hot-path queries. Write-through caching strategies ensure consistency between cache and durable storage, while cache-aside patterns allow gradual cache warming as access patterns emerge.
Hot/warm/cold storage tiers balance performance and cost. Recent data (hours to days) resides in fast storage with real-time query access. Historical data (weeks to months) migrates to cheaper storage with higher query latency. Archived data (years) moves to object storage with infrequent access patterns.
Efficient real-time dashboards precompute aggregates during stream processing rather than calculating on-demand. Materialized views, rollup tables, and pre-aggregated metrics reduce query latency from seconds to milliseconds, enabling smooth user experiences even with high-frequency updates and thousands of concurrent users.
SDK or iFrame Decides Performance, Customization, and Who Operates the Complexity
For B2B SaaS companies embedding customer-facing real-time analytics, the SDK-versus-iFrame decision significantly impacts performance, customization capability, and operational complexity.
SDK-Based Embedding Architecture
SDK embedding integrates dashboard components directly into parent applications through JavaScript libraries, React components, or native mobile SDKs. Embedded dashboard SDKs share the parent application's rendering context, enabling consistent styling, smooth layout integration, and efficient resource utilization.
React chart libraries provide component-based dashboard building blocks that compose naturally within existing React applications. SDK implementations share WebSocket connection pools across multiple dashboard components, reducing infrastructure overhead and network bandwidth compared to separate connections per component.
Authentication flows integrate with existing user sessions, no separate login required. SDK implementations access parent application state, enabling context-aware dashboards that react to user actions, filter changes, or navigation events. Client-side state management frameworks (Redux, MobX, Zustand) coordinate updates between dashboard components and application features.
iFrame Embedding Limitations
iFrame embedding isolates embedded content in separate browser contexts, introducing performance overhead and limiting integration capabilities. Each iFrame maintains separate WebSocket connections, multiplying infrastructure costs as dashboard count scales. Cross-origin restrictions prevent smooth styling coordination between parent application and embedded dashboards.
Parent–iFrame communication commonly uses postMessage with an explicit origin and event contract. SDK and component integrations expose different identity, state, styling and isolation boundaries. Measure serialization, layout, paint, memory and lifecycle on target devices; the embedding form alone does not establish the faster result.
Browser security policies block certain operations in iFrame contexts, accessing parent page cookies, reading local storage from different origins, or coordinating service workers. These restrictions complicate authentication flows and offline caching strategies.
Security and Multi-Tenancy
Row-level security ensures each dashboard connection receives only authorized data. Token-based authentication carries user identity and permission scopes through WebSocket upgrade requests. Server-side filtering applies security rules before broadcasting updates to connected clients.
Multi-tenant architectures isolate data streams by customer, preventing cross-tenant data leakage through shared WebSocket connections or cached aggregates. Logical isolation through tenant identifiers scales efficiently, while physical isolation (separate infrastructure per tenant) provides strongest security guarantees at higher operational cost.
Connection quotas and rate limiting prevent resource exhaustion attacks. Single customers shouldn't monopolize WebSocket server capacity or exhaust message broker throughput. Fair queuing algorithms ensure all tenants receive proportional access to streaming resources.
Multi-Tenant Real-Time Architecture Trades Isolation Against Cost, and Both Against Operability
An architecture where a single application instance serves multiple customers (tenants) with data isolation, ensuring each customer sees only their own data while sharing infrastructure for cost efficiency. Multi-tenant systems balance resource pooling benefits against security requirements and customization needs.
Building multi-tenant analytics systems that scale to thousands of customers requires careful architectural design balancing resource isolation, cost efficiency, and operational simplicity.
Tenant Isolation Strategies
Logical isolation through tenant identifiers enables resource sharing while maintaining data separation. WebSocket servers route messages based on tenant tags, database queries filter by tenant_id columns, and caching layers partition entries by tenant. This approach maximizes resource utilization but requires careful implementation to prevent cross-tenant data leakage.
Schema-based isolation (Postgres schemas, MySQL databases) provides stronger separation within shared infrastructure. Each tenant's data resides in isolated namespace with independent access controls. Schema-level partitioning enables per-tenant backups, data residency controls, and independent retention policies.
Physical isolation (separate infrastructure per tenant) provides strongest security guarantees but increases operational complexity. VPC-per-tenant architectures, dedicated database instances, and isolated Kubernetes namespaces prevent any possibility of cross-tenant data access. This approach suits enterprise customers with stringent security requirements or regulatory compliance needs.
Scaling WebSocket Connections
Connections per instance depend on runtime, message rate and size, subscriptions, TLS, authorization, CPU, memory, file descriptors, network buffers and failure behavior. Measure sustained load and reconnect bursts on the chosen stack. Horizontal designs also need an explicit subscription and session strategy; sticky routing is one candidate, not a universal requirement.
One client connection can multiplex multiple logical subscriptions, while separate connections can isolate ownership and failure. Compare message routing, head-of-line effects, backpressure, authorization, lifecycle and implementation complexity. “Pooling” is an application design, not an automatic SDK or browser behavior.
Regional distribution can shorten one network segment while adding routing, replication, ordering and failover work. Static assets and live transports have different caching and routing paths. Test the complete source-to-visible distribution and recovery objective for each region.
Cost Optimization
Managed and self-hosted transports expose different billing and ownership units. Model connection minutes, messages, egress, compute, regions, environments, support and on-call work at expected and stress loads. A seat, tenant, connection or usage unit is predictable only when its limits and the workload are measurable.
Filtering or delta delivery can reduce transfer when the client can reconcile state safely. Client-side aggregation moves compute and governance into the browser and must be validated against authoritative results. The Page Visibility API exposes visible and hidden state that can inform background behavior, but resumption still needs a freshness and missed-event policy.
Message compression (gzip, Brotli) cuts bandwidth substantially on text-heavy payloads, and how much depends entirely on how repetitive yours are, so measure it on your own frames rather than taking a headline ratio. Binary protocols (Protocol Buffers, MessagePack) provide more efficient serialization than JSON for high-frequency numeric data streams.
White-Label Customization at Scale
White label analytics enable B2B SaaS platforms to embed customer-facing dashboards matching each customer's branding requirements. Multi-tenant white-label systems apply customer-specific themes, logos, and styling without deploying separate dashboard instances per customer.
CSS custom properties (variables) enable runtime theme switching without recompiling application bundles. Component libraries designed for white-labeling expose configuration APIs for colors, fonts, spacing, and layout preferences. Theme inheritance patterns let customers override default styles while maintaining design consistency.
Dashboard templates balance customization flexibility with operational simplicity. Predefined layouts with configurable content suit most customers, while power users access low-level APIs for fully custom implementations. Template versioning enables gradual rollout of new dashboard capabilities without breaking existing customer deployments.
Deployment Runs Through Provisioning, Integration, Testing, and Monitoring in That Order
Deploying production real-time dashboards requires systematic approach covering infrastructure provisioning, application integration, testing, and monitoring.
Phase 1: Architecture Design
Define freshness and recovery requirements from the actual action window, source behavior and cost of stale or partial state. Compare custom and platform implementations against the same delivery units, load model, failure tests, ownership and total-cost inputs.
Select event streaming platform (Apache Kafka, AWS Kinesis, Google Pub/Sub) based on throughput requirements, durability guarantees, and operational preferences. Design stream processing pipelines for data transformation, aggregation, and routing to storage layers.
Plan data storage architecture balancing real-time query performance with cost efficiency. Time-series databases for recent data, columnar stores for historical analysis, object storage for long-term retention. Define retention policies and archival strategies early to prevent unexpected storage costs.
Phase 2: Infrastructure Provisioning
Deploy message brokers with sufficient throughput capacity and replication for durability. Configure topic partitioning for parallel processing and consumer group coordination. Implement monitoring and alerting for broker health, lag metrics, and throughput utilization.
Provision WebSocket server clusters with horizontal scaling policies based on connection count and message throughput. Configure load balancers with sticky session support, health checks, and connection draining for graceful deployments. Set up connection state management across distributed servers using Redis or distributed caches.
Deploy stream processing jobs with checkpointing for exactly-once processing semantics. Configure failure recovery, backpressure handling, and monitoring for processing lag. Implement schema registry for event format evolution and compatibility checking.
Phase 3: Client Integration
Integrate SDK or implement WebSocket client with automatic reconnection, exponential backoff, and connection health monitoring. Handle authentication token refresh, message queuing during temporary disconnections, and graceful degradation when streaming unavailable.
Implement efficient client-side rendering with delta updates, modify only changed data points rather than redrawing entire visualizations. Use virtual scrolling for large datasets, progressive rendering for complex charts, and debouncing for high-frequency updates. Profile rendering performance across target devices and browsers.
Add error handling for malformed messages, network interruptions, and API errors. Implement client-side circuit breakers preventing infinite reconnection attempts. Display connection status indicators and graceful degradation messaging to users.
Phase 4: Testing and Optimization
Load test WebSocket infrastructure with realistic connection counts, message frequencies, and tenant distribution patterns. Identify scaling bottlenecks in connection handling, message routing, or database queries. Optimize stream processing throughput through parallelization, state management, and checkpointing strategies.
Test failure scenarios (server crashes, network partitions, database outages) ensuring system degrades gracefully without data loss or permanent disconnection. Verify reconnection logic, message replay, and state recovery mechanisms under various failure conditions.
Measure end-to-end latency from source event to dashboard update. Profile each pipeline stage identifying optimization opportunities. Implement distributed tracing for complex multi-stage processing pipelines.
Phase 5: Monitoring and Operations
Deploy complete monitoring covering connection counts, message throughput, processing lag, error rates, and query latency. Implement alerting for abnormal patterns, sudden connection drops, processing delays, or error spikes. Set up dashboards displaying real-time system health metrics.
Establish operational runbooks for common issues, WebSocket server scaling, message broker capacity management, stream processing failures. Document troubleshooting procedures, escalation paths, and disaster recovery processes. Train operations teams on system architecture and debugging techniques.
Implement cost monitoring tracking WebSocket connections, message broker throughput, database storage, and network bandwidth. Set budget alerts preventing unexpected cost overruns as usage grows. Optimize resource utilization through connection pooling, message batching, and efficient query patterns.
The Same Failures Recur Across Implementations, Which Makes Them Worth Learning Once
Production real-time dashboards encounter consistent challenges across implementations. Understanding these patterns accelerates troubleshooting and prevents common pitfalls. The operating side of the same problem, refresh rates tied to a deadline, alert rules that need an owner, and the load a dashboard left open all day creates, is worked through in live dashboard best practices.
Challenge: Thundering Herd on Reconnection
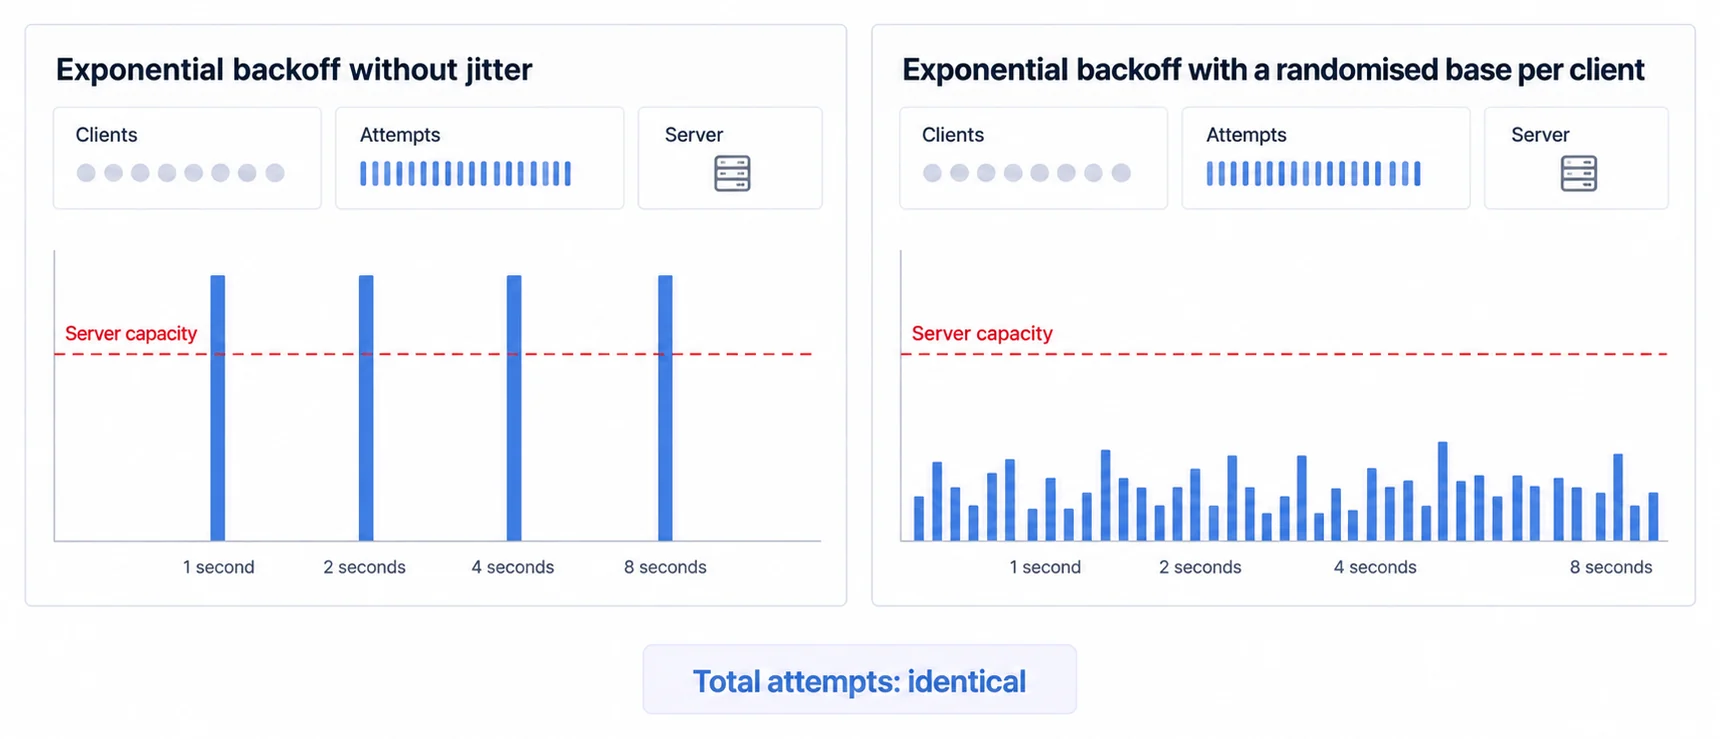
When WebSocket servers restart or network issues cause widespread disconnections, thousands of clients attempt simultaneous reconnection, overwhelming servers and triggering cascading failures. Exponential backoff with jitter distributes reconnection attempts over time windows. Per-client backoff timers start from randomized base values preventing synchronized retry storms.
Circuit breaker patterns detect persistent connection failures and temporarily pause reconnection attempts. Client-side connection pools limit concurrent connection establishment, queuing additional requests until capacity available. Server-side rate limiting bounds connection attempts per time window, rejecting excess requests with retry-after headers.
Challenge: Data Consistency During Network Partitions
Network interruptions create temporary data inconsistency as some clients receive updates while others remain disconnected. Message sequence numbers enable clients detecting missing updates after reconnection. Server-side replay buffers cache recent messages enabling gap-filling without full state synchronization.
Client-side checksums verify data integrity after reconnection, triggering full resync when local state diverges significantly. Timestamp-based conflict resolution handles concurrent updates, last-write-wins or application-specific merge logic. Display clear indicators when dashboards operate with stale data during network issues.
Challenge: High-Frequency Update Performance
Dashboards displaying metrics updating multiple times per second overwhelm browser rendering pipelines causing stuttering animations and high CPU usage. Throttling and debouncing batch rapid updates into periodic rendering cycles, display 60fps maximum regardless of underlying event frequency.
Animation-frame scheduling can align visual updates with repaint opportunities. Framework reconciliation, direct DOM work, SVG and Canvas impose different costs and accessibility contracts. Benchmark the visible marks, labels, interactions, update cadence and target device; Canvas does not universally outperform SVG.
Selective update subscription enables clients controlling which metrics refresh in real-time versus periodic polling. Active dashboards subscribe to full update streams while background tabs receive throttled updates conserving bandwidth and CPU.
Challenge: Multi-Tenant Performance Isolation
Noisy neighbor problems arise when single tenant's high message volume degrades performance for other tenants sharing infrastructure. Per-tenant connection quotas limit maximum connections preventing resource monopolization. Message rate limiting bounds events processed per tenant per time window.
Priority queues ensure latency-sensitive tenants receive processing preference over bulk analytics jobs. Dedicated resource pools isolate enterprise customers with strict SLA requirements from multi-tenant shared infrastructure. Cost allocation tracking helps identify optimization opportunities and inform pricing strategies.
Debugging a Real-Time Dashboard Needs Visibility Across Every Layer It Spans
Effective troubleshooting requires complete visibility into distributed real-time systems spanning multiple infrastructure layers.
Connection Health Monitoring
Track active connection counts by tenant, region, and dashboard type. Monitor connection lifetime distributions identifying clients with abnormal reconnection patterns. Measure authentication success rates, upgrade failures, and connection rejection reasons.
WebSocket-specific metrics include message send/receive rates, queue depths, backpressure indicators, and connection errors. Protocol-level monitoring captures handshake timing, frame sizes, and compression effectiveness. Client-side telemetry reports connection quality from user perspective including latency, jitter, and packet loss.
Stream Processing Observability
Processing lag metrics measure delay between event production and consumption. Rising lag indicates throughput bottlenecks requiring scaling or optimization. Checkpoint frequency and size indicate state management efficiency and failure recovery time.
Error rates by stage and error type identify problematic transformations or data quality issues. Backpressure indicators show when downstream systems can't keep up with event rates. Throughput metrics track events processed per second per operator enabling capacity planning.
End-to-End Latency Tracing
Distributed tracing instruments event flow from source through stream processing to dashboard rendering. Trace propagation through message headers enables correlation across infrastructure boundaries. Latency breakdown by stage identifies optimization opportunities, database queries, network transmission, rendering time.
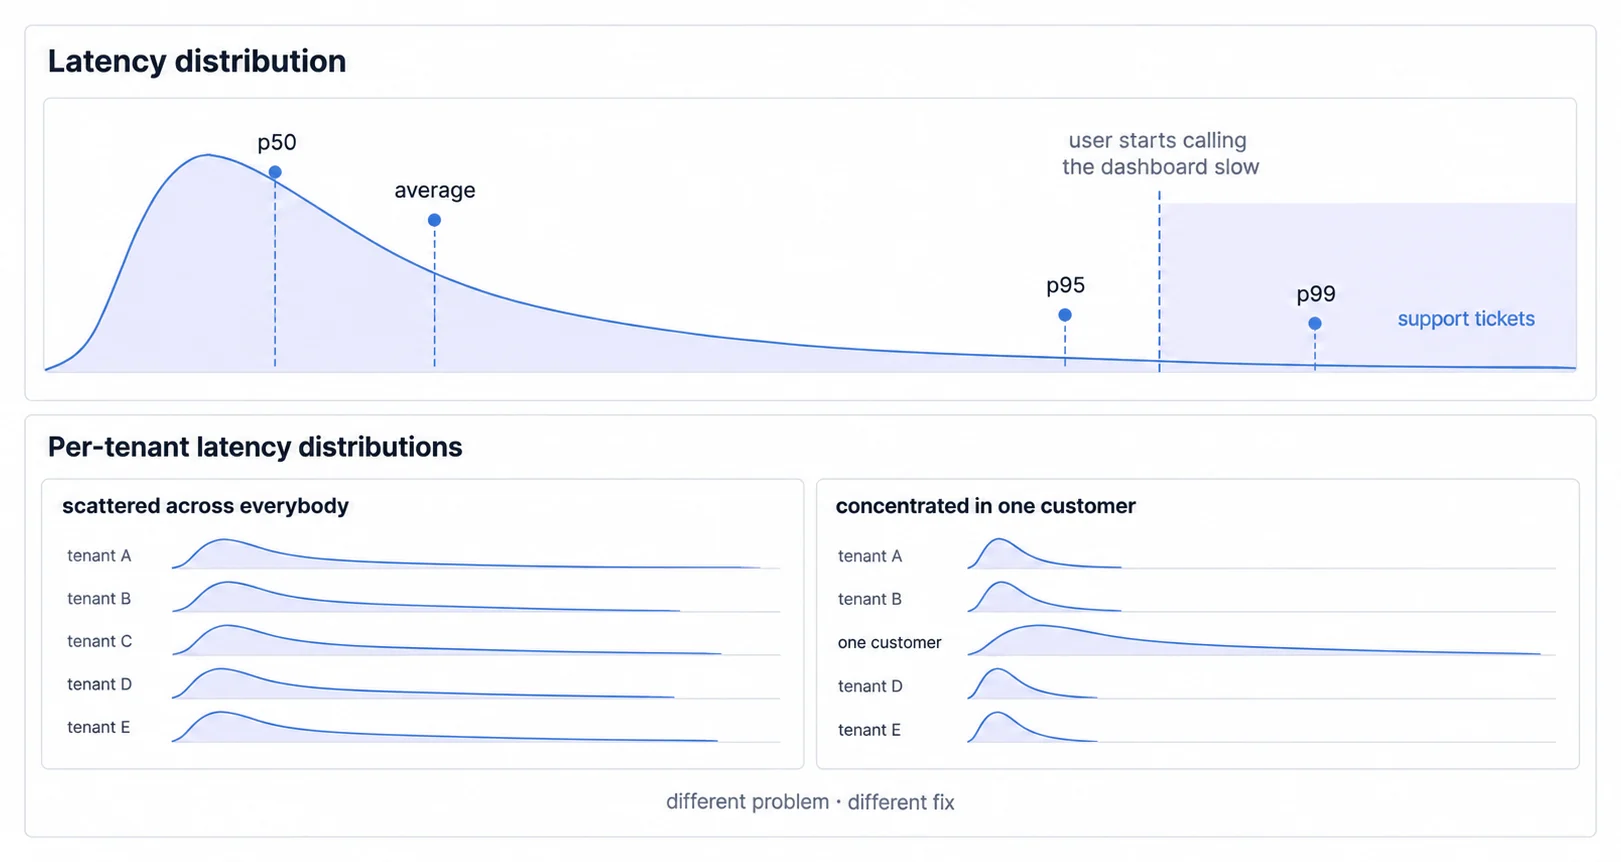
Percentile metrics (p50, p95, p99) reveal tail latency issues affecting subset of users. Per-tenant latency distributions identify performance outliers requiring investigation. Historical trend analysis detects gradual degradation before users notice impact.
Client-Side Performance Profiling
Browser performance APIs measure rendering frame rates, JavaScript execution time, and memory consumption. Long task monitoring identifies blocking operations preventing smooth interactions. Bundle size analysis ensures dashboard code loads quickly on slower networks.
Real User Monitoring (RUM) captures actual user experience metrics across devices, browsers, and network conditions. Synthetic monitoring periodically tests dashboard performance from distributed locations providing baseline comparisons. Error tracking aggregates client-side exceptions, WebSocket failures, and API errors for investigation.
Real-Time Dashboard Use Cases by Industry
FinTech real-time dashboards serve payment monitoring, transaction fraud detection, trading platforms, and banking customer portals. Payment processors display transaction volumes, success rates, and settlement status in real-time. Lending platforms track loan application progress and approval workflows. Customers see balance updates, transaction history, and spending analytics with immediate refresh.
HealthTech platforms use real-time dashboards for remote patient monitoring, displaying vital signs streams from wearable devices. Hospital bed management systems track occupancy, discharge timing, and emergency department flow. Telemedicine platforms show session analytics and system performance to administrators.
Manufacturing dashboards monitor production lines with second-level updates on throughput, quality metrics, and equipment status. Predictive maintenance algorithms analyze real-time sensor data, triggering alerts before equipment failures. Supply chain dashboards provide end-to-end visibility into logistics networks, order status, inventory levels, delivery tracking.
SaaS product analytics offer customer-facing dashboards showing API usage, feature adoption, performance metrics, and billing consumption in real-time. This transparency reduces support burden and helps customers optimize their own usage. Marketing dashboards track campaign performance, ad spend, conversion rates, and social media engagement with near-real-time updates enabling rapid optimization.
Choose by Testing Identity, Styling, Isolation, and Accessibility, Not by the Embedding Label
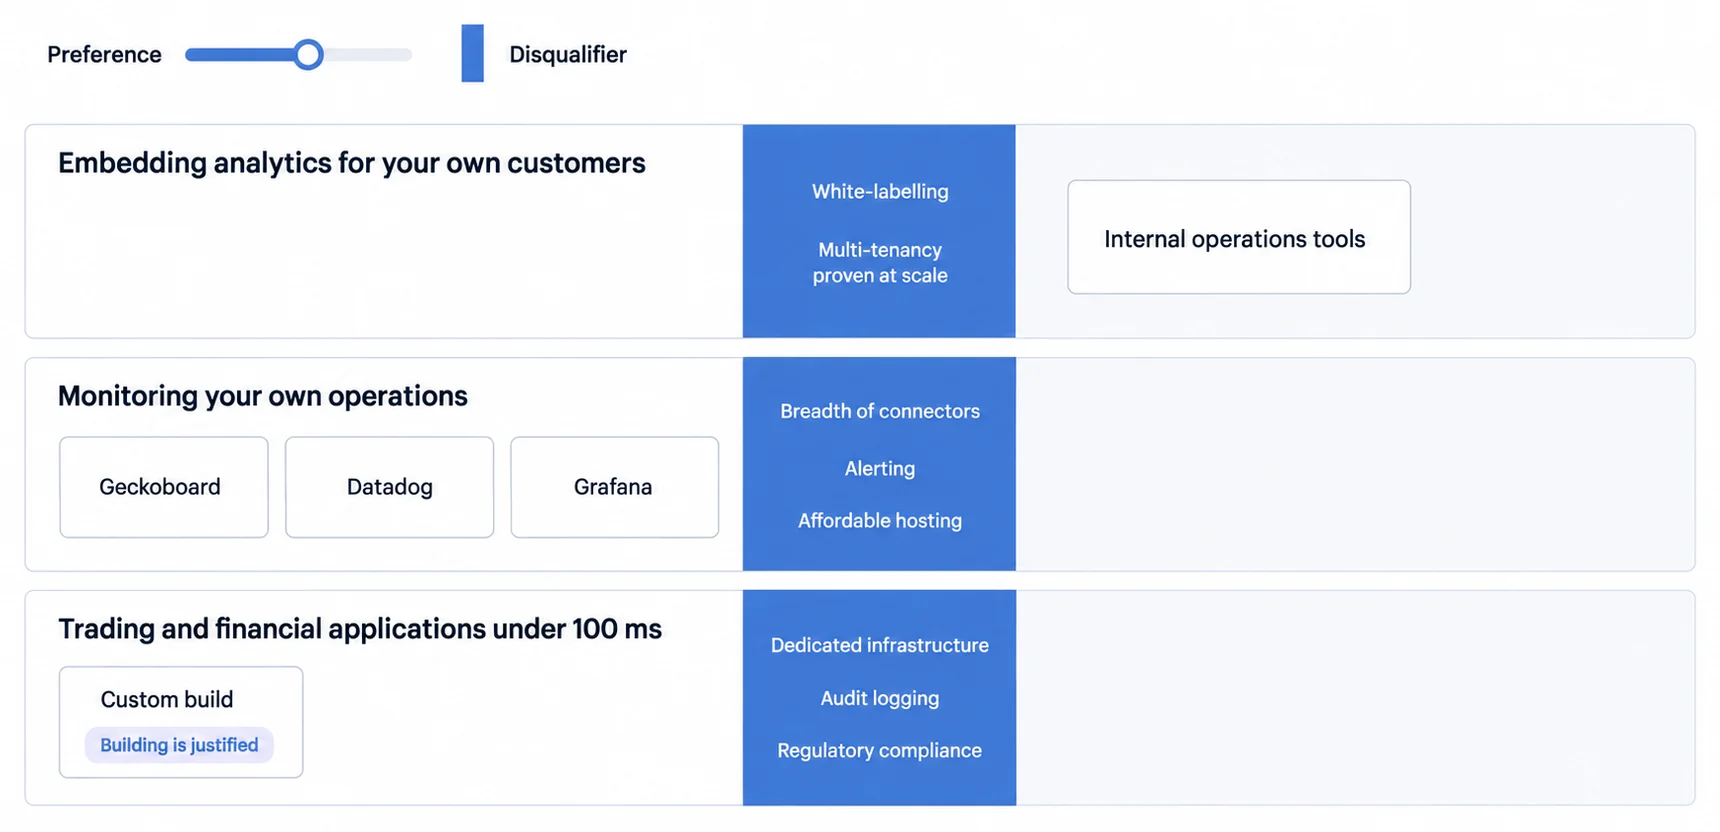
For B2B SaaS companies embedding customer-facing real-time analytics, compare SDK, component, web component and iFrame options against identity, styling, isolation, accessibility, state sharing, transport ownership and lifecycle. White-label analytics and multi-tenant enforcement matter when the product contract requires them. Model per-connection, viewer, compute and capacity pricing against the measured load rather than assuming one pricing unit is inherently predictable.
Purpose-built embedded analytics platforms can provide infrastructure for customer-facing analytics, including embedding and customizable dashboards. Validate the exact boundary and remaining work with a prototype; the product category alone does not establish deployment time or eliminate application responsibilities.
For internal operations monitoring, prioritize broad data source connectors, alerting capabilities, team collaboration features, and cost-effective hosting. Tools like Geckoboard, Datadog, or Grafana excel at internal operational dashboards but lack the white-label and embedding capabilities required for customer-facing deployments.
When a financial application has a measured sub-100 ms source-to-visible budget, the test environment, market-data contract, regulatory controls, audit trail and failure behavior become part of acceptance. That specialized scope may disqualify general-purpose candidates, but the number must come from the product requirement.
Define freshness from the decision window, then prove source-to-visible tail latency, ordering, replay, authorization, stale-state labeling and recovery. Polling, SSE, WebSockets and brokered streams are candidates rather than maturity levels. Compare embedding and build-versus-platform options against the same scope. Production evidence includes load and reconnect tests, message-path observability, connection health, client performance, accessibility and correctness.
Ready to launch customer-facing analytics?
Stop losing customers to competitors with better analytics. Sumboard's customer-facing analytics platform lets you launch self-service dashboards in days, not months.