A streaming dashboard is not a chart with a WebSocket. It is a stateful data product that must decide which events belong to a result, when that result is safe to show, how it changes after late or corrected data, and what happens when any stage slows or restarts.
Most dashboard decisions do not require the same latency. The useful architecture begins with an action deadline and a maximum safe data age: not with Kafka, polling, or a “real-time” label.
Decision Latency, Not Data Latency, Is What a Streaming Dashboard Has to Meet
Name the user, signal, action, deadline, consequence of waiting, and prohibited automation. Ask whether the action remains valuable if data is five seconds, five minutes, or one reconciliation cycle old. Then measure source availability and the time the user actually needs to decide.
An operational alert may justify event-driven delivery when an owner can respond immediately. A financial close, cohort analysis, or executive review may become less trustworthy if streamed before reconciliation. The dashboard types guide helps connect refresh expectations to decision horizons without assigning one cadence to an entire industry.
Use observed task evidence, not refresh clicks alone. Repeated refresh can indicate stale data, unclear freshness, a missing alert, or an interface that does not acknowledge work. Interview users and trace the action that a fresher result would change.
Streaming and Batch Differ in What the Engine Remembers, and the Layer Nearest Your Dashboard Is Often Still Batch
Search results for "streaming vs batch" mostly answer with latency: batch is scheduled and slow, streaming is continuous and fast. The vendor documentation ranking first for that comparison draws the line somewhere else. Databricks defines batch semantics as processing where "the engine does not keep track of what data is already being processed in the source," and streaming as processing where "the engine keeps track of what data is being processed and only processes new data in subsequent runs."
That is a statement about bookkeeping, not speed, and it decides which failure you inherit. When a record belonging to the first hour arrives during the second hour, a batch run reprocesses the hour and overwrites the earlier result. A streaming run has already published that hour, so the same correction requires the job to have stored enough state to revise a number a user may have read.
The same page recommends a processing semantic per layer, and the recommendation reverses as data moves toward the reader. Streaming is the suggested default for bronze ingestion, while silver transformation and gold last-mile aggregation are both recommended as "batch processing (with incremental refresh in materialized views)." Gold is the layer a dashboard usually reads.
A system can therefore be event-driven from source to warehouse and still hand the dashboard a result recomputed on a schedule. For that system, "is this dashboard streaming?" has no single answer, because the answer differs by layer. The question that decides what a user sees is which layer sets the age of the number on screen, and that is normally the last one.
The dichotomy itself is contested. Gunnar Morling argues that "streaming vs. batch" is a wrong dichotomy because "many streaming systems will apply batching too," and proposes a different axis: "will the system query its sources for new records in a fixed interval, or will new records be pushed to the system as soon as possible?"
Pull and push is a sharper question than fast and slow, and it is still a question about the producer. None of these axes is visible to the person reading the dashboard. A value pushed one second ago and a value pulled ten minutes ago render identically, which is why the freshness states later on this page are a design requirement rather than a finishing touch.
Scope of this comparison, so it is not read as wider than it is: we read the Databricks page, its Microsoft Learn mirror, which carries the same two definition sentences, and the Morling post. We did not check whether other streaming vendors publish the same layer recommendation. Treat the gold-layer point as one vendor's documented position, not as an industry consensus.
Event Time and Processing Time Are Different Clocks, and Streaming Runs on Both
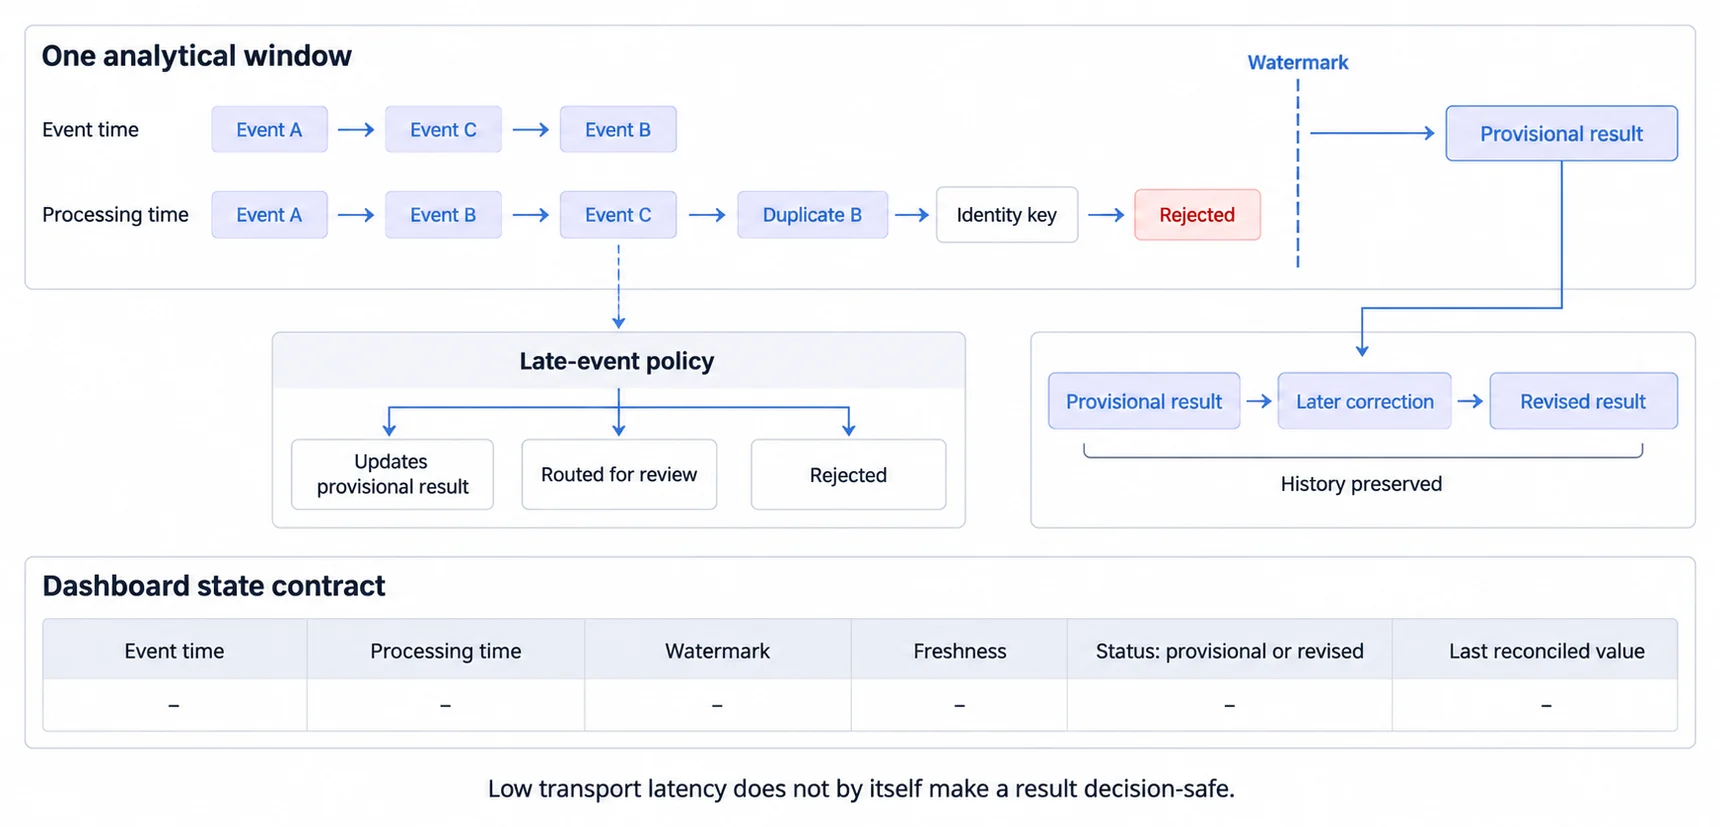
Event time is when the source says an event occurred. Processing time is when a system handles it. Network delay, offline devices, retries, partitions, and backfills mean those orders can differ.
Apache Flink's event-time documentation describes watermarks as progress through event time and explains that late elements can arrive after a watermark has passed their timestamp. That is a useful architecture concept beyond any one processor: every window needs an explicit rule for how long to wait and what to do with late data.
For each metric, define timestamp source, time zone, window, watermark or close rule, allowed lateness, idle-source behavior, and correction policy. Decide whether late events update a previous result, enter a review stream, or are rejected. Preserve enough history to explain a revision.
Every Streaming Event Needs an Identity, or Replay and Correction Cannot Work
Define event ID, producer, tenant, entity, schema version, event time, ingestion time, operation type, and correlation identifiers. A retry should not silently double a transaction. An update or reversal should not look like a new sale. A schema change should not reinterpret old data without detection.
Validate required fields and route invalid records without stopping unrelated partitions. Record why an event was rejected and how it can be replayed after correction. Protect sensitive fields and bind tenant scope before data reaches a shared serving layer.
Schema compatibility, deduplication, ordering, and idempotent sinks are acceptance contracts, not product-name guarantees. Test them with deliberate duplicates, reordering, missing keys, incompatible versions, retries, and partial failures.
Keep the Streaming Pipeline Separate From Dashboard Delivery, They Fail Differently
Continuous ingestion may use a durable log or another replayable source. Stateful processing may filter, join, aggregate, and window events. A serving store or cache may hold current and historical results. The client may receive notifications through WebSockets, Server-Sent Events, polling, or invalidation followed by a read.
These layers solve different problems. Kafka is not a browser transport. A WebSocket does not define metric correctness. Polling can be appropriate for a decision with a wider latency budget; a persistent connection can be appropriate when the server must push bounded updates. The real-time data visualization guide covers client rendering and lifecycle concerns.
Keep authorization server-side. The trusted layer should map the host user to tenant, role, row, field, channel, and action scope. Test guessed subscriptions, modified identifiers, reconnects, direct reads, caches, exports, history, and account switching.
When Arrival Outruns Processing, the System Needs a Named Response, Not a Queue
When arrival exceeds processing or delivery capacity, the system needs an explicit response. Backpressure may slow producers or consumers; buffering may absorb a bounded burst; sampling or aggregation may reduce visual update volume; overload protection may reject nonessential work.
The browser should not append forever or render every event individually. Define a bounded visible window, aggregation level, maximum update frequency, memory budget, hidden-tab behavior, reconnect policy, and full-state resynchronization. Coalesce updates when the user cannot perceive or act on every change.
Test burst, sustained peak, slow consumer, offline client, reconnect storm, idle source, hot tenant, hot key, processor restart, cache loss, and regional impairment. Monitor lag and backlog at each stage instead of treating “connection open” as health.
A Streaming Dashboard Must Show Its Own Freshness, Because Stale and Live Look Alike
Show source time, ingestion time, watermark or close, and understandable freshness. Distinguish:
- provisional: the window is still accepting expected data;
- decision-safe: the agreed completeness rule has passed;
- stale: data age or pipeline lag exceeds the contract;
- partial: a source or partition is missing;
- revised: a late event or correction changed a prior value;
- disconnected: live delivery stopped and recovery is in progress.
Do not silently present the last cached value as live. Preserve layout, announce important changes without overwhelming assistive technology, provide a bounded recovery path, and show the last reconciled value when it helps users avoid an unsafe action.
Our real-time analytics and live dashboard practices expand these user-facing contracts.
Streaming Data Gets Replayed, Duplicated and Corrected, So Reconcile It Against a Record
Streaming paths can be replayed, duplicated, delayed, or corrected. Run periodic reconciliation against the authoritative source or an accepted close. Compare counts, sums, keys, windows, watermarks, rejected records, and revisions. Define tolerance, owner, escalation, repair, replay, and audit retention.
Recovery is not complete when the processor restarts. State must restore, consumers must resume from known positions, cached results must be consistent, clients must resynchronize, and previous decisions may need review if a result changed.
Test restore from checkpoints or snapshots, full replay, partial replay, version rollback, schema rollback, and reconciliation after each. Measure recovery time and the correctness of the recovered result.
There Is No Universal Streaming Cost Multiple, So Model Your Own Event Rate
There is no universal streaming cost multiple or delivery timeline. Model event rate and size, partitions, retention, state, windows, joins, replays, serving reads, cache, egress, environments, availability, monitoring, on-call, support, implementation, testing, reconciliation, and exit.
Run base, growth, peak, burst, failure, and replay cases. Compare them with batch, micro-batch, database change notification, scheduled refresh, or a hybrid. Critical alerts can stream while reconciled analytical views remain batch-based.
For embedded delivery, add tenant isolation, host authentication, channel authorization, browser lifecycle, accessibility, responsive behavior, customer support, and commercial metering. The embedded analytics platform comparison describes that surrounding boundary.
The Last Hop Is a Browser Tab Left Open All Day, and It Fails Differently
Every section above concerns the pipeline. The final consumer is a tab someone opened at nine in the morning and will look at again after lunch, and it breaks in ways no backend test reaches.
Three of them are worth designing for explicitly. A page accumulating points on every update grows without bound unless the client window is capped, and a dashboard that is fine for twenty minutes can be unusable after six hours. A laptop that sleeps, or a network that drops, returns to a socket that is closed while the interface still looks connected, so reconnection has to be visible and has to reconcile the gap rather than silently resuming. And a background tab may be throttled by the browser, which means the view a user switches back to is stale for reasons that have nothing to do with your pipeline.
Test the eight-hour session, not the eight-minute one.
Prove a Streaming Dashboard on the Hardest Tenant, Window and Late-Event Case
Implement one signal and one user action across the hardest tenant, schema, window, late-event, correction, workload, device, and failure cases. Measure each latency segment and the complete decision. Verify denied access, bounded memory, reconnect, stale state, replay, reconciliation, recovery, and cost.
The real-time dashboard guide provides a broader architecture path. Evaluate Sumboard or another embedded analytics platform under the same event identity, decision-safe state, tenant, workload, correction, recovery, and ownership contract. A managed platform can transfer work only when the exact route and guarantees are documented and tested.
Where to go next
- Headless BI guide: the metrics layer underneath all of this, and what each exposure route leaves you owning.
- Headless BI Architecture: why engineering teams are choosing headless architectures for embedded analytics.
- Architecture articles: every article in this cluster.
Ready to launch customer-facing analytics?
Stop losing customers to competitors with better analytics. Sumboard's customer-facing analytics platform lets you launch self-service dashboards in days, not months.