

A quantifiable metric that tracks progress toward critical business objectives, providing teams with measurable targets and data-driven insights for strategic decision-making.
What a KPI Means for Goal Tracking
A Key Performance Indicator (KPI) is a quantifiable metric that measures progress toward critical business objectives over time. Unlike general metrics, KPIs represent the most important performance measures that directly align with strategic goals and drive decision-making across an organization.
KPIs transform abstract business goals into concrete, measurable targets. In B2B SaaS environments, KPIs appear on the dashboard types sorted by how fast the reader must act to provide real-time visibility into business performance, from financial health to customer satisfaction to operational efficiency. The dashboard types guide covers which formats best display different KPI categories, while KPI dashboard examples shows real-world implementations.
The strategic value of KPIs lies in their focus: not every metric qualifies as a KPI. While you might track hundreds of metrics, only a select few earn KPI status because they have the highest impact on achieving your strategic objectives. For example, a SaaS company might track total website visitors (metric) but designate "qualified leads per month" as a KPI because it directly impacts revenue growth.
Effective KPIs follow the SMART framework: Specific, Measurable, Achievable, Relevant, and Time-bound. This ensures every KPI drives action rather than simply reporting data.
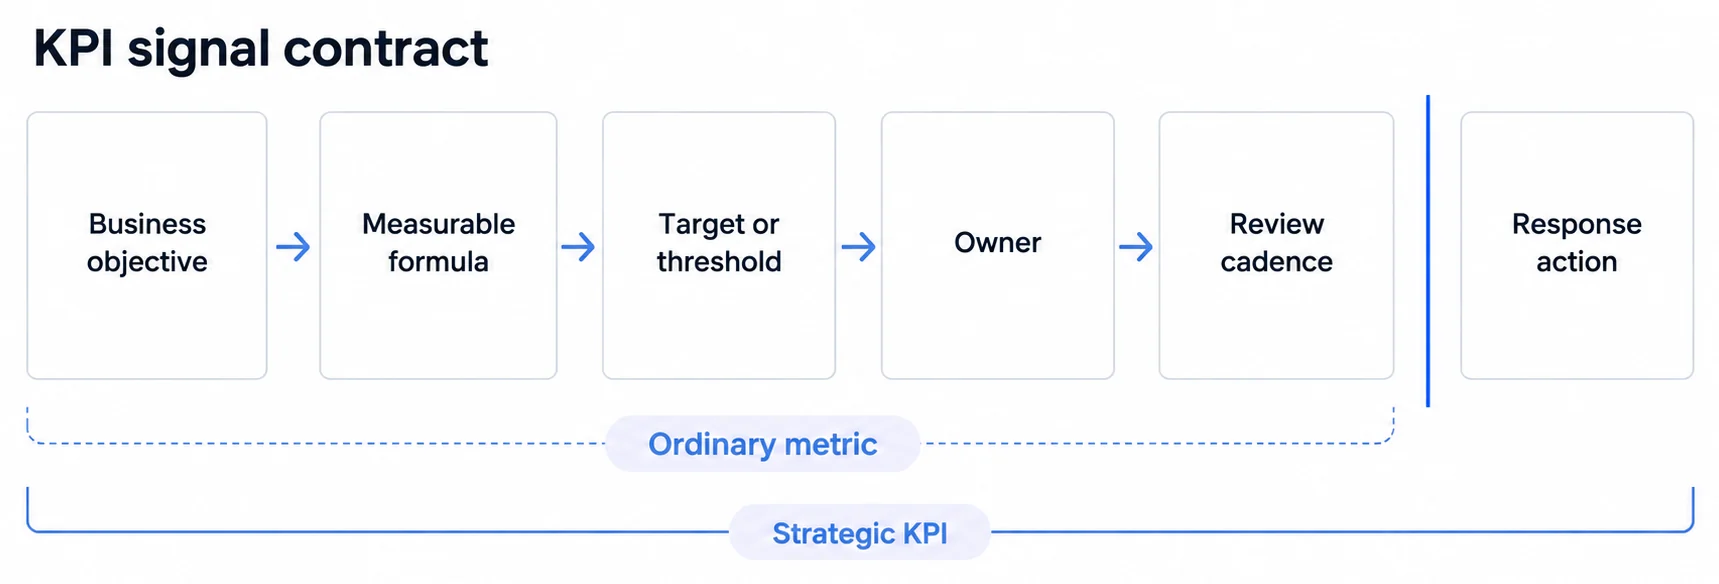
KPI Characteristics That Separate Strategic Signals From Metrics
What defines a true KPI:
- Quantifiable Measurement: Expressed as numbers, percentages, or ratios that can be tracked objectively over time
- Strategic Alignment: Directly tied to specific business goals rather than measuring activity for its own sake
- Actionable Insights: Provides clear signals about where to focus effort and resources for maximum impact
- Time-Bound Tracking: Monitored at regular intervals (daily, weekly, monthly, quarterly) to identify trends and patterns
- Leading vs Lagging Indicators: Leading KPIs predict future performance (e.g., sales pipeline), while lagging KPIs measure past results (e.g., revenue closed)
- Dashboard Visualization: Displayed on embedded analytics dashboards with color-coded indicators (green = on target, red = requires action). Dashboard design principles govern how KPIs are arranged and prioritized, while operational dashboard guides show how these are applied day-to-day
A Metric Becomes a KPI When Someone Changes Behaviour Because of It
The frameworks are useful and they are not the test. The test is whether a named person does something different when the number moves. If nobody does, the metric may still be worth tracking, but it is reporting rather than a key indicator, and calling it a KPI dilutes the term for everything else on the board.
That test is also why the count matters less than the ownership. Twelve KPIs with no owner behave like twelve numbers nobody reads. Three with an owner, a target, a review cadence, and an agreed response are three commitments.
Leading and Lagging Indicators Answer Different Questions, and a Board Needs Both
A lagging indicator tells you what happened and can be trusted: revenue closed, churn realised, tickets resolved. It is also, by definition, too late to act on directly.
A leading indicator is a prediction wearing the clothes of a measurement. Pipeline created, activation rate, and trial-to-paid conversion are useful precisely because they move first, and risky for the same reason: they are only as good as the relationship between them and the outcome, and that relationship can weaken without anyone noticing. Recheck it periodically rather than assuming a leading indicator stays leading.
The practical arrangement is to pair them. Watch the leading number for direction, confirm against the lagging one, and treat a divergence between the two as information rather than as a data problem.
A KPI Is an Instruction as Well as a Measurement
Once a number carries consequences for the person producing it, the cheapest way to move it is not always the intended one. This is not cynicism about people; it is what incentives do. Our KPI dashboard examples work through the counterweight pattern: pair each KPI with the metric that would catch the shortcut, and treat a number with consequences and no counterweight as a target rather than an indicator.
A KPI Without a Target Is a Number, and a Target Without an Owner Is a Wish
Six fields turn a metric into something operable: the objective it serves, the formula including its filter and time grain, the target and the period it applies to, the person accountable, the cadence at which it is reviewed, and the response agreed in advance for missing it.
The last one is skipped most often and is the one that makes the rest work. A KPI whose response is decided during the meeting where it is missed will be renegotiated instead of acted on.
A Number That Only Goes Up Is Usually Measuring Effort Rather Than Outcome
Cumulative totals, registered accounts, published articles, and features shipped share a property that makes them comfortable and weak: they cannot fall. A metric that only moves in one direction cannot tell you that something got worse, which is most of what an indicator is for.
The repair is usually a denominator or a period. Registered accounts becomes accounts active this month. Features shipped becomes features adopted within thirty days. Articles published becomes articles that received traffic this quarter. Each version can go down, and each therefore carries information the original one could not.
Related KPI Dashboard Concepts and Examples
- KPI dashboard examples, worked through by team and use case
- Choosing a dashboard type by how fast the reader must act, before choosing which measures go on it
- Definitions, reconciliation and release for revenue measures, where most metric disputes actually start
- Financial Dashboard, KPI tracking for revenue and profitability metrics
- Marketing Dashboard, KPI tracking for campaign and growth metrics
- Financial KPI Tracking, deep dive into financial performance indicators
Build powerful KPI dashboards for your customers
Sumboard makes it easy to embed professional KPI dashboards with real-time tracking and custom visualizations, deployed in hours, not months.