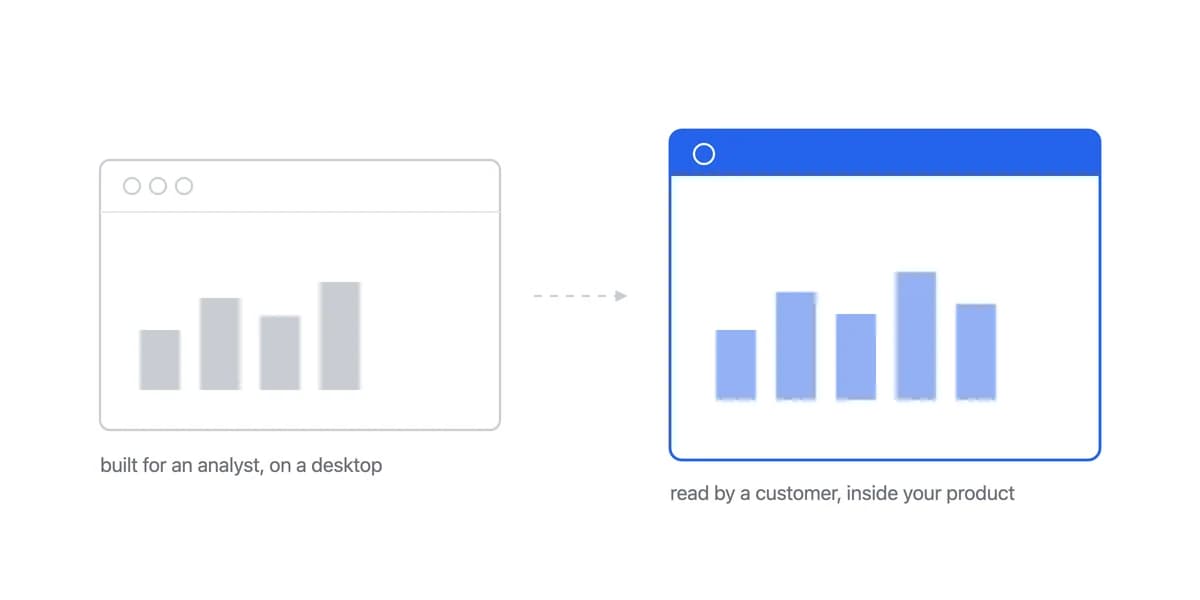
We've been having a lot of conversations with B2B SaaS teams about open source BI tools lately. The pattern is almost always the same: Someone on the engineering team found Metabase or Apache Superset, got excited about "free," set it up in a weekend, and now (six months later) they're drowning.
The DevOps engineer is spending 10 hours a week maintaining it. The security team is nervous about compliance. And the business team keeps asking for features that require custom development or paid plugins. That "free" tool is now consuming $50K+ in engineering time annually, and they're looking for alternatives.
Here's what we're learning about open source BI tools, when they work brilliantly, and when they become expensive mistakes.
What Open Source BI Actually Means (And What It Doesn't)
Open source BI tools like Metabase, Apache Superset, BIRT, or Grafana give you access to the source code. You can download, modify, and host them yourself. No licensing fees. No vendor lock-in.
Sounds perfect, right?
The catch is that "no licensing fees" doesn't mean "no cost." In fact, for most B2B SaaS companies, open source BI ends up being significantly more expensive than purpose-built commercial alternatives, especially for customer-facing analytics use cases, which is what purpose-built customer-facing analytics products like ours are priced against.
"Free" Open Source Still Bills for Hosting, DevOps, Hardening and Missing Features
When teams say they want "free analytics," what they usually mean is they want predictable, low costs. Open source can deliver that for internal use cases with technical teams. But for customer-facing analytics? The math rarely works out.
From customer conversations, we're seeing open source BI deployments cost:
- Self-hosting infrastructure on AWS, GCP or Azure, priced on your own instance size and traffic
- DevOps maintenance: the hours per month this really takes, at your own engineering rate. It is the line that decides whether self-hosting is cheaper
- Security hardening: One-time $10K-$20K + ongoing monitoring
- Feature development: custom visualisations, white-labelling and multi-tenancy, priced at your own engineering cost
Total realistic cost: hosting, DevOps time and security work, none of which the licence covers. Price those three against your own rates before calling the tool free.
Compare that to a commercial embedded platform: Sumboard is €2,388-€5,988 a year on its published tiers, with no infrastructure for you to run. Your side stays the data connection and the dashboards themselves.
The Real Costs No One Talks About
Self-Hosting Means Managing More Than the BI Tool
You're not just running the BI tool. You're managing:
- Database hosting (metadata storage)
- Application servers (redundancy for uptime)
- Caching layers (Redis, Memcached)
- Load balancers
- Backup systems with monitoring and alerting
One customer described spending three weeks getting an Apache Superset deployment production-ready, their "weekend project" having turned into an infrastructure initiative. That is one team's account rather than a benchmark, and what transfers is the shape of the surprise rather than the duration.
Self-Hosting Means You Own Security Entirely, Down to Certificate Renewal
Self-hosting means you own security entirely. That includes:
- SSL certificates and renewal
- Database encryption and row-level security
- User authentication and authorization
- SOC 2 compliance documentation
- Regular security patches and updates
A fintech customer shared that their compliance team required a full security audit of their Metabase deployment before they could use it for customer-facing analytics. Cost: $15,000.
For teams evaluating these requirements, understanding embedded analytics security becomes critical before committing to self-hosted solutions.
Open Source BI Is Built for Analysts Who Know SQL, Not for Your Customers
Open source BI tools are fantastic for internal analytics. They're built for data analysts who know SQL and don't mind technical interfaces.
But for customer-facing analytics, you typically need:
- White-labeling (your logo, colors, branding)
- Multi-tenancy (isolated data per customer)
- Scheduled reports (automated PDF/Excel delivery)
- Localization (multi-language, time zones, currency)
- Professional support (SLAs, priority bug fixes)
Most open source tools don't include these out-of-box. You either build them yourself (expensive) or pay for enterprise editions (which defeats the "free" purpose).
When Open Source BI Makes Sense
Let's be clear: open source BI isn't wrong. It's just right for specific scenarios.
Open source tools like Metabase or Grafana work brilliantly when:
1. Internal analytics for technical teams
- Your data team knows SQL
- You have DevOps capacity for self-hosting
- Security requirements are manageable
- Customization needs are minimal
2. Specific control or compliance requirements
- You need to audit the source code
- Regulatory requirements prohibit SaaS vendors
- Data must never leave your infrastructure
3. Budget for the true total cost
- You've calculated DevOps time ($50K+/year)
- Infrastructure costs are acceptable
- You're committed to ongoing maintenance
In these cases, open source BI can be cost-effective and powerful.
When Open Source Becomes Expensive
Where we see teams struggling is customer-facing analytics, embedding dashboards into their B2B SaaS product.
The reality: Building customer-facing analytics on open source BI is like using a data warehouse as a transactional database. Technically possible, but not what it was designed for.
Customer-Facing Analytics Demands Speed, Branding, Tenancy and Polish at Once
Customer-facing analytics require:
- Instant performance (customers won't wait 10 seconds for dashboards)
- White-label branding (looks native to your product)
- Multi-tenancy (secure data isolation per customer)
- Self-service (non-technical users exploring data)
- Professional polish (reflects well on your brand)
Open source tools struggle here because they're optimized for internal use, not customer-facing UX.
The build that catches teams out is the one on top of the free licence: white-labelling and multi-tenant isolation, and then discovering that rendering is too slow for customer dashboards. At that point the choice is to keep optimising someone else's rendering layer or to move to platforms built for embedding.
Open Source Deployments Hit Scaling Walls as Customers Are Added
As you add customers, open source BI deployments hit scaling walls:
- Performance degrades with hundreds of concurrent users
- Infrastructure costs skyrocket (more servers, bigger databases)
- Complexity multiplies (caching, load balancing, query optimization)
You either invest heavily in optimization (expensive engineering time) or accept poor user experience (customer churn risk).
When It Breaks There Is No Vendor Support Team
When things break (and they will) there's no vendor support team.
You have three options:
- Community forums: Hope someone solved your exact problem
- Hire consultants: $200-$400/hour for expert help
- Figure it out yourself: Engineering team debugging in production
For customer-facing features, downtime means revenue impact. That's a risky dependency on community support.
Each Leading Open Source BI Tool Trades a Different Limitation for Its Strength
If you've decided open source makes sense, here are the leading options from our BI tools comparison research:
Metabase
- Best for: Internal analytics, SQL-comfortable teams
- Strengths: Clean UI, easy setup, active community
- Limitations: Basic white-labeling (paid tier), limited customization
Apache Superset
- Best for: Data teams needing advanced visualizations
- Strengths: 40+ chart types, SQL IDE, scalable architecture
- Limitations: Steeper learning curve, requires technical setup
Grafana
- Best for: Time-series data, infrastructure monitoring
- Strengths: Beautiful dashboards, extensive plugin ecosystem
- Limitations: Not designed for business analytics
BIRT (Eclipse)
- Best for: Traditional reporting, Java environments
- Strengths: Mature, reliable reporting capabilities
- Limitations: Dated UI, complex configuration
Pentaho Community Edition
- Best for: ETL + BI workflows
- Strengths: Complete data integration
- Limitations: Heavy, enterprise-focused
Each tool has trade-offs. The "best" choice depends entirely on your use case, technical capacity, and budget for hidden costs.
There Is a Middle Ground Between Self-Hosting and Enterprise BI
If you're a B2B SaaS team looking to add customer-facing analytics, there's a middle ground between "build it yourself on open source" and "pay whatever enterprise BI quotes you."
Purpose-built embedded analytics platforms are designed specifically for your use case:
- An integration measured in minutes rather than sprints. On Sumboard a standard integration runs to about ten minutes; that is our own figure for our own product, not a category benchmark
- No infrastructure to run (the platform is managed); your side stays the data connection and the dashboards
- Built-in multi-tenancy (secure data isolation by default)
- Professional white-labeling (your brand, not ours)
- Predictable pricing (€199-€499/month with no per-user fees)
Embedded analytics products like Sumboard give you the control and customization of open source, with the reliability and support of commercial software, at a fraction of enterprise BI costs.
The bottom line: Open source BI tools are excellent for internal analytics with technical teams. But for customer-facing use cases, purpose-built solutions typically deliver better ROI, faster time-to-market, and lower total cost of ownership.
The "free" option isn't always the cheapest option.
Where to go next
- BI tools comparison guide: which platforms survive being embedded, judged on the embedding rather than the connector list.
- Grafana alternative: grafana visualizes far more than infrastructure metrics.
- BI Tools & Comparisons articles: every article in this cluster.
Ready to launch customer-facing analytics?
Stop losing customers to competitors with better analytics. Sumboard's customer-facing analytics platform lets you launch self-service dashboards in days, not months.