
We've been watching SaaS teams evaluate enterprise BI tools lately, and the same pattern keeps showing up. Product managers start researching embedded analytics options, Sisense and Looker appear in the comparison spreadsheet, they schedule demos with both vendors, and then something interesting happens, they start looking for alternatives.
The challenge isn't that Sisense or Looker are bad products. They're both powerful platforms that serve specific use cases well. The issue is that both were built for large enterprises with dedicated BI teams and substantial budgets. When you're a B2B SaaS company trying to embed analytics into your product, that enterprise architecture often becomes overhead rather than value.
Let's look at what differentiates these platforms, where they overlap, and more importantly, when neither might be the right fit for your situation.
The Real Cost of Enterprise BI
The first reality check usually comes during pricing discussions.
Looker names its tiers but publishes no price for any of them. Standard, Enterprise and the Embed platform all read Call sales (checked 7 August 2026), so base access, any per-viewer element and implementation are all set by the quote rather than by a rate you can look up. As a Google Cloud product, Looker's economics assume you're an enterprise with predictable user counts and multi-year budget cycles.
Sisense publishes no price. Its Self-Serve tier offers a free trial and Enterprise reads Talk to us (checked 7 August 2026), so what it costs depends on deployment model and scale, though exact pricing requires sales conversations. Like Looker, the published pricing is deliberately opaque, a pattern common in enterprise software that assumes you have procurement teams and negotiation cycles.
But base platform costs are just the beginning. The hidden costs accumulate:
Implementation timelines for either platform are what teams underestimate most. We would budget three to six months, which is our own planning figure rather than anything either vendor publishes. You're not just installing software. You're learning a proprietary data modeling language (LookML for Looker), architecting ElastiCube structures (Sisense), training teams, and building initial analytics content. Neither vendor publishes a rate, so the implementation cost lands wherever your consultant fees and internal team time land. That is a number you can only get from a quote.
Ongoing maintenance requires specialized expertise. LookML developers for Looker command premium salaries because the skill set is specific to that platform. Sisense ElastiCube management requires data engineering knowledge to optimize performance and manage in-memory data structures. You're not just maintaining analytics. You're maintaining platform-specific expertise.
For a SaaS company in the €1M-€50M ARR range, those economics often don't work. You're being asked to commit enterprise-level resources for what should be a product feature, not a separate business intelligence initiative.
Technical Complexity: LookML vs ElastiCube
Both platforms require significant technical investment, though in different ways.
Looker's LookML is a proprietary modeling language that defines your data structure, relationships, and metrics. The advantage is consistency, once your data model is defined in LookML, everyone uses the same metric definitions. The challenge is the learning curve. Engineers we have worked with needed two to four weeks to get comfortable with LookML basics, and several months to become proficient.
From an engineering lead's perspective, LookML creates vendor lock-in concerns. Your data model is written in a language that only works in Looker. If you ever migrate to another platform, you're rewriting that entire semantic layer.
Sisense's ElastiCube approach is different. It's an in-memory analytics database that sits between your source data and your dashboards. You're essentially building a dedicated analytics data store optimized for query performance. The power is in the speed (in-memory queries are fast), but the complexity comes from managing that infrastructure.
ElastiCubes can be RAM-intensive, especially as data volumes grow. Different workloads tend to end up in separate ElastiCubes, which means refresh schedules to tune and memory usage to watch. You're essentially running analytics infrastructure, not just using analytics software.
For embedding analytics, the approaches diverge further:
Sisense offers the Compose SDK, which is code-driven. You're writing React or JavaScript to build custom analytics experiences. The flexibility is high, you can create exactly the UX you want. The trade-off is development complexity. You're building analytics interfaces, not configuring them.
Looker's embedding uses iframes with signed URLs. It's more straightforward to implement initially, but you're working within Looker's UX paradigms. Customization happens through Looker's interface, not your own code. For teams who want analytics to feel native to their product, iframe embedding often feels like a compromise.
Both platforms added AI features recently, Looker's Conversational Analytics and Sisense Intelligence bring natural language querying and automated insights. But these capabilities assume you've already overcome the complexity hurdles of the core platform.
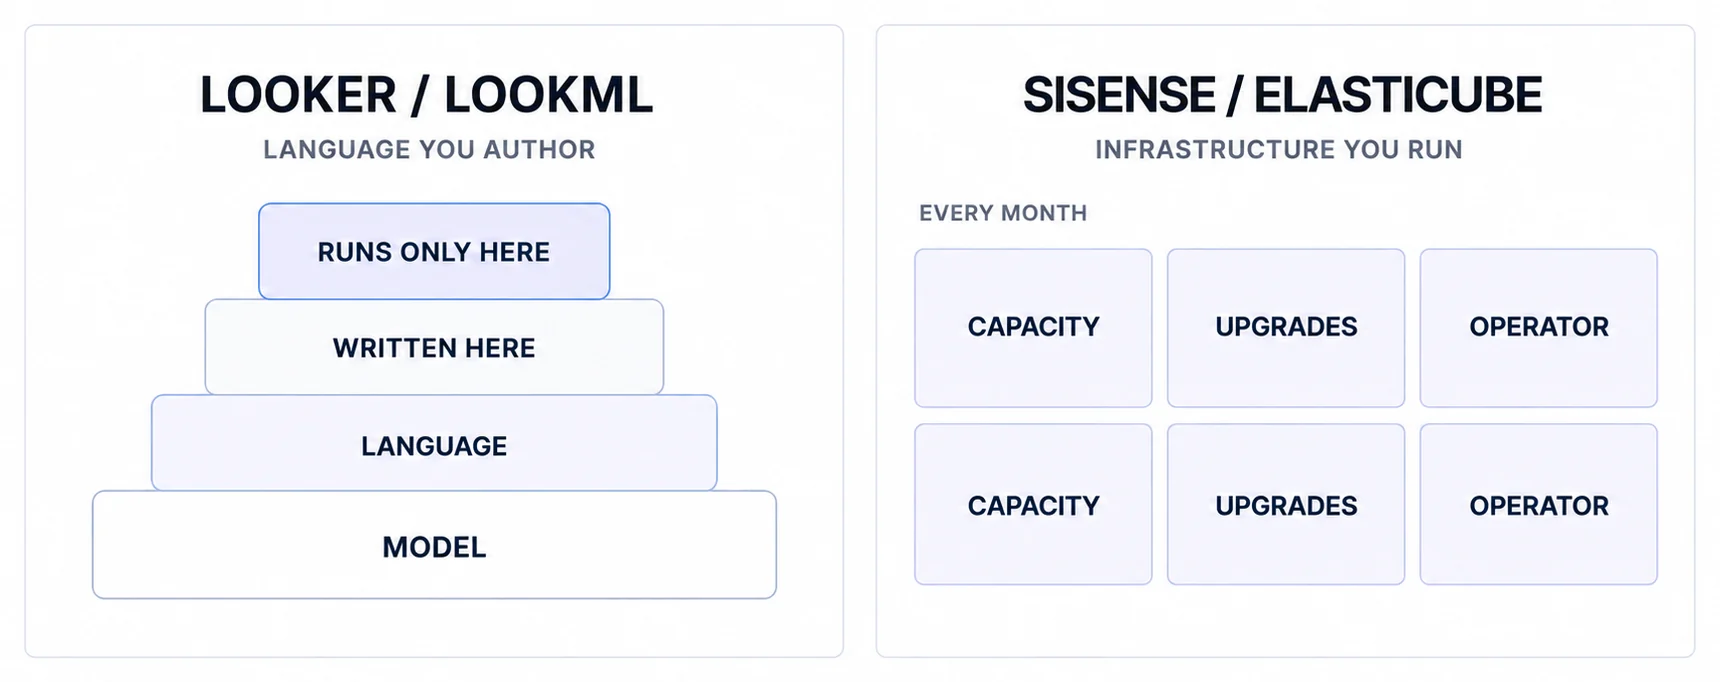
The Deeper Difference Is Where the Data Sits When a Dashboard Loads
Comparing LookML to ElastiCube as two modelling syntaxes understates the split. The two products answer a more basic question differently, and both document their answer.
Sisense moves the data. "Building an ElastiCube imports the data from the data source(s) that you added. The data is stored on the Sisense instance and future dashboard queries will be run against it." The dependency is stated just as plainly: "you must build an ElastiCube at least once before the ElastiCube data can be used in a dashboard", and on a full rebuild, "once the build is complete queries are routed to the new snapshot" (Building ElastiCubes).
Looker does not move it. LookML "separates structure from content, so the query structure (how tables are joined) is independent of the query content", and at read time "when a user creates a query, it is sent to the Looker SQL generator, which translates the query into SQL", after which "the SQL query is executed against the database" (What is LookML?).
What that decides, and what it does not
It is not a verdict. A stored snapshot can be the right answer when the source is slow, expensive to query, or shared with workloads you do not want a dashboard competing against. A live query can be the right answer when the number has to be current and the warehouse can carry the load.
What it does decide is which question you own. With a snapshot you own a schedule: how often the build runs, how long it takes, what a viewer sees while it runs, and how stale the worst-case dashboard is between builds. With live SQL you own a bill and a load profile: every dashboard open is a query against your warehouse, priced and queued accordingly.
For a customer-facing deployment both of those become promises rather than internal trade-offs. A snapshot means telling a customer how fresh their data is; a live query means their dashboard traffic is your warehouse traffic. Decide which of those two conversations you would rather have, because the modelling language is downstream of it.
When You Don't Need Enterprise BI
Here's what we've noticed: most SaaS teams evaluating Sisense vs Looker don't actually need enterprise BI capabilities. They need embedded analytics, which is a different problem with different requirements.
The enterprise BI use case assumes you have business analysts exploring data, building complex reports, and supporting multiple departments with varied analytical needs. You need governance, sophisticated data modeling, and deep analytical capabilities.
The embedded analytics use case is simpler: your customers need dashboards showing their data, with filtering, exports, and scheduled reports. You need fast integration, predictable performance, and smooth UX that matches your product.
For Series A to Series C SaaS companies, the gap is particularly apparent:
Your engineering team has 10-30 people who need to stay focused on core product development. Taking 2-3 engineers off roadmap for the three to six months we would budget to implement Sisense or Looker delays features that actually differentiate your product.
Your product team needs to ship analytics this quarter to meet customer demands or competitive pressure. A 6-month implementation timeline means you're losing deals or seeing churn while waiting for analytics to launch.
Analytics infrastructure has to fit a budget neither vendor will let you size in advance, which is hard when you're carefully managing burn rate and prioritizing spending that drives ARR growth.
The resource constraints aren't just about money. They're about focus. Enterprise BI platforms assume you have dedicated resources to manage them. Most SaaS product teams don't, and shouldn't need to.
What SaaS Teams Actually Need
When we talk to teams who evaluated Sisense and Looker but chose alternatives, the requirements they actually prioritize are different from what enterprise BI platforms optimize for. Working through a Sisense alternative evaluation surfaces the same four:
Standard SQL instead of proprietary languages. Your developers already know SQL. Learning LookML or managing ElastiCubes is overhead that doesn't make your product better, it just delays shipping analytics.
Modern SDK architecture with clean APIs for React, Vue, or Angular. Your product is built with modern frameworks. For embedded analytics implementation, analytics should integrate naturally, not require iframe workarounds or complex JavaScript SDKs that feel bolted on.
Fast integration measured in days, not months. The difference between a 10-minute integration and a 3-month project is the difference between shipping analytics this quarter versus next year. For resource-constrained teams, that timeline difference is critical.
Transparent pricing with clear monthly costs and no surprise bills. When you're planning budgets and defending spending to finance teams, "contact sales" pricing models create unnecessary friction.
Built-in multi-tenancy with security and authentication as standard features, not complex configurations. For SaaS products, proper multi-tenant architecture and data isolation isn't optional, it needs to be core platform capability.
This is why we built Sumboard specifically for this use case. Not to compete with Sisense or Looker on enterprise BI features, but to solve the embedded analytics problem that most SaaS teams actually face.
Nicolas from Cashpad needed analytics embedded in their restaurant management platform. The team didn't need sophisticated data governance or complex data modeling. They needed clean dashboards showing restaurant performance data, integrated quickly enough to demo to customers immediately.
The entire Sumboard integration took 10 minutes. No LookML to learn, no ElastiCubes to configure, no multi-month implementation project. Just connect the data source, configure authentication, and embed dashboards.
"Analytics is one of the first things we are showing to our customers during the demo sessions of our product. Now it looks so much better than before, and works faster."
Nicolas, CTO at Cashpad
Our embedded analytics platform starts at €199/month with unlimited viewer seats. Not a figure you have to book a call to discover. That is the difference worth weighing: you can read our price on the page and put it in a budget today, which is not true of either platform above.
Over ten years Sumboard is €23,880-€59,880 of licence on its published Growth and Business tiers. Neither Looker nor Sisense publishes a price, so what either would cost you over the same period is set by a quote rather than a rate we can print. That asymmetry is itself the point: one of the three you can budget today, and two you cannot until you have been through a sales cycle.
For teams choosing between Sisense and Looker, the question often becomes: do we need enterprise BI capabilities, or do we need to embed analytics quickly? If it's the latter, both platforms are solving a different problem than the one you actually have.
When Enterprise BI Still Makes Sense
Sisense and Looker aren't wrong for every scenario. There are situations where their enterprise capabilities justify the investment.
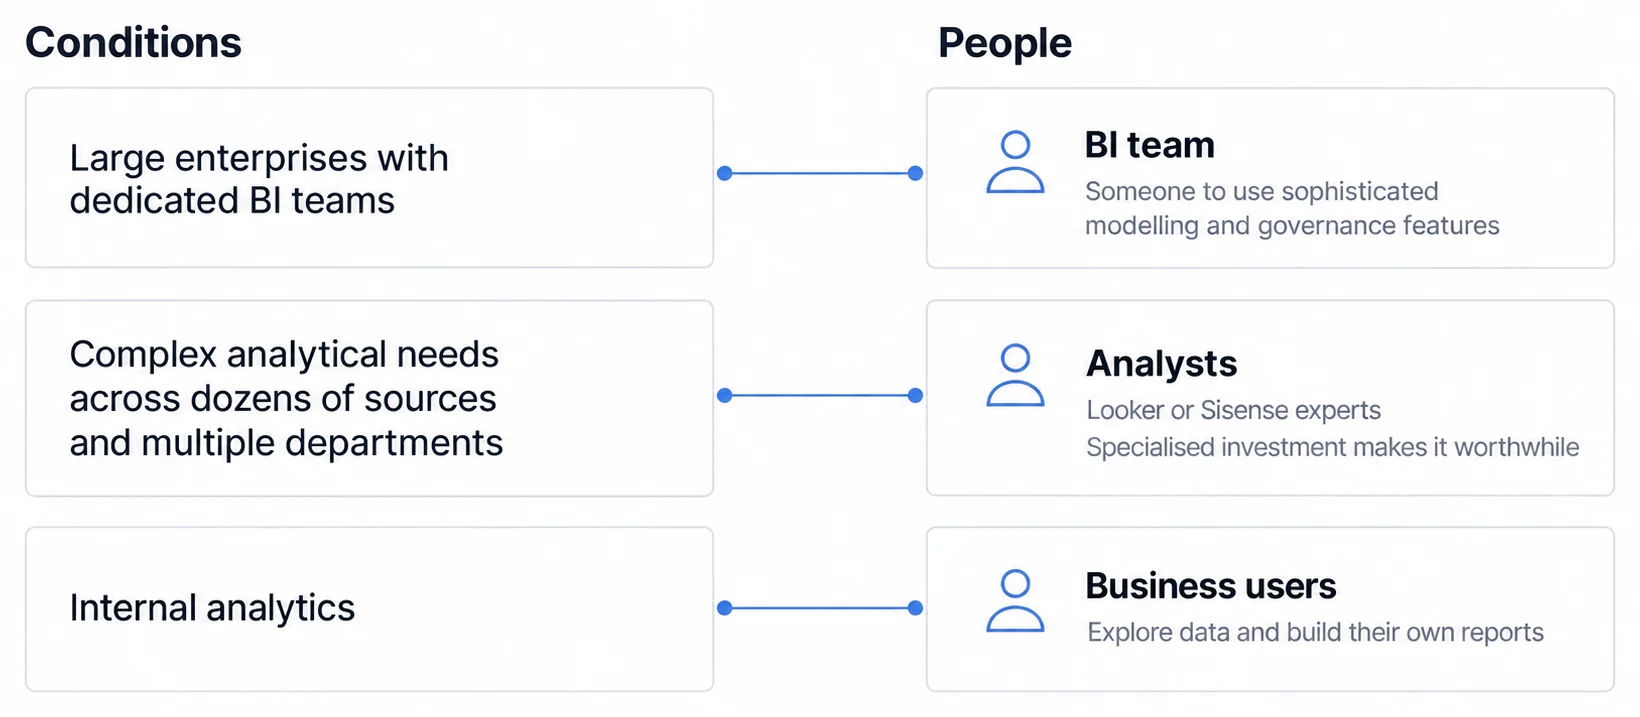
Large enterprises with dedicated BI teams can use the sophisticated data modeling and governance features both platforms offer. If you have analysts who will become Looker or Sisense experts and build complex analytical applications, that specialized investment makes sense.
Complex analytical needs where you're combining dozens of data sources, building intricate data models, and supporting varied analytical workflows across multiple departments. Both platforms excel at this level of complexity.
Internal analytics where you're empowering business users to explore data and build their own reports. The self-service capabilities of both Looker and Sisense shine in this use case.
But if you're a SaaS product team trying to embed analytics for your customers, you're probably not in these categories. You need different capabilities (speed, simplicity, and integration quality) not enterprise BI depth.
Our BI tools comparison guide breaks down when different platforms make sense for different use cases. And if you want to explore the full range of embedded analytics options, our guide to embedded analytics alternatives covers what's available.
Where to go next
- BI tools comparison guide: which platforms survive being embedded, judged on the embedding rather than the connector list.
- Evaluating a Looker Alternative: a Looker replacement decision should inventory semantics, access, embedding, artifacts.
- BI Tools & Comparisons articles: every article in this cluster.
Ready to launch customer-facing analytics?
Stop losing customers to competitors with better analytics. Sumboard's customer-facing analytics platform lets you launch self-service dashboards in days, not months.