We've been hearing a familiar story from SaaS product managers. They're using Tableau internally for business intelligence, it works well for the analytics team. Then someone suggests: "Let's embed these dashboards into our product for customers."
The technical team gets it working. But then the feedback starts.
"Why does this analytics section look so different from our app?"
"The dashboard takes 6 seconds to load. Our customers are complaining."
"Can we change the date picker to match our design system? No? Really?"
Tableau's approach to embedded analytics was built as an extension of their internal BI platform. For many SaaS teams, that's where the friction begins.
Tableau Is Not a Weak Product, It Is an Internal BI Product Pointed at Customers
The pattern we're seeing isn't about Tableau being a bad product. Tableau is powerful for internal business intelligence, data analysts love the flexibility for ad-hoc exploration. But Customer-facing analytics have different requirements, which is why a purpose-built customer-facing analytics product exists.
Many teams evaluate multiple platforms before deciding. Some compare Tableau with alternatives to Looker or Sisense alternatives to understand the full embedded analytics landscape.
The Rendering Boundary Changes What Your Product Owns
Tableau's current Embedding API v3 exposes a <tableau-viz> web component and JavaScript API. Tableau's own configuration documentation also describes the iframe created beneath that component, including its loading behavior and CSS hooks. The useful question is therefore not whether the integration has a modern API label. It is which parts of the experience remain across a browser and product boundary. See Tableau's documentation for the Embedding API v3 web component and its iframe attributes.
Runtime behavior needs measurement. Initial load depends on workbook complexity, query and extract behavior, authentication, caching, network conditions, and when the embedded surface is initialized. Test representative dashboards at the percentiles and device classes your product actually serves.
Responsive behavior needs an explicit contract. The host application owns the space available to analytics; the embedded view owns its internal layout. Define supported breakpoints, minimum dimensions, overflow behavior, and how the surrounding page responds when the view changes size.
Security is a trust path, not a styling option. Tableau documents connected apps, JWT scopes, domain allowlists, permissions, and other authentication routes for embedded content. A secure implementation must preserve the signed-in viewer's scope from the host application to the permitted Tableau content. Review Tableau's authentication and embedding requirements before treating a successful render as a successful integration.
Interaction continuity must be prototyped. Filters, focus order, keyboard behavior, errors, loading states, and navigation can feel cohesive or foreign depending on the implementation. A production-shaped prototype is stronger evidence than the words iframe, web component, or SDK.
One engineering lead told us: "Our customers kept asking why the analytics section felt bolted on. Technically, it was, we were loading an entirely separate application."
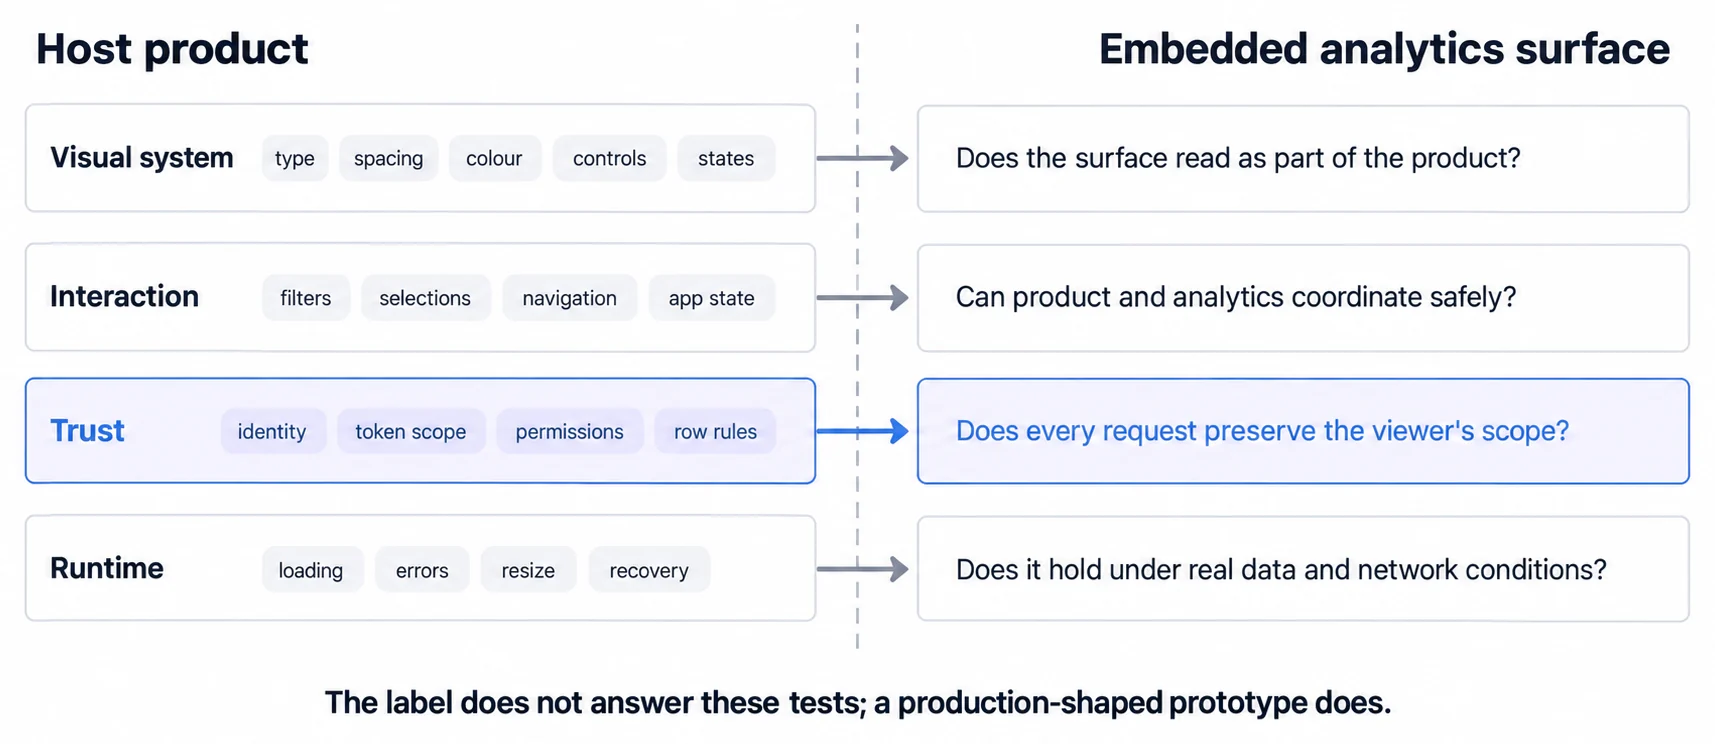
Tableau White-Labelling Reaches Colours and Fonts and Then Hits a Wall
Tableau lets you adjust brand colors and fonts. But deeper customization hits walls quickly.
Tableau exposes documented configuration properties, events, and APIs, but that is not the same as owning every rendered control. If matching a custom date picker, filter, export flow, or empty state is a requirement, verify that exact state in a prototype rather than inferring it from a feature checklist.
Modern design systems define spacing scales, typography, focus behavior, and state patterns. Record which of those tokens can be applied directly, which require host-owned controls, and which remain part of the embedded surface. The remaining mismatch is the real white-label gap.
For B2B SaaS companies where professional appearance drives buyer confidence, this matters. Your sales engineering team shows a demo where everything looks cohesive, until they reach the analytics section.
Embedded Pricing Is Not One Viewer-Seat Formula
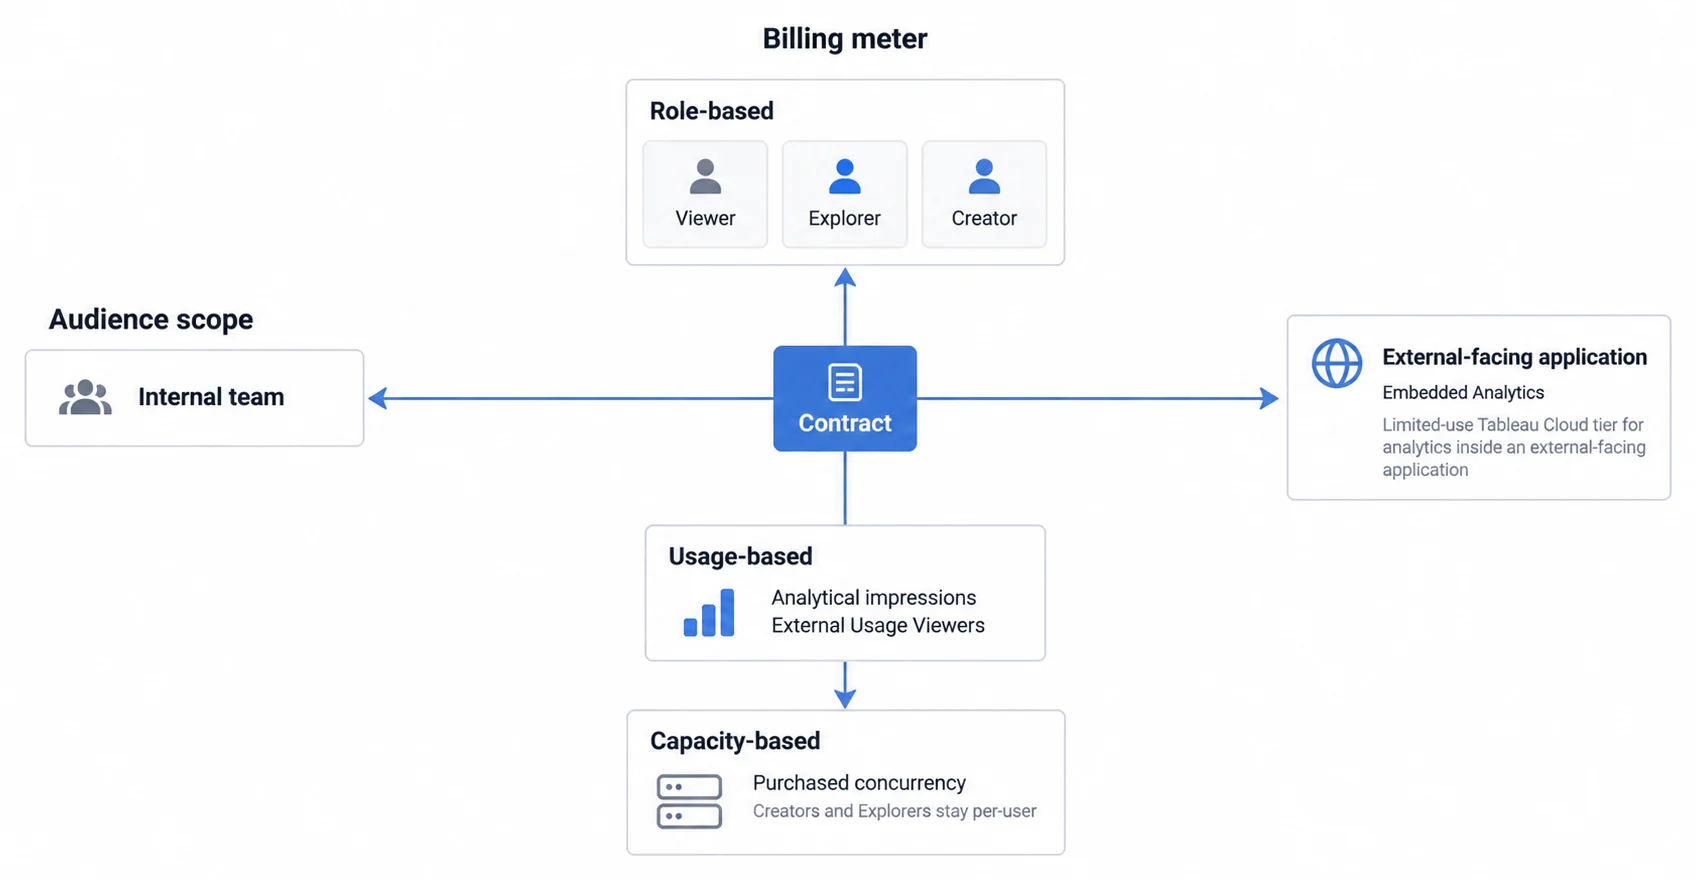
Tableau currently documents several licensing meters. Role-based licensing follows licensed users and their roles. Usage-based licensing measures analytical impressions for external Usage Viewers while Creators and Explorers remain per user. Capacity-based licensing, introduced in July 2026, replaces per-Viewer pricing with purchased concurrency capacity while Creators and Explorers remain per user. Tableau describes Embedded Analytics separately as a limited-use Tableau Cloud offering for content delivered through an external-facing application. The current definitions are in Tableau's license-model documentation.
That means a buyer cannot infer the commercial model from the word embedded. Ask which meter applies to the proposed deployment, which actions create consumption, what remains licensed per user, and how the contract handles growth in external viewers and peak concurrency.
The problem is not a universal rate; Tableau does not publish a single embedded deployment price. The forecasting job is to map the quoted meter to your own audience and usage model before comparing it with a flat plan, a different consumption meter, or an internal build.
The Embedded Licence Will Not Live Beside Your Internal One
One line in that documentation is a deployment constraint rather than a pricing nuance, and it is the line most likely to surprise a team that already runs Tableau internally: "Embedded Analytics licenses cannot be used in the same environment as full-use licenses" (Understanding License Models).
Read against the same page's definition of the audience, "a Usage Viewer (who must be a viewer outside your organization)", the shape becomes clear. Internal analysts and external customers are not two audiences inside one Tableau estate, they are two estates.
That is not automatically a reason to leave. It is a cost line that a feature comparison will not show you: a second environment to provision, a second set of content to keep in step with the first, and a definition of a metric that now exists in two places and can drift between them.
So the question to put to a Tableau quote is narrower than "what does embedding cost". Ask what the second environment costs to run, who keeps content synchronised between the two, and what happens to a dashboard that internal staff and customers are both supposed to see.
Judge a Tableau Alternative on the Rendering Boundary, Not the Integration Label
When evaluating embedded analytics alternatives, technical architecture matters more than feature comparison charts. That is the lens our embedded BI tools comparison applies across the wider field, Tableau included.
Test the Boundary Instead of Trusting the Integration Label
An SDK can expose component APIs, events, and application-state integration. A web component can do some of the same. Either can still depend on a remote rendering surface, and either can be implemented well or badly.
Measure the requirements that affect your product: initial and repeat load, interaction latency, resize behavior, error recovery, authentication handoff, filter synchronization, accessibility, and the amount of UI your design system can truly control. Use representative data and the same network profile for every candidate.
Then record ownership. The host application may own navigation and state while the analytics product owns rendering and query execution. If a required control cannot be replaced or coordinated through the supported API, that is an architectural constraint regardless of the label on the integration package.
Our embedded analytics platform comparison covers the broader acceptance work for assessing different platforms' technical approaches.
Look Past Logo Swaps to What the Customer Can Still Recognise
Look beyond logo swaps and color adjustments. Effective white-label customization means:
Complete design system control. Apply your typography scale, spacing system, color palette, shadows, borders, and radii exactly. Not "similar to" your design system, identical.
Component-level customization. Modify every interactive element. Date pickers, filters, tooltips, loading states, empty states, error messages. If it appears on screen, you should control how it looks and behaves.
Brand invisibility. Your customers should never know they're using a third-party analytics tool. No vendor branding, no telltale UI patterns, no breaks in consistency.
Analytics Cost Has to Scale With Your Revenue Model, Not Against It
For SaaS companies with usage-based or per-seat revenue models, analytics costs need to scale predictably.
Avoid platforms where:
- Pricing isn't published (requiring sales calls for basic information)
- Per-user fees multiply as your customer base grows
- Feature access locks behind enterprise tiers
- Usage metrics create surprise bills
The best alternatives publish clear pricing and let you calculate costs before committing budget.
Sumboard Was Built for Product Teams Shipping Customer-Facing Analytics
We built Sumboard specifically for SaaS product teams who need to ship analytics fast without compromising quality or control.
One Sumboard Customer Reported a First Dashboard in Ten Minutes
Cashpad integrated their first dashboard in 10 minutes, from signup to seeing analytics in their product. That is one documented implementation, not a universal deployment promise.
Sumboard also uses iframe delivery, which is why the integration label alone is not the comparison. Test its dashboards with your data, authentication flow, target devices, and network profile. Built-in row-level security supplies the tenant-scoping mechanism; your implementation still needs the correct identity and policy inputs.
Sumboard owns the embedded rendering and delivery layer. Your team still owns the source data contract, authentication configuration, authorization policy, and product acceptance tests.
For Nicolas at Cashpad, the speed difference was immediately visible:
"Analytics is one of the first things we show customers during product demos. Now it looks much better and works faster."
Nicolas, CTO at Cashpad
Every Visual Element Is Customisable, Which Is the Point of White-Label
Every visual element is customizable:
- Granular design control for precise brand matching
- Configurable interaction patterns
- Your branding throughout the entire experience
Orbility completed its broader analytics and data-infrastructure project in 3 months, including customer-facing reporting matched to the product design. The case study distinguishes that full modernization from Cashpad's smaller first-dashboard integration.
The embedded analytics platform was built for this use case. White-labeling isn't an add-on feature. It's how the platform works.
Transparent Pricing (€199-€499/month)
Our pricing is straightforward:
- Growth (€199/month): Up to 10 embedded dashboards, unlimited viewers
- Business (€499/month): everything in Growth, plus a custom PDF layout builder, dashboard localisation, versioning and priority support
No per-viewer fees and no capacity meter on the published tiers. Growth and Business are on the pricing page; Enterprise is quoted.
Significantly cheaper than building in-house, which typically occupies a dedicated engineering team for 6-12 months plus the maintenance that follows. How it compares to enterprise BI depends on the quote you get, since Looker, Sisense and GoodData publish no price.
See how Sumboard's embedded analytics compares to building or buying traditional BI platforms.
Tableau Still Wins When the Audience Is Internal Analysts
Tableau remains a strong choice for specific use cases.
Large enterprises with dedicated BI teams can use Tableau's sophisticated data modeling and governance features. If you have analysts who will become Tableau experts and build complex analytical applications, that investment makes sense.
Internal analytics where users need deep analytical capabilities. Tableau excels at self-service analysis for business users who need to explore data without technical expertise. The learning curve pays off for daily users.
Complex data environments where Tableau's data preparation and blending capabilities provide real value. When you're combining dozens of sources with complex transformations, Tableau's tools are powerful.
For comparing traditional BI tools like Tableau and Power BI for internal analytics, both platforms offer reliable capabilities.
But if you're a SaaS product team trying to embed analytics for your customers, those strengths become overhead. You need speed, simplicity, and predictable costs, not enterprise BI complexity.
Move Off Tableau One Dashboard at a Time, Starting With a Proof of Concept
Teams moving from Tableau to Sumboard typically follow a similar pattern. Start with one dashboard as a proof of concept, validate the integration works with your stack, confirm your customers get the analytics they need, then expand coverage.
Migration scope depends on what the existing workbooks actually use. Inventory calculated fields, extracts, permissions, subscriptions, exports, filters, and downstream workflows before estimating the switch. A proof of concept should exercise the hardest representative dashboard, not the simplest one.
Where to go next
- BI tools comparison guide: which platforms survive being embedded, judged on the embedding rather than the connector list.
- Looker vs Metabase: looker and Metabase both support embedded analytics.
- BI Tools & Comparisons articles: every article in this cluster.
Ready to launch customer-facing analytics?
Stop losing customers to competitors with better analytics. Sumboard's customer-facing analytics platform lets you launch self-service dashboards in days, not months.