The Tableau vs Power BI debate has filled countless blog posts, forum threads, and internal team discussions. Analysts defend Tableau's visualization power. IT teams champion Power BI's Microsoft integration. Finance departments point to the price difference.
But here's what we're noticing from conversations with B2B SaaS teams: most are asking the wrong question entirely.
If you're building a SaaS product and your customers are requesting analytics, the "Tableau vs Power BI" comparison becomes irrelevant fast. Both tools were designed for internal business intelligence, helping your team analyze data. Neither was built for what you actually need: embedding analytics directly into your product for customers to use.
Before we get into why that matters, let's cover the basics of what makes these tools different.
Tableau and Power BI Do the Same Job, and Differ in Who They Assume Is Driving
At a high level, Tableau and Power BI serve the same purpose: turning raw data into visual insights. Both connect to data sources, build dashboards, and help teams make decisions. The difference lies in their philosophy and who they're designed for.
Tableau Built Its Reputation on Visualisation Flexibility and Analytical Depth
Tableau, now owned by Salesforce, built its reputation on visualization flexibility and analytical depth. Data analysts love it because it doesn't constrain how they explore data. The drag-and-drop interface gives them freedom to create custom visualizations, blend data sources, and dive deep into complex datasets.
Tableau excels when you need sophisticated visualizations and have analysts who want control over every detail. Companies like Netflix and LinkedIn use it for internal analytics where visualization quality and exploration capabilities matter more than price.
The tradeoff? That power comes with complexity. Learning Tableau well takes time, and the price tag reflects its premium positioning.
Power BI Was Designed to Fit the Microsoft Ecosystem First
Power BI takes a different approach. Microsoft designed it to fit smoothly into their ecosystem, Excel, Azure, SQL Server, SharePoint. If your organization already runs on Microsoft tools, Power BI feels like a natural extension rather than a separate product.
The interface prioritizes accessibility over depth. Business users can build basic dashboards without extensive training. Power Query handles most data transformation tasks. Natural language queries let non-technical users ask questions in plain English.
This accessibility strategy works. At the entry tier Power BI and Tableau are closer than their reputations suggest, and Power BI gets people creating dashboards faster. For internal reporting in Microsoft-heavy organizations, that combination is hard to beat.
Tableau and Power BI Licence Fees Are the Part of the Cost You Can Look Up
Price comparisons dominate most Tableau vs Power BI discussions, and for good reason. The numbers look dramatically different.
All figures below were read from each vendor's own pricing page on 31 July 2026. Both change their packaging fairly often, so check the date on this page against theirs before you rely on it.
Power BI Pro Publishes $14.00 per User per Month, Paid Yearly
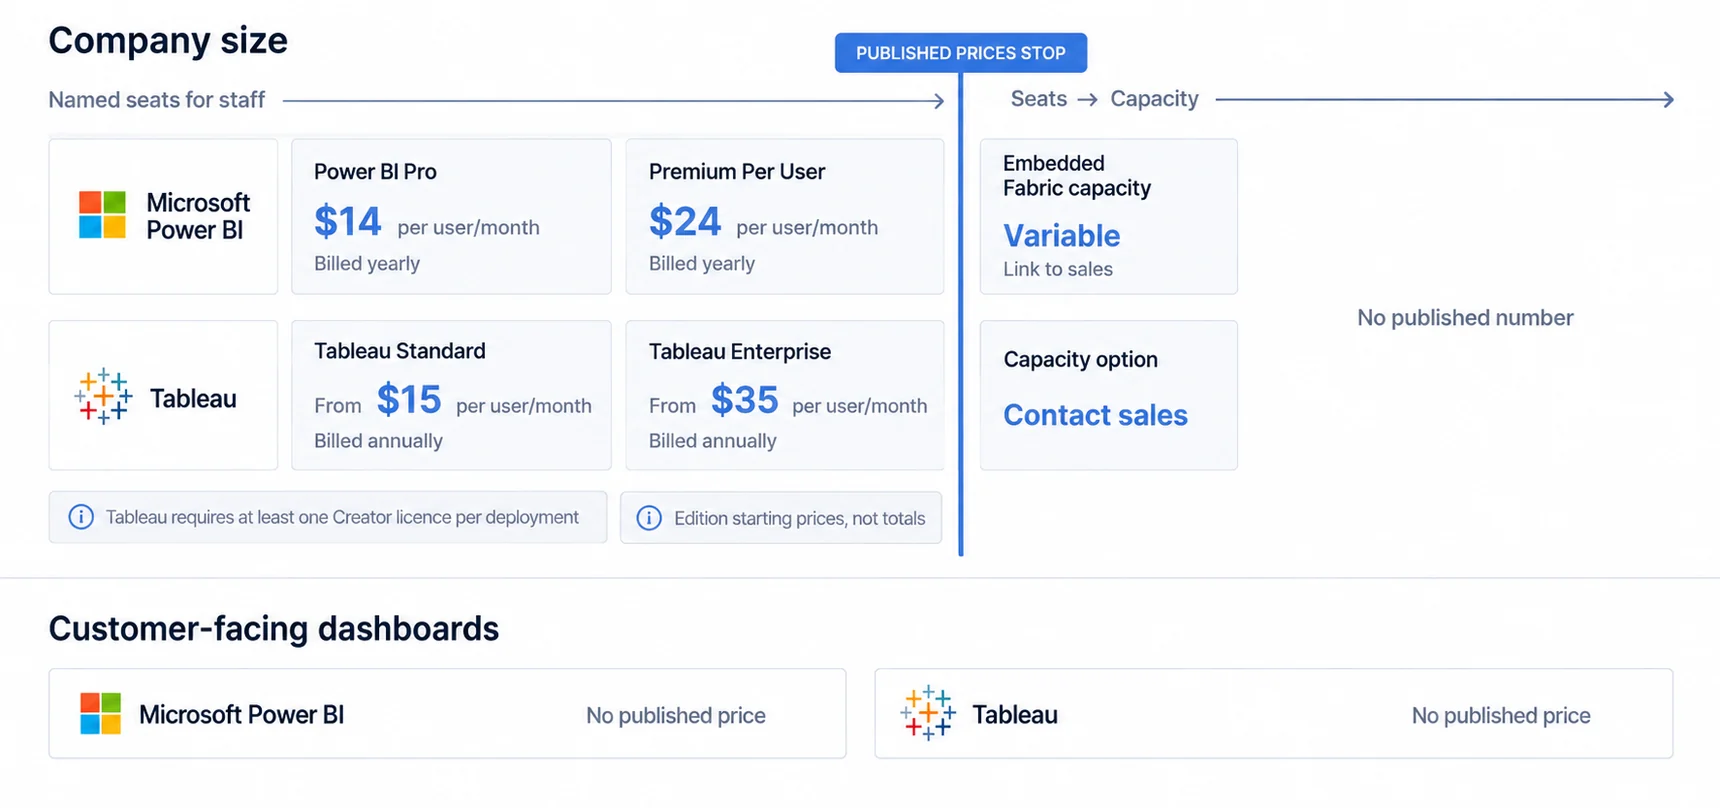
Power BI Pro is $14.00 per user per month, paid yearly. That gives you the ability to create and share dashboards within your organization, and for most internal teams it handles basic reporting.
Power BI Premium Per User is $24.00 per user per month, paid yearly, adding larger models and more frequent refreshes.
Capacity is the third route, and Microsoft no longer prints a price for it. Power BI Embedded and Fabric capacity are both listed as "Variable" with a link to sales, so if your plan depends on capacity rather than seats, you cannot size it from the pricing page alone.
Tableau Publishes Edition-Level Starting Prices, From $15 per User
Tableau publishes edition-level starting prices: Tableau Standard from $15 per user per month and Tableau Enterprise from $35, both billed annually. Cloud+ and the Tableau+ bundle are contact-sales, as is the capacity-based option.
Two details matter more than the headline. Every deployment requires at least one Creator licence, so the entry price is not the whole entry cost. And the published rates cover licensed users; if you are putting dashboards in front of customers rather than staff, Tableau publishes no per-embedded-viewer rate at all, which means that case has to be quoted.
Working out which is cheaper
The honest answer is that it depends on a shape only you know. Both price per licensed user at the entry tier, so your own licensed-user count against the rates above gives a floor rather than a total: both figures are edition starting prices, Tableau requires at least one Creator licence per deployment, and neither rate covers embedded viewers. Where the comparison stops working is capacity: neither vendor publishes a capacity price, so beyond a certain size both become quote-driven and the published rates stop predicting your bill.
Hidden Costs Neither Tool Mentions
License fees are just the starting point. Both platforms hide costs that emerge during implementation:
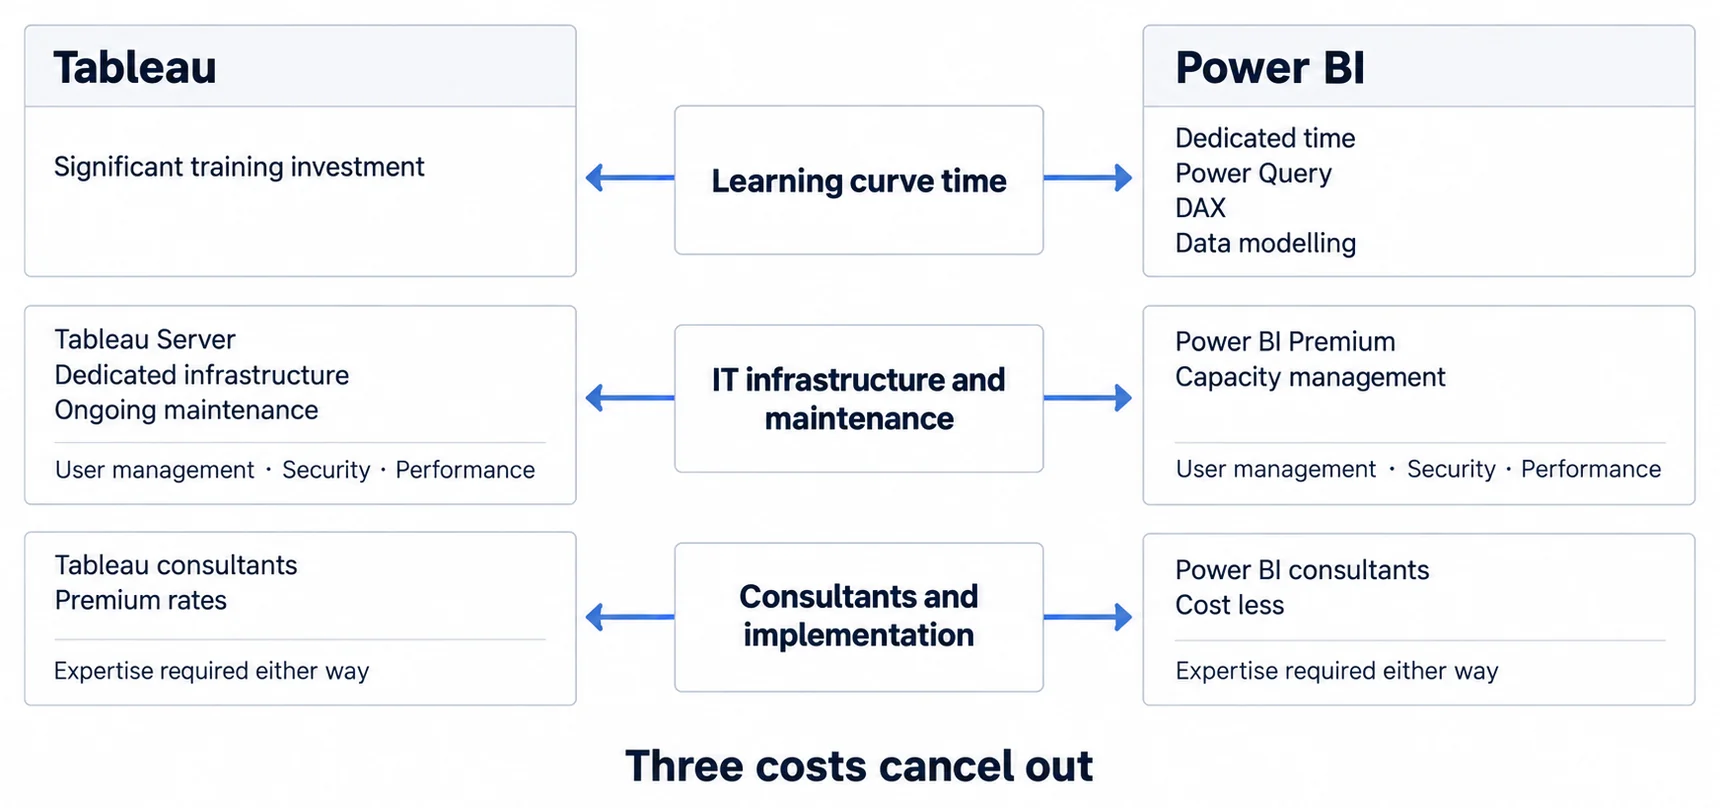
Learning curve time. Tableau requires significant training investment. Even Power BI, despite being "easier," needs dedicated time to master Power Query, DAX formulas, and data modeling. Budget weeks of ramp-up time for each new user.
IT infrastructure and maintenance. Tableau Server requires dedicated infrastructure and ongoing maintenance. Power BI Premium needs capacity management. Both demand IT resources for user management, security, and performance optimization.
Consultant and implementation costs. Complex dashboards often require outside help. Tableau consultants typically charge premium rates. Power BI consultants cost less but you still need expertise for advanced implementations.
For internal analytics, these costs make sense. You're investing in tools your team will use daily. But if you're considering Tableau for embedded analytics or Power BI embedded in a customer-facing product, these hidden costs multiply fast.
Both Connect to Hundreds of Sources, and Differ in Which Ones Feel Native
Both platforms connect to hundreds of data sources. Where they differ is how naturally those connections work.
Power BI's Advantage Only Applies If Your Data Already Lives in Microsoft
If your data lives in the Microsoft ecosystem, Power BI integration feels effortless. SQL Server, Azure SQL Database, SharePoint, Excel files, all connect with native support and optimal performance.
DirectQuery lets you query data in real-time without importing everything into Power BI. For large SQL Server databases, this keeps dashboards current without data replication overhead.
The catch: third-party integrations often feel like afterthoughts. While Power BI technically connects to Salesforce, MySQL, PostgreSQL, and other non-Microsoft sources, the experience isn't as polished. Performance can lag. Features sometimes don't work quite right.
Tableau Connects Beyond Microsoft, Including Oracle, Snowflake and BigQuery
Tableau takes a platform-agnostic approach. It connects to Microsoft sources, but it also handles Oracle, Teradata, Snowflake, Google BigQuery, and dozens of other databases with equal competence.
This flexibility matters for organizations with diverse data stacks. If you're running MySQL for your application database, Snowflake for your data warehouse, and Salesforce for CRM, Tableau handles all three without favoring one vendor's ecosystem.
The performance advantage shows up with truly large datasets. Tableau was built from the ground up to handle massive data volumes. Power BI can struggle when datasets exceed certain thresholds, especially in DirectQuery mode.
Neither Tableau nor Power BI Wins on Visualization, So the Use Case Decides
This is where personal preferences and specific use cases really matter. Neither tool is objectively "better", they excel in different scenarios.
When Tableau Wins
Tableau's visualization engine handles complex, custom visualizations that Power BI can't easily replicate. If you need:
- Highly customized chart types beyond standard bars, lines, and pies
- Geographic visualizations with detailed map layers and custom territories
- Complex calculations across blended data sources
- Pixel-perfect dashboard layouts for executive presentations
...Tableau delivers results that make Power BI look basic by comparison.
The performance advantage with large datasets is real. Organizations working with billions of rows typically choose Tableau because it maintains responsiveness that Power BI can't match at that scale.
Where Power BI Excels
Power BI's strength isn't sophistication. It's speed and accessibility. When you need:
- Quick dashboard creation for standard business metrics
- AI-powered insights from natural language questions
- Real-time streaming data for operational dashboards
- Embedded reports in Microsoft Teams or SharePoint
...Power BI delivers faster with less effort.
The August 2024 Fabric integration added significant analytical capabilities, narrowing the gap with Tableau's advanced features. For most standard business dashboards, Power BI now offers enough visualization options without Tableau's complexity.
For a Product Team the Tableau Versus Power BI Comparison Answers the Wrong Question
Here's where the comparison breaks down entirely for product teams.
We've been talking with B2B SaaS founders about their analytics needs. The pattern is consistent: customers request better reporting, the team evaluates Tableau vs Power BI, someone suggests embedding one of these tools into the product.
Then reality hits.
Why Internal BI Tools Struggle with Customer-Facing Analytics
Both Tableau and Power BI were designed for internal analytics. That design assumption creates fundamental problems when you try to embed them in a customer-facing product:
Multi-tenancy complexity. Your customers need to see only their own data. Implementing proper data isolation in Tableau or Power BI requires complex row-level security configurations that weren't designed for this use case. One misconfiguration exposes customer data to the wrong user.
Branding limitations. Customers expect analytics that match your product's look and feel. Both tools offer white-labeling, but it's limited. Tableau embedded dashboards still look like Tableau. Power BI embedded reports still look like Power BI. Your product's visual consistency breaks.
Performance at scale. When you're serving analytics to hundreds or thousands of customer users simultaneously, internal BI tools show their limitations. Both were optimized for dozens of internal analysts, not thousands of external users.
Cost structure mismatch. Per-user pricing makes no sense for customer-facing analytics. Why pay Tableau $15/viewer/month when you have 10,000 customer users? The math breaks fast.
What "Embedded" Really Means
"Embedded analytics" means more than sticking an iframe on your page. It means analytics that feel native to your product, maintain your security model, scale with your customer base, and don't create vendor lock-in around proprietary query languages.
Neither Tableau nor Power BI was built for that. Tableau requires proprietary calculation expertise. Power BI ties you to Microsoft's ecosystem. Both add complexity to your product architecture rather than simplifying it.
Both Vendors Sell a Separate Licence Class for This, and the Two Are Not Alike
Everything above compares the products people buy for their own staff. Serving customers is a different purchase in both cases, and each vendor documents its own shape.
| What the documentation says | Source | |
|---|---|---|
| Power BI | Two solutions exist. Under embed for your customers, "app users don't need a license"; under embed for your organization, "each app user needs a Power BI license". The customer route is the one tied to the Azure A SKUs, and "to embed in a production environment, you must use a capacity". | Power BI embedded analytics overview |
| Tableau | A usage-based model exists for this audience: "an analytical impression is generated when a Usage Viewer (who must be a viewer outside your organization) accesses one or more embedded analytics", and it "imposes no constraints on the number of Viewer user accounts". It also carries a boundary: "Embedded Analytics licenses cannot be used in the same environment as full-use licenses." | Understanding License Models |
Two consequences follow, and neither shows up in a feature comparison.
The meter changes shape. Power BI's customer route prices a provisioned capacity, so the bill follows the machine you reserve rather than the people looking at it. Tableau's prices consumption, so the bill follows how much your customers actually open.
And Tableau adds a deployment constraint that Power BI's page does not state in the same terms: the embedded licence will not sit in the same environment as the full-use one, which for a team already running Tableau internally means a second estate rather than a second audience.
If your shortlist is the three-way embedded comparison rather than this two-way one, the Power BI Embedded versus Looker Embedded page covers the other pairing, and the Tableau embedded alternative page goes further into the estate question.
A Purpose-Built Embedded Platform Is the Third Answer Neither Comparison Offers
From conversations with product teams who've tried the Tableau/Power BI embedded route, we're seeing a pattern: most wish they'd chosen a purpose-built solution from the start.
Here's what actually matters for customer-facing analytics:
10-minute integration, not 3-month projects. Your engineering team shouldn't spend quarters implementing analytics. Modern embedded analytics platforms integrate via SDK in minutes, not months.
Multi-tenancy by default. Row-level security and data isolation should be built-in architecture, not configuration you have to get exactly right.
Your brand, not theirs. White-labeling should mean truly invisible, your colors, your fonts, your logo on PDF exports. Customers should never know you're using a platform.
Predictable costs. Pay for the platform, not per user. When your customer base scales from 100 to 10,000 users, your analytics costs shouldn't 100x.
The teams finding success aren't choosing between Tableau and Power BI. They're choosing platforms purpose-built for what they actually need: analytics embedded in B2B SaaS products.
Tableau and Power BI are both excellent tools, for internal business intelligence. But if you're building analytics into your product for customers, you're solving a fundamentally different problem. And that problem needs a different solution.
Where to go next
- BI tools comparison guide: which platforms survive being embedded, judged on the embedding rather than the connector list.
- Evaluating a Looker Alternative: a Looker replacement decision should inventory semantics, access, embedding, artifacts.
- BI Tools & Comparisons articles: every article in this cluster.
Ready to launch customer-facing analytics?
Stop losing customers to competitors with better analytics. Sumboard's customer-facing analytics platform lets you launch self-service dashboards in days, not months.