Business Intelligence Tools Comparison: Which Platform Fits Your Embedded Analytics Needs?
Your customers are asking for analytics dashboards. You've weighed building it yourself, and now you're researching BI platforms. The challenge: most comparison guides focus on internal BI use cases, not customer-facing embedded analytics, and the two are priced and built for different jobs.
This guide cuts through the noise. We compare traditional BI giants (Tableau, Power BI, Looker) against modern embedded-first platforms, focusing on what matters for B2B SaaS teams: integration speed, white-labeling capabilities, multi-tenant architecture, and transparent pricing.
What this comparison covers
- Side-by-side comparison of 10+ BI platforms
- Embedded analytics-specific evaluation criteria
- When to choose traditional BI vs. embedded-first solutions
- Which vendors publish a price, which quote per deal, and what each one's meter counts
- Integration complexity analysis
BI Tools All Draw Dashboards, and Traditional Versus Embedded Is the Distinction Buyers Miss
Business intelligence (BI) tools transform raw data into actionable insights through interactive dashboards, reports, and visualizations. But there's a critical distinction most buyers miss: traditional BI vs. embedded BI.
Traditional BI Starts From Internal Reporting, So Governance Is Its First Instinct
Traditional BI platforms usually begin with internal reporting, governed analysis, and reusable semantic content. Analysts and business users query shared data to create reports for colleagues. These tools often prioritize:
- Data governance: Role-based access controls, data lineage tracking
- Collaboration: Shared workspaces, comment threads, version control
- Complex data modeling: Multi-table joins, custom calculations, semantic layers
Examples include Tableau Server (desktop-first visualization), Power BI Desktop (Microsoft's internal BI suite), and Looker (Google's data modeling platform with proprietary LookML language).
Customer-facing use changes the contract. Identity must cross from the host product, tenant isolation must be proven for external viewers, product brand and accessibility surfaces become acceptance criteria, and the commercial meter must be tested against customer growth. Some traditional BI platforms support these requirements; none should be accepted or rejected from the category label alone.
Embedded BI Starts From the Customer's Screen, So Tenancy Is Its First Instinct
Embedded-first platforms focus on customer-facing dashboards integrated into a SaaS product. Common evaluation areas include:
- Tenant-aware authorization: The viewer's identity and permitted data survive every dashboard, export, and delivery path
- Product-surface control: Required brand, accessibility, loading, error, empty, and mobile states can be verified
- Integration APIs: An iframe, web component, SDK, or headless route exposes a documented boundary; the label does not determine quality, see our iFrame vs SDK comparison
- Commercial fit: The meter and included limits can be modeled against the product's actual viewers, usage, dashboards, and support model
Examples: Sumboard embedded analytics (€199-€499/month, unlimited viewers), Luzmo, GoodData.
Real-world example: Cashpad, a European POS provider, embedded Sumboard into their web BackOffice to give their restaurant customers analytics inside the product they already use.
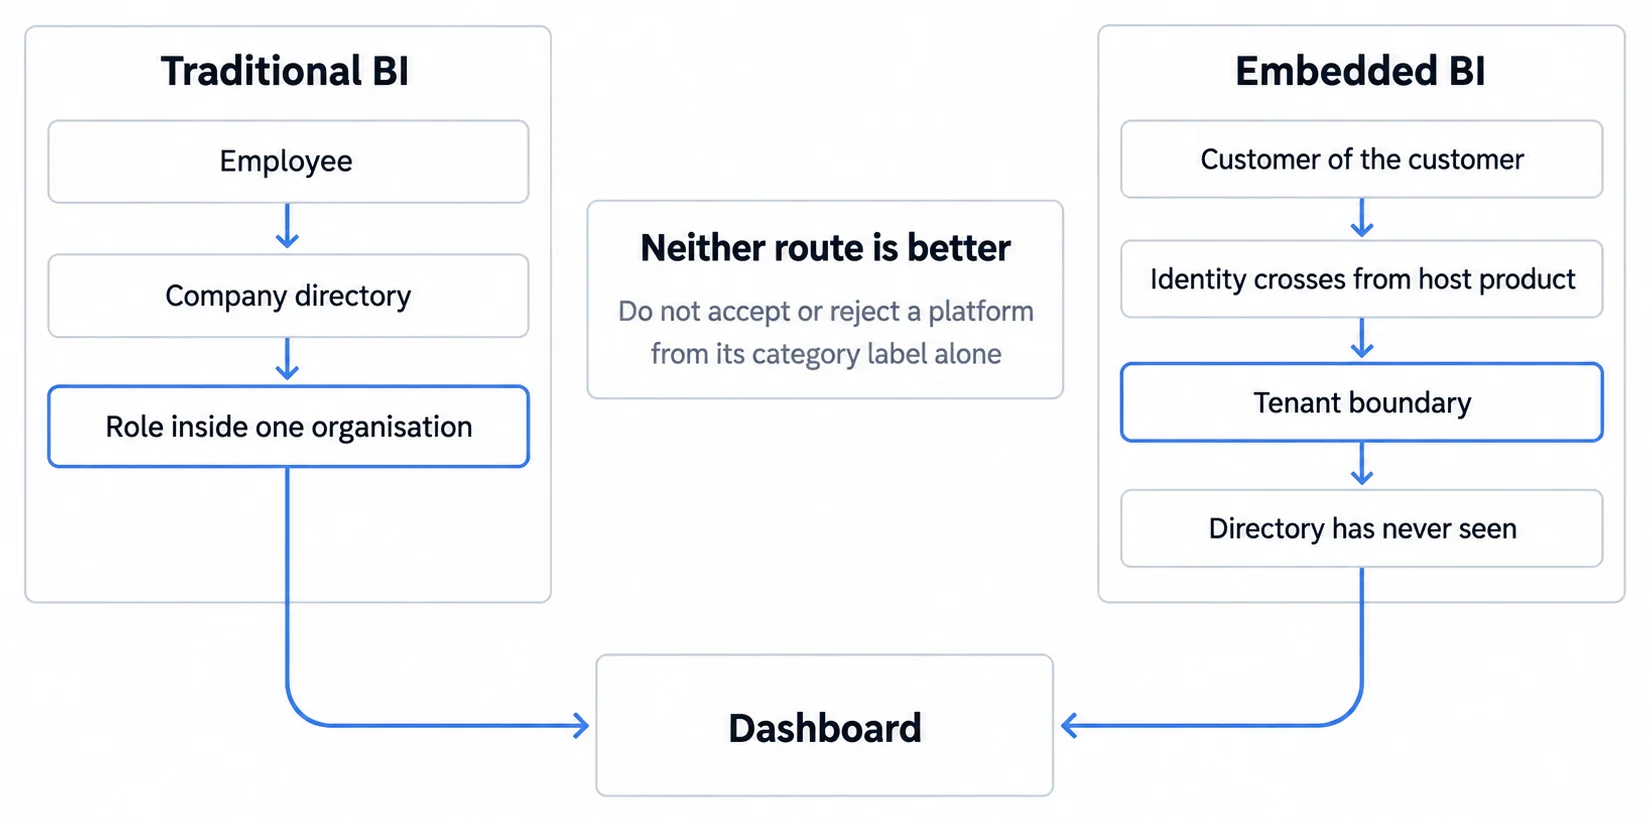
Traditional and Embedded BI Compared on the Dimensions That Change the Build
| Dimension | Traditional BI | Embedded BI |
|---|---|---|
| Primary User | Internal analysts | External customers |
| Delivery context | Employee analysis and governed reporting | Analytics inside a customer product workflow |
| Branding | Internal consistency and governance | Product, tenant, export, and delivery surfaces |
| Pricing meter | Often roles, capacity, or enterprise terms | Flat plans, active users, usage, workspaces, capacity, or quotes |
| Security | Organizational identity and permissions | Host identity plus tenant-aware authorization and denial paths |
| Integration evidence | Existing content and operator reuse | A production-shaped embedded slice measured in the host product |
If you're building analytics for your customers, on your own stack or on a customer-facing analytics product, begin with the customer workflow and operating contract rather than a traditional-versus-modern score. An embedded-first platform may reduce the analytics surface you operate; an existing BI estate may preserve valuable models and governance; self-managed software may satisfy deployment control. The prototype must show what each route actually leaves your team owning.
A BI Platform Is Hard to Leave Once Customers Are Looking at It, So the Wrong Choice Is Paid Slowly
A BI platform is hard to leave once your customers are looking at it, so the cost of the wrong choice is paid slowly: in licence renewals that scale with a number you did not expect, in engineering time spent maintaining someone else's modelling layer, and in the migration you eventually have to run anyway. Here is what to check before you are committed.
A Proprietary Modelling Language Is the Part of a Migration Teams Underestimate
Proprietary modelling languages are the part of a migration people underestimate. Looker's LookML is a modelling layer, not a dialect of SQL, so the definitions your dashboards depend on live in it rather than in your warehouse. Leaving Looker means rewriting those definitions somewhere else, and the size of that job is the size of your semantic layer, not the number of dashboards. Before adopting any platform with its own modelling language, ask what leaving looks like and who would do it.
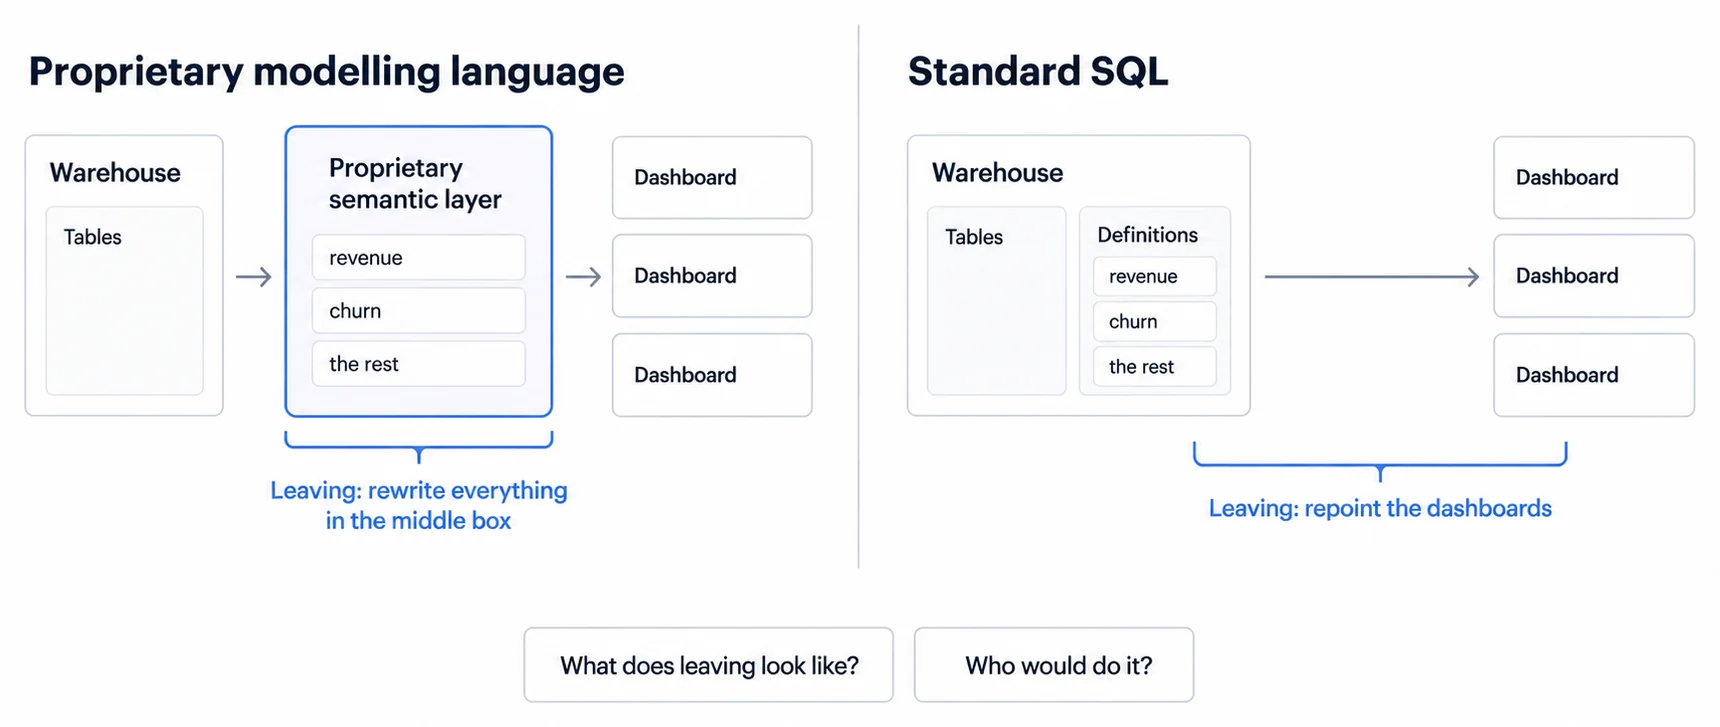
Power BI measures written in DAX create a similar migration question: which definitions can move, which must be rewritten, and which reports depend on product-specific behavior. Inventory that semantic surface during evaluation instead of estimating migration from dashboard count alone.
Integration complexity: Power BI Embedded's App Owns Data route requires server-side identity and embed-token work. The documented responsibilities include:
- Generate embed tokens server-side
- Implement row-level security manually
- Handle token expiration and refresh logic
Sumboard also requires a trusted server to issue correctly scoped tokens. Its integration may expose a shorter path, but the acceptance test is the same: missing, malformed, expired, and cross-tenant contexts must fail without protected data, including exports and scheduled delivery.
Maintenance Burden: Analytics you build yourself does not stop needing engineers once it ships. Query performance degrades as tables grow, chart libraries publish breaking changes, and every new customer-facing metric is a change request. The cost is not the build, it is that a share of your engineering capacity is permanently committed to it. Work out what that share is worth using your own loaded engineering cost, not a benchmark figure, because the answer swings entirely on your salaries and on how much of the surface you actually own.
Multi-Tenant Isolation Is a Security Boundary, Not a Dashboard Filter
Multi-tenant architecture ensures each customer sees only their data through automated row-level security (RLS), preventing data leakage between customers in your SaaS platform.
Multi-tenant isolation: Products express isolation through different combinations of identity, roles, user attributes, workspace boundaries, row policies, and server-side tokens. A feature name does not establish the effective boundary. Trace the signed-in viewer through the embed, query, cache, export, and scheduled-delivery paths, then test denied and missing-context cases.
SOC 2 Compliance: Check vendor certifications before committing. Traditional BI vendors (Microsoft, Google, Salesforce) have SOC 2 Type II, but embedded startups may not. Sumboard's documentation states that the platform inherits its hosting provider's certifications, including ISO 27001, GDPR and SOC 1 and SOC 2; verify what that covers for your specific use case.
When self-hosting is a hard requirement
Regulation, customer contracts, network design, or internal policy may require a controlled deployment. Do not copy a current-plan matrix into a long-lived architecture decision: deployment options and packaging change, and terms may be negotiated. Put the required topology, region, data flow, administrative access, upgrade ownership, recovery target, and audit evidence in the request, then obtain the supported option in current documentation and the written contract.
Estimate Integration Time From Your Own Proof of Concept, Not From a Vendor Range
- Traditional BI planning range: Allow for semantic modelling, server or capacity setup, embedding, authentication, and release review; estimate it with a representative proof of concept.
- Embedded-first planning range: The SDK connection may be short, while data modelling, dashboard design, security review, and production rollout still determine the calendar.
- Sumboard's stated integration path: The SDK connection is measured in minutes in our own implementation path; full deployment depends on the customer's data and review scope.
The Sumboard figure is ours. The others are our reading of each product's documented setup path rather than measurements we ran, so treat them as orders of magnitude and time your shortlist yourself.
Your own renewal conversations are better evidence than any churn benchmark
Reporting can surface in renewal conversations rather than in new-business ones, because it is the part of a product a customer only evaluates properly after living with it. If your own renewal notes or churn interviews mention exports, dashboards or "getting the numbers out", that is the signal worth acting on, and it is more reliable than any industry average.
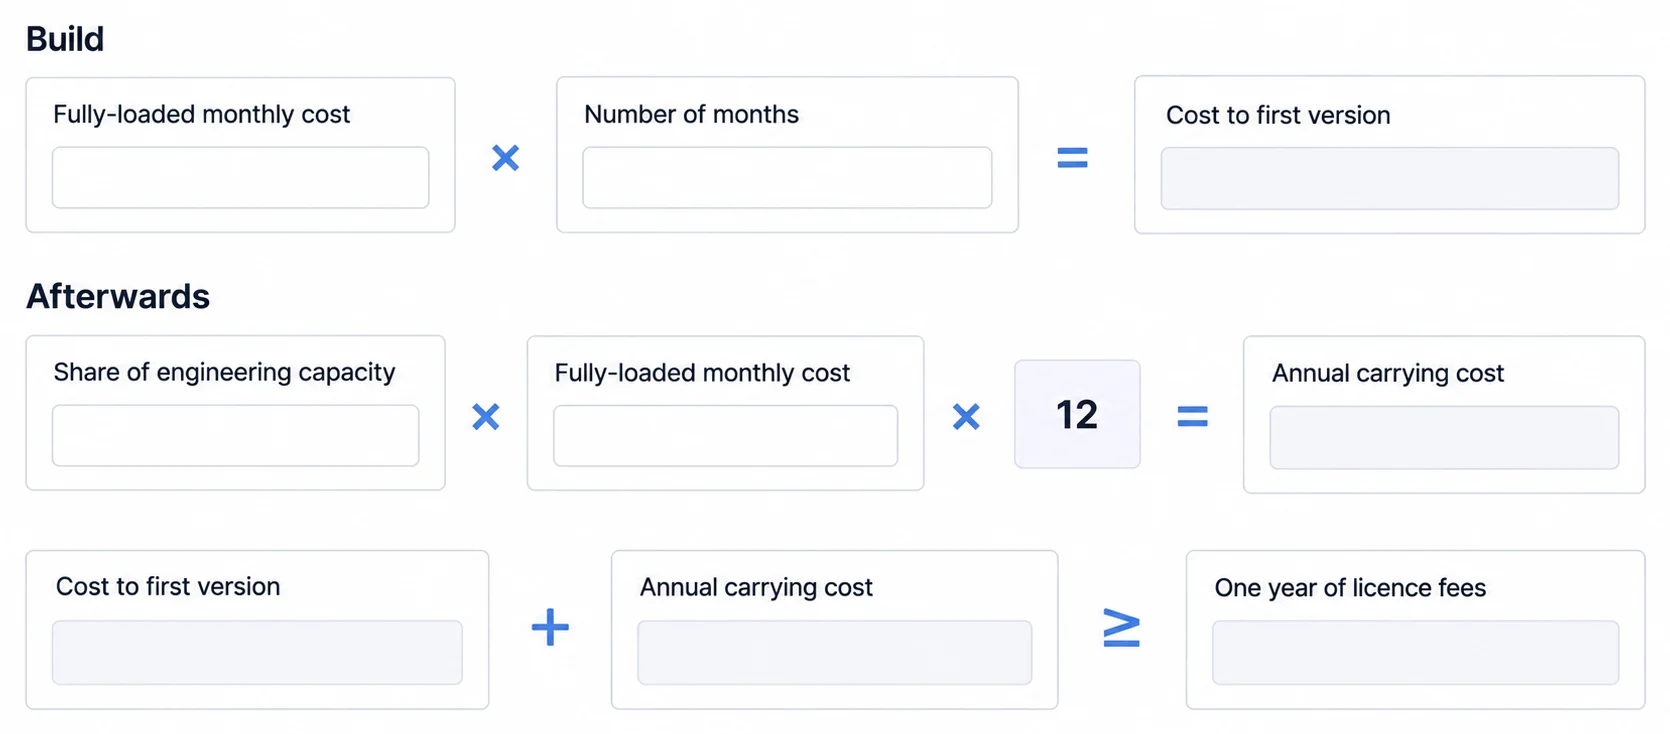
Opportunity Cost: Every month your engineering team spends building analytics is a month not spent on core product features. The way to size this is with your own numbers: take the fully-loaded cost of the engineers who would be assigned, multiply by the months you expect the build to run, and compare that against a year of licence fees. The exercise is worth doing precisely because the answer is not the same for everyone.
What each vendor will actually tell you
Before comparing costs, there is a prior question that decides how your evaluation runs: will the vendor quote a number at all? We checked every pricing page on 31 July 2026.
| Platform | Publishes a price? | Published figure | What the meter counts |
|---|---|---|---|
| Sumboard | Yes | €199/mo Growth, €499/mo Business | a monthly plan fee; viewers unlimited, with limits on dashboards and scheduled emails |
| Luzmo | Yes | from €995/mo Starter and €2,495/mo Premium, billed annually | solutions deployed and monthly active users |
| Metabase | Yes | base $100/mo Starter (5 users included, then $6/user) and $575/mo Pro (10 included, then $12/user); Enterprise from $20,000/yr | users, once the included block is used up |
| Grafana Cloud | Yes | free tier; Pro $19/mo platform fee plus $8.00/active user and $6.50/1k series; Enterprise from $25,000/yr commitment | usage: series, GB and active users |
| Tableau | In part | edition starting prices are published, not role rates; the embedded deployment requires validation | roles, analytical impressions, or capacity, depending on the licensed model |
| Power BI Embedded | In part | six of the eight nodes carry a price, from $735.913/mo for A1 to $23,542.938/mo for A6; A7 and A8 read N/A | capacity node hours, shown as a monthly equivalent |
| Looker | No | Standard, Enterprise and Embed all read "Call sales" | agreed per deal |
| Sisense | No | Enterprise reads "Talk to us" | agreed per deal |
| GoodData | No | both tiers require contact | workspaces plus a platform fee |
| Reveal | No | no tiers and no figures; the page is a single "Request a Personalized Quote" form | described on the page as flat-rate, with unlimited users |
Four of these ten will not name a figure, and they do not all mean the same thing by it.
Power BI Embedded is worth separating out for the opposite reason. Its node table is the most explicit pricing on this page: six of the eight sizes carry a monthly figure, from $735.913 for a single-core A1 to $23,542.938 for a 32-core A6. The two largest nodes, the 64-core A7 and the 128-core A8, read N/A. What makes even the priced part feel unpriced is that the number you are quoted is a capacity, not a seat or a viewer, so you cannot read your own bill off it until you know which node your workload needs. Microsoft's Azure pricing calculator closes that gap, so a workload that fits inside A1 to A6 is one you can budget for on your own. Two things travel with that: above A6 you are back to talking to sales like everyone else on this page, and Microsoft's own footnote calls these figures estimates rather than price quotes (read on the Azure pricing page, Central US in USD, 5 August 2026).
Looker, Sisense, GoodData and Reveal are the harder case. Each agrees a figure per deal, so a budget line and a paper comparison both have to wait until you have quotes in hand. Some teams shortlist on published pricing alone for exactly this reason.
Worth separating, though: not publishing a price is not the same as refusing to let you try the product. Sisense advertises a full-featured 7-day trial, though on its home page rather than its pricing page, so it can be tried hands-on before any pricing conversation. Looker, GoodData and Reveal published no trial route on their pricing or home pages when we looked on 5 August 2026. What you cannot do is budget for any of them first.
The meter matters more than the sticker
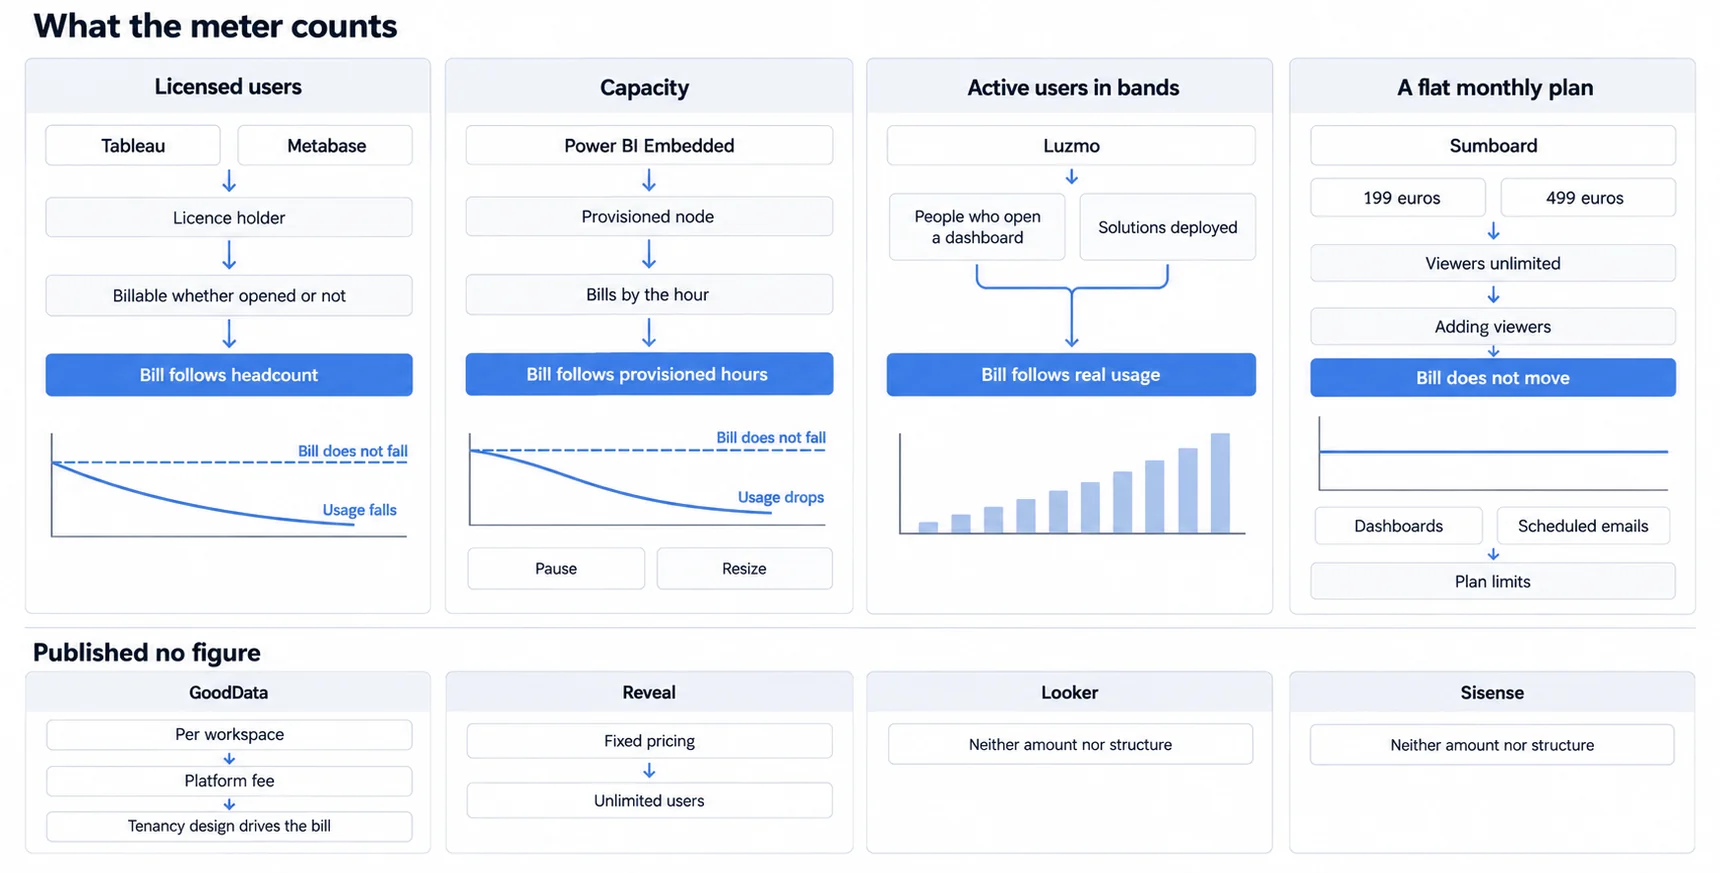
The number that decides your bill is not the headline price, it is what the meter counts.
The meters do not sort neatly into two camps, and it is worth resisting the version of this argument that says they do. Four different things are being counted across this shortlist:
- Licensed users or roles. Metabase publishes user-based paid plans. Tableau's current licensing documentation defines role-based licensing and keeps Creators and Explorers per-user under its usage- and capacity-based models.
- Capacity. Power BI Embedded bills by the hour on the node type you have provisioned, not on headcount. Note what that does and does not mean: the node accrues hours whether or not anyone is looking, so the lever is pausing or resizing it rather than usage falling away on its own.
- Active users, in bands. Luzmo counts the people who actually open the dashboards in a month, alongside the number of solutions deployed.
- A flat monthly plan. Sumboard charges €199 or €499 a month with viewers unlimited and no per-seat fees, so adding viewers does not move the bill. Dashboards and scheduled emails do carry plan limits, so check those against your roadmap rather than assuming the plan fee is the whole story.
For the four that publish no figure, an unpublished amount is not the same as an unpublished model, and two of them do describe the model. GoodData prices per workspace plus a platform fee, which for a multi-tenant product means your tenancy design drives the bill. Reveal describes fixed pricing with unlimited users and no additional cost as your customer base grows. Looker and Sisense describe neither an amount nor a structure, so both are worth asking about directly and early.
Which meter suits you depends on numbers only you have: your staff count, your customer count, how many of those are active in a month, and your peak concurrency. A team whose usage spikes for two hours each morning may do better on capacity than on anything headcount-based.
One caution about the obvious inference. It is tempting to multiply a public role rate by your customer list and call that the cost of a customer-facing deployment. Do not. Tableau documents usage-based analytical impressions and capacity-based licensing as well as roles, while other vendors use different meters or private terms. Take your own audience and workload scenarios to each vendor and get the applicable model in writing rather than trusting a comparison table, this one included.
Before comparing prices, write down what each shortlisted vendor's meter actually needs from you. Across this page that is: your licensed-user count for Tableau and Metabase, which is your own staff for an internal deployment and a question for the quote in a customer-facing one; your monthly active users and the number of separate solutions you deploy for Luzmo; the node size and hours you keep provisioned for Power BI Embedded; your metric series, log volume and active users for Grafana; how you partition tenants into workspaces for GoodData; and for Sumboard, your dashboard count and scheduled-email volume, since viewers are unlimited but those two carry plan limits. The list is not the same for any two of them, which is the point: there is no single number that compares them.
Eight Criteria Separate BI Platforms, and They Do Not All Point the Same Way
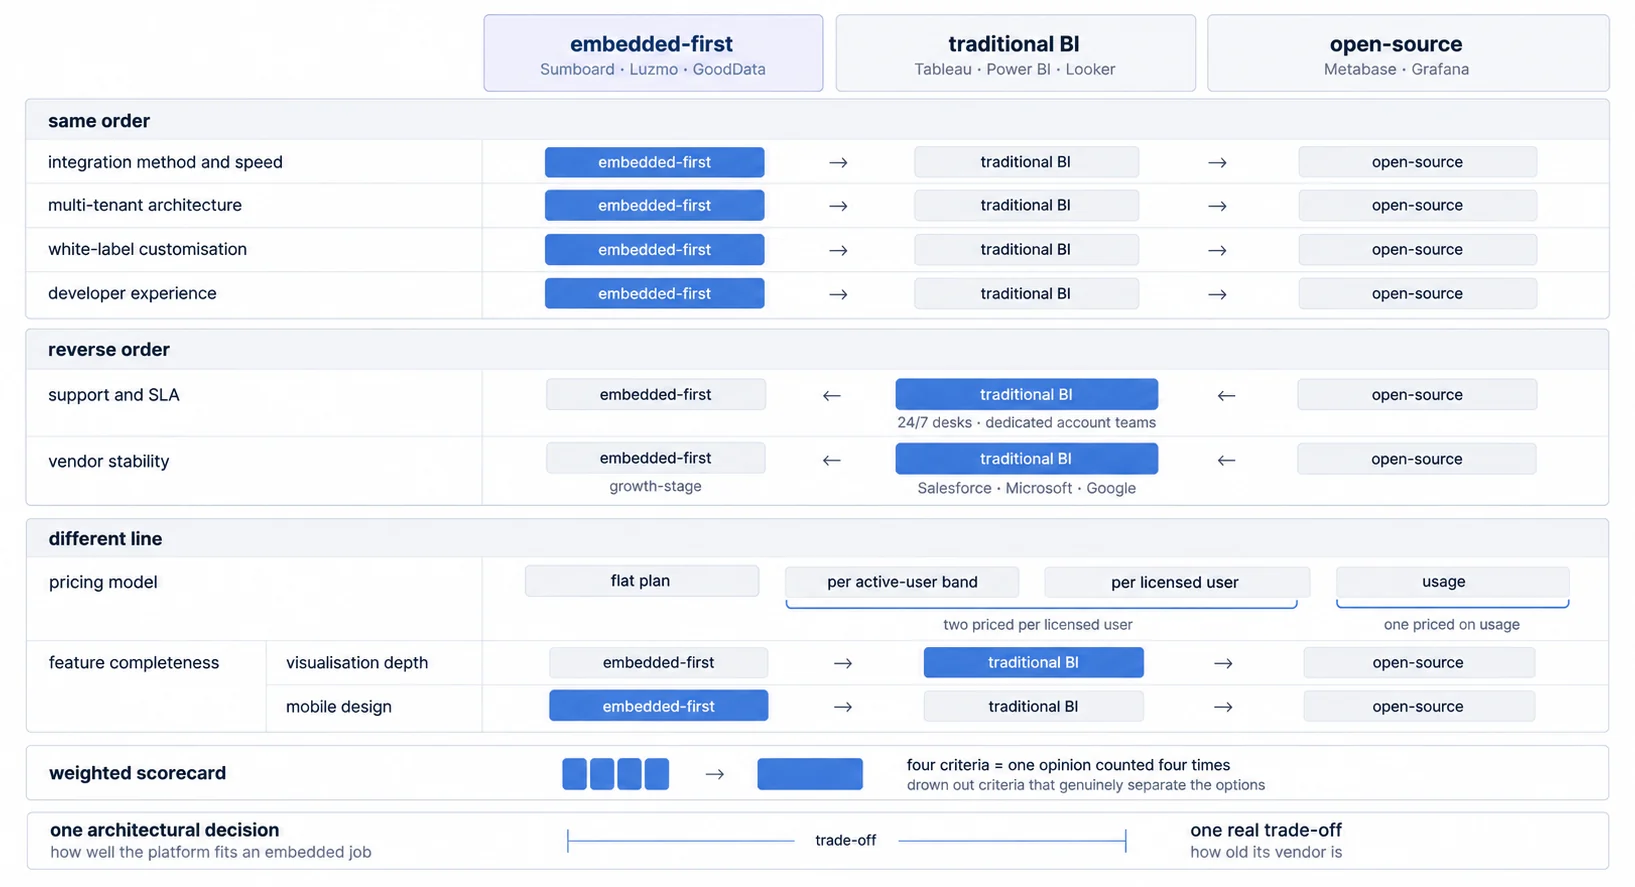
The eight criteria below are not one kind of thing. The first two describe a test you run on your own candidates; the other six sort named platforms. There is no weighting behind any of them and no total to add up, and the figure that follows checks the eight one at a time.
1. The Integration Boundary Predicts Ownership, Not a Universal Timeline
An iframe, web component, SDK, headless API, or self-managed deployment describes part of the integration boundary. It does not by itself establish rendering quality, styling control, security, accessibility, performance, or elapsed delivery time.
For every candidate, map which side owns rendering, query execution, semantic definitions, application state, identity exchange, loading and error states, exports, mobile behavior, upgrades, and incidents. Then implement the same production-shaped slice with representative data and the real release process. Record elapsed team time, vendor assistance, unresolved work, and dependencies.
The useful prediction is operational. A separate document boundary may leave more rendering behavior inside the analytics product. A headless route leaves more UI behavior inside the host product. A self-managed route adds infrastructure and recovery ownership. An SDK may expose coordination APIs while still relying on a remote rendering surface. The measured slice tells you whether that ownership split fits your team.
2. Multi-tenancy, where the difference is who owns the mistake
Row-level security (RLS) automatically filters database queries to show each customer only their data, preventing data leakage in multi-tenant SaaS applications.
Isolation can live in a database policy, semantic model, workspace boundary, dataset role, signed token, user attribute, or a combination. The question is not whether the vendor prints “RLS”; it is whether every path derives the permitted rows from a trusted identity and fails closed when context is missing or invalid.
Map the boundary for dashboard queries, caches, drill-through, exports, scheduled emails, subscriptions, support access, and administrative tools. Test a valid tenant, a different tenant, no tenant, an expired token, a modified claim, and a user whose permissions changed after issuance. Record where policy is configured, who reviews it, how it is versioned, and what audit evidence exists.
Certification, deployment topology, and logs remain important, but they answer different questions. A report describes controls in a service boundary; self-hosting changes that boundary; logs help detect and investigate events. None substitutes for a denial test in the proposed architecture.
3. White-labelling fails in the PDF footer and the error message, not on the dashboard
Full support covers logo, colours, themes, fonts and branded PDF exports, which is where we sit on Growth at €199 a month, alongside Luzmo with custom domains and CSS control, and GoodData through its headless option.
Behind a paid tier is Metabase, where white-labelling starts at Pro, $575 a month with ten users included (Metabase pricing).
Worth testing rather than believing is where Tableau Embedded and Power BI Embedded land. Both theme, and how completely vendor branding disappears depends on the embed method and the surface, exports especially. Ask in the demo rather than taking a comparison table's word for it, including this one.
Not really available is Grafana, where the open-source CSS customisation exists and is thin for anything customer-facing.
The reason to test rather than read is that the failure is never on the dashboard. It is in the PDF footer, the embed bar and the error messages, which are the surfaces that leave your product and reach people who have never seen it. The question that settles it is specific: can you remove the vendor's logo completely from an exported PDF. The white-label guide goes further into where the ceilings are.
4. Four pricing models, each a statement about what the vendor thinks drives your cost
Four models are in use, and each one is a statement about what the vendor believes drives your cost. Figures below are what the vendor publishes, checked 31 July 2026.
A flat monthly plan. Adding viewers does not change the bill; limits on dashboards and scheduled emails still apply.
- Sumboard: €199/month on Growth, €499/month on Business, viewers unlimited on both.
Priced per active user band. The bill tracks how many people actually open the dashboards.
- Luzmo: from €995/month on Starter and €2,495/month on Premium, set by the solutions you deploy and your monthly-active-user band (Luzmo pricing).
Priced per licensed user. Built for internal BI, where the people who log in are your own staff.
- Metabase: a base fee of $100/month on Starter, which includes five users and then charges $6 per additional user per month, or $575/month on Pro, which includes ten and then charges $12. Because of those included blocks, the average cost per user falls as the team grows rather than rising (Metabase pricing).
- Tableau: from $15 per user per month on Standard and $35 on Enterprise, billed annually, with at least one Creator licence required per deployment (Tableau pricing).
Priced on usage.
- Grafana Cloud has a free tier, then Pro at a $19/month platform fee plus published usage rates: $8.00 per active user, $6.50 per 1,000 metric series, and per-GB charges for logs. Enterprise starts at a $25,000 yearly commitment (Grafana pricing). On a large deployment the usage lines dominate the platform fee, so size those first.
Priced per capacity. Part of the figure is published, and it prices a machine rather than a person.
- Power BI Embedded bills by the hour on the node type you provision, and the A1-A8 table prints a monthly figure for six of the eight sizes, from $735.913 for A1 to $23,542.938 for A6, with A7 and A8 listed as N/A (rechecked on the Azure pricing page, Central US in USD, 5 August 2026). The priced part is public; what it does not tell you is which node your workload needs, and that is what the Azure pricing calculator is for.
Priced per deal. The figure is set by a quote rather than a price list.
- Looker, Sisense, GoodData and Reveal publish no figure at all.
A model is not good or bad on its own; it is a bet about what drives your cost. Which one is cheapest at any given size depends on details these headline figures do not settle: included-user blocks, usage charges, plan fit and currency. Work it for your own headcount rather than taking a ranking. What a per-licensed-user model does in a customer-facing deployment depends entirely on whether your end customers need licences, and that is a question only the vendor's embedded quote answers. None of the platforms here publishes a per-embedded-viewer rate, so treat any comparison that models your customers as licensed users, including one you make yourself, as a hypothesis to confirm in writing.
How much each vendor tells you before you call (prices rechecked in a browser, 4 August 2026):
- A price and the model behind it: Sumboard, Luzmo, Metabase, Grafana, Tableau
- A price, but for a machine rather than a seat: Power BI Embedded, which prints a monthly figure per node and leaves the sizing to you through the Azure pricing calculator
- A documented model with no rate attached: Domo publishes which actions consume credits, but not what a credit costs, so you can predict the shape of the bill and not its size
- Neither a price nor a published rate: Looker, Sisense, GoodData, Reveal. Looker is the strictest of these: Standard, Enterprise and the Embed platform all read "Call sales", so no platform, base or per-viewer figure is published, so there is no base figure and no per-viewer rate to work from
The Price Assumes You Are Allowed to Show It, and Only Some Vendors Publish That Separately
Criterion 4 compares what the meter counts. It sits on top of an earlier question the price list does not answer: whether the licence permits people who are not your employees to open the dashboard at all, and whether those people become billable accounts when they do.
Four of the vendors compared here answer that in public documentation, and our own pricing page answers it for us. The five answers are not the same shape.
| Platform | What the documentation says about viewers outside your organization | Source |
|---|---|---|
| Power BI | Two embedding solutions exist. Under embed for your customers, "App users don't need a license"; under embed for your organization, "Each app user needs a Power BI license". The customer route is the one associated with the Azure A SKUs, and "To embed in a production environment, you must use a capacity." | Power BI embedded analytics overview |
| Tableau | A separate usage-based model exists for this audience: "An analytical impression is generated when a Usage Viewer (who must be a viewer outside your organization) accesses one or more embedded analytics." That model "imposes no constraints on the number of Viewer user accounts", and "Embedded Analytics licenses cannot be used in the same environment as full-use licenses." | Understanding License Models |
| Metabase | The embedding type decides it. Under SSO embedding, "Accounts for these embedded users in your Metabase count toward the accounts billed in your Metabase plan." Guest embedding sits outside that: "Guest embedding works on all Metabase plans, including OSS and Starter." | Embedding introduction |
| Grafana | The open-source edition is licensed under the GNU Affero General Public License version 3, whose Section 13 requires a modified version offered to users "remotely through a computer network" to also offer those users the corresponding source. | grafana/grafana LICENSE |
| Sumboard | Viewers are unlimited on both published plans, so the number of customers looking at a dashboard changes neither the licence nor the bill. | Sumboard pricing |
We did not open the licence terms for Luzmo, Looker, Sisense, GoodData or Reveal, so those rows are unchecked rather than absent. Four of those five price by quote, which is where the written answer would arrive in any case.
Read the four vendor answers together and the pattern is that permission is priced apart from the product. Power BI routes it to a different SKU, Tableau to a licence that cannot share an environment with the full-use one, Metabase to a different embedding type, and Grafana, if you modify it, to a source obligation rather than a fee.
That is why a price comparison on its own, including the one earlier on this page, can put two figures side by side that are not buying the same right. Ask each vendor in writing which licence class covers customer viewing, then compare the figures that answer carries.
5. Developer experience, where the real question is whether the skill transfers
Modern SDK and documentation covers our React, Vue and Angular SDKs with TypeScript support, Luzmo's JavaScript SDK with a REST API and Postman collection, and GoodData's API-first React SDK.
A language to learn first covers the enterprise three. Looker needs LookML, a proprietary language for its semantic layer; the learning time depends on the team's modelling experience and the complexity of the project. Power BI needs DAX, which resembles Excel formulas and is not SQL, plus the App Owns Data auth pattern. Tableau uses calculated fields through a visual formula builder, with less API control than the others.
Standard SQL is the third group: ours, Metabase with a visual builder alongside it, and GoodData where MAQL is optional rather than required.
The distinction that matters is not difficulty, since a competent team can learn any of these. It is whether the knowledge travels. SQL your team already has applies immediately and applies again at the next vendor. LookML, DAX and MAQL apply to exactly one product, so the investment is both a cost and a switching cost, and the second one is the part that shows up years later when a migration turns out to mean rewriting hundreds of queries rather than repointing them.
6. Feature completeness, where the ordering starts to reverse
Every platform here draws the standard chart types. Beyond that the picture changes, and it does not change in one direction: the enterprise platforms lead on depth, we and the other embedded-first products lead on mobile, and the open-source projects trail on both.
On visualisation depth, Tableau's library is the most extensive in the category and Looker supports custom visualisations through JavaScript; we support custom charts and are not claiming parity with either. On export and scheduling we cover PDF, Excel and CSV with scheduled email, as do Tableau and Power BI, while Metabase offers basic exports and Grafana produces PNG snapshots. On interactivity, filters, drill-downs and cross-filtering are strong in our product and in Tableau, workable in Power BI and Looker though constrained by iframe embedding, and limited in Metabase's embedded mode. On mobile, we are designed mobile-first along with Luzmo and GoodData, while Tableau and Power BI are responsive on a desktop-first design.
7. Support, where the enterprise platforms lead outright
We offer priority support on Business and dedicated support on Enterprise, and for uptime commitments the honest answer is to ask us for current terms in writing rather than read a number here. Looker, Tableau and Power BI offer 24/7 support with dedicated account teams on enterprise plans, and GoodData includes enterprise support.
That is a genuine advantage for the large vendors and it is worth saying plainly. What open source offers instead is a community: Metabase has an active Discourse forum, GitHub issues and Slack, and Grafana has one of the larger open-source communities with documentation to match. Community support is excellent for common problems and unavailable at 3am on the problem only you have.
8. Vendor stability, where the ordering reverses completely
Established players. Tableau is Salesforce-owned, acquired in 2019 for $15.7B. Power BI is Microsoft's, with the Azure ecosystem behind it. Looker is Google Cloud's, acquired in 2019 for $2.6B.
Growth-stage vendors. We are a European SaaS business, profitable and customer-funded. Luzmo is Belgian, Series A, strong in Europe. GoodData has been publicly traded since 2021.
Open-source projects. Metabase is a commercial open-source company, and its pricing page lists a free Open Source edition you can self-host next to the paid plans, which is the part that matters if you want an exit route that does not depend on the vendor (Metabase pricing, checked 7 August 2026). Grafana Labs is independent, and its August 2024 Series D extension was a roughly $270M transaction at a valuation above $6 billion, alongside a stated $250M+ in annual recurring revenue (Grafana Labs announcement).
On this criterion the three enterprise platforms win and it is not close, because a platform owned by Salesforce, Microsoft or Google is not going to disappear. That is a real form of risk reduction and a fair reason to choose one.
What the eight criteria actually tell you
Read the eight together and the useful pattern is not a winner. It is that six of them sort the three groups in two opposite directions, while the other two separate the platforms on a line of their own.
Four of them favour platforms built for embedding, and they favour the same three in the same order every time: integration, multi-tenancy, white-labelling and developer experience. Two run the other way and favour the large enterprise platforms, namely support and vendor stability, for reasons that are structural rather than accidental: a 24/7 support organisation and an owner with a market capitalisation are things you cannot ship your way to.
The other two cut across the groups rather than sorting them, and both are worth reading on their own terms. Pricing model does because the four billing meters in use do not line up with the three groups at all. Feature completeness does because the answer changes with the sub-question: visualisation depth goes to the enterprise platforms, mobile design goes to the embedded-first ones, and the open-source projects trail on both.
So the eight criteria are not a scorecard to total up. They are two different questions about risk, plus two that belong to neither. If your risk is shipping late or being locked into a language, the four that favour embedding decide it.
If your risk is an outage at 3am or a vendor that is not there in five years, support and stability decide it, and the enterprise platforms are the right answer. Pricing model and feature completeness are read per candidate, because neither one splits along that line.
Most teams find that one of those two risks is real for them and the other is theoretical, and the honest version of this comparison is that recognising which is the whole decision.
Three categories, and each one enters the shortlist for a different reason
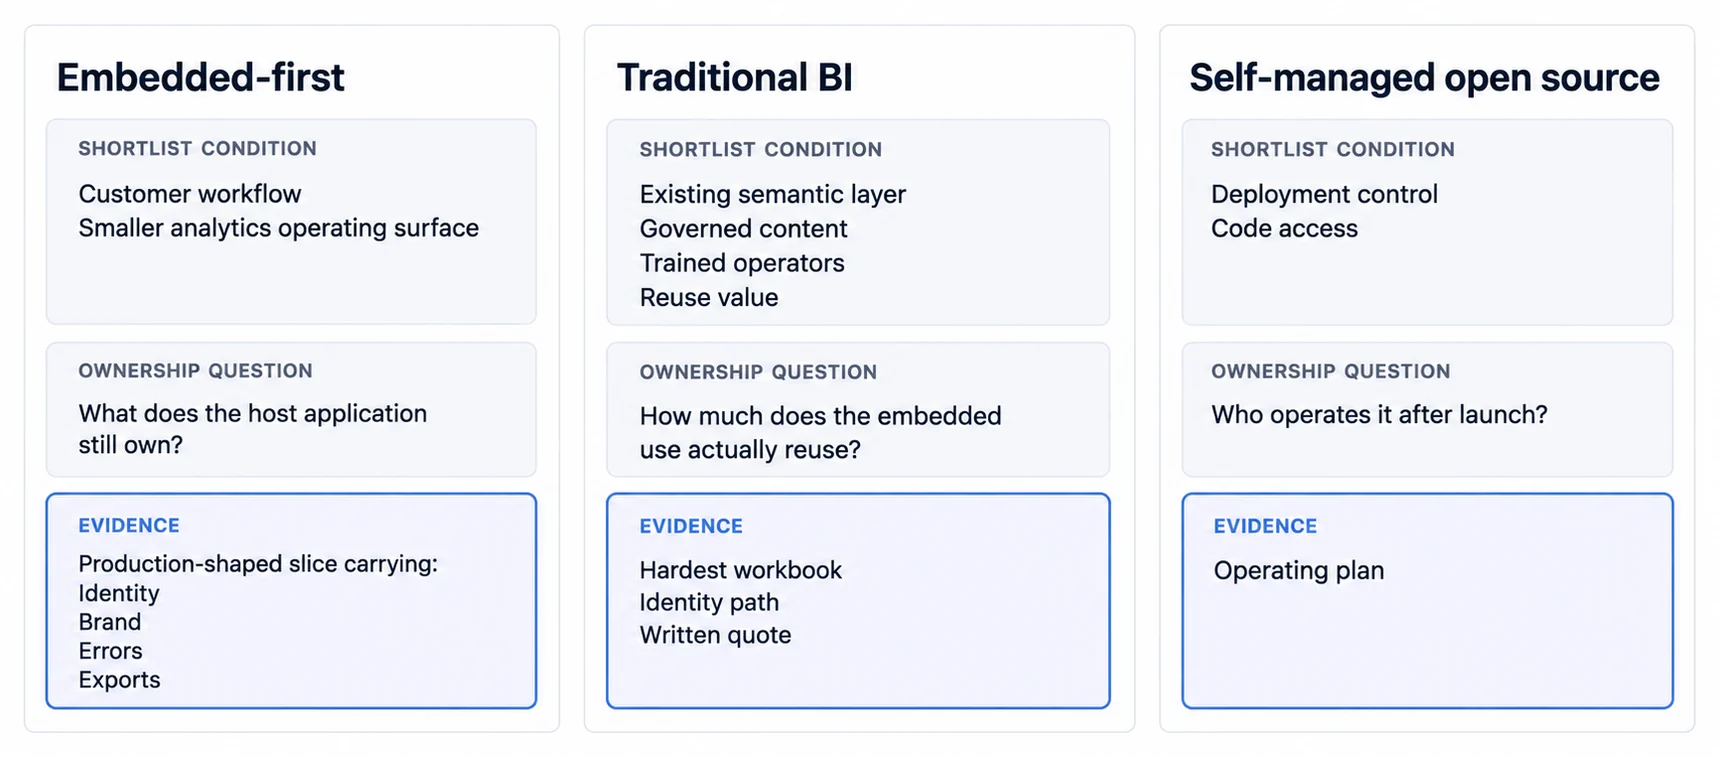
The section above ends with two groups of criteria pulling in opposite directions. Here is what that means in practice for each category, including where each one is the wrong answer.
Embedded-first platforms fit when the viewers are your customers: Sumboard, Luzmo, GoodData
These fit when the analytics face customers rather than staff, when speed to market is measured in days rather than months, when the viewer count runs from dozens into the thousands so a flat rate beats a per-seat one, and when the experience has to carry your brand rather than somebody else's.
They are the wrong answer in three specific cases, and it is worth being direct about all three. For internal-only analytics they are overkill and traditional BI does the job. For genuinely advanced data modelling, Looker's semantic layer wins and we are not going to pretend otherwise. And if your organisation is already deep inside Microsoft or Google, the ecosystem lock-in has been accepted already, which changes the arithmetic in favour of the platform you are locked into.
What we bring specifically: integration measured in minutes with deployment in days, and unlimited viewers, so your customer growth does not appear on the invoice. On data residency, GDPR and deployment options, ask us in writing. We would rather you had the current answer from us than an inference drawn from a comparison page.
Cashpad, a restaurant POS SaaS, runs our embedded analytics inside the BackOffice its customers already use, which is the shape this category is for.
Traditional BI fits when the viewers are your own staff: Tableau, Power BI, Looker
These fit for internal reporting, which is what they were built for, for large enterprises with a real BI function, for organisations already paying for Microsoft 365, Azure or Google Cloud, and for anyone who genuinely needs a semantic layer that a data team will live in.
They are the wrong answer for customer-facing embedding, which requires workarounds rather than configuration; for startups and scale-ups without the engineering capacity to absorb a months-long implementation; and for anyone who needs to budget before a sales conversation, since Looker publishes nothing at all.
Each has a distinct strength worth naming rather than blurring. Looker's LookML lets you define a metric once and reuse it everywhere, with BigQuery-native performance and enterprise-grade governance, which is a real capability and the reason it is the right answer for the profile above. Power BI bills capacity by the hour on the node you deploy and can be paused, so a workload that is only busy in office hours does not have to be paid for overnight, and the Excel, Azure and Teams integration is smooth in a way nobody else can match. Tableau's visualisation library is the deepest in the category, its desktop application supports serious local analysis before anything is published, and its community and training material are the largest available.
Open source fits when you have DevOps time to spend instead of budget: Metabase, Grafana
These fit teams with real DevOps capacity, organisations that want complete control of the code, and businesses with a hard budget constraint, as long as the constraint is on spend rather than on engineering time.
They are the wrong answer without DevOps capacity, since self-hosting is the job rather than a side effect; where enterprise support is required, because community support is excellent for common problems and unavailable on the problem only you have; and for customer-facing use, where white-label support is limited.
Metabase's advantages are a visual query builder that non-technical users can operate, a Docker image running in minutes, and no vendor lock-in. Grafana's are time-series data handling built for metrics, logs and traces, integrations with well over a hundred sources including Prometheus and InfluxDB, and alerting built into the product rather than bolted on.
Conclusion: Choose Speed, Not Complexity
The landscape is crowded, and the tidy version of this conclusion, that internal BI is expensive and embedded-first is cheap, does not survive contact with the actual price lists. What is true is narrower and more useful:
On price, ask three questions in this order.
- Does the vendor publish a figure, and if not, can you still size it? Five publish one: Sumboard, Luzmo, Metabase, Grafana and Tableau. Power BI Embedded publishes none but bills by capacity hour, so the Azure calculator lets you size it alone. Looker, Sisense, GoodData and Reveal agree a figure per deal, so budgeting those starts with a conversation.
- What is the meter? Tableau and Metabase count licensed users. Power BI Embedded counts capacity node hours. Luzmo counts solutions and monthly active users. Domo counts credits consumed by data and pipeline activity. Sumboard charges a flat monthly plan with viewers unlimited. These behave very differently as you grow, and none of them is simply "per customer".
- For anything quoted, what does the meter do in year three? Ask for the renewal uplift in writing. Whether an embedded deployment is billed per viewer at all is something only the quote will tell you; no vendor here publishes an embedded per-viewer rate.
On everything else, what genuinely separates the two families:
- Multi-tenant isolation is a platform feature in embedded-first tools, and a per-workbook or per-model configuration in tools built for internal reporting
- White-labelling is assumed in one family and a tier or a workaround in the other; the export is the test that tells them apart
- Platforms with their own modelling language hold your metric definitions in a form that does not travel, which is the part of leaving that people underestimate
Five of the ten platforms in the table above publish no price, and four of those five will only discuss it on a call. Before a demo, decide what you would need to hear to say no, then ask for it in writing: the meter, the renewal uplift, and what leaving looks like.
Shortlist by the constraint that outlives the first dashboards, not by company size
Company size alone does not determine the right architecture. Start with the constraint that will remain true after the first dashboards ship:
| Operating context | Shortlist to evaluate | Reason to include it | Counter-check |
|---|---|---|---|
| A product team needs customer-facing analytics, unlimited viewers, and a public fixed subscription | Sumboard embedded analytics | Embedded-first integration, tenant-aware delivery, and published Growth and Business prices | Confirm the required dashboards, data path, support level, and plan allowance in a trial |
| The team accepts operational ownership in exchange for open-source control | Metabase or Grafana | Source access and self-hosting can fit an existing platform team | Price hosting, upgrades, monitoring, embedding features, and incident ownership |
| The organization already standardizes on Microsoft data and identity services | Power BI Embedded | Capacity billing and the Azure ecosystem may align with existing operations | Model capacity hours and test the App Owns Data authentication path |
| A governed semantic layer and broad enterprise BI program are primary requirements | Looker or GoodData | Modelling, governance, and enterprise administration are central to the product | Obtain the embedded quote, time the modelling workflow, and document migration cost |
| A purpose-built embedded shortlist needs another active-user pricing model | Luzmo | Embedded delivery and white-labelling are part of the product offer | Forecast monthly active users and solution limits over three years |
Where to Go Next, by What You Have Already Decided
Implementation guides
- White-Label Analytics Setup Tutorial
- What is Embedded Analytics, foundational overview before evaluating platforms
- Build vs Buy Embedded Analytics, framework for the make-or-buy decision
- Embedded Analytics Pricing Models, understanding cost structures
- Embedded Analytics Security, what to evaluate in vendor security
- Multi-Tenant Analytics Architecture, how tenant isolation works under the hood
- Open-Source BI Tools Guide, deep dive on Metabase, Grafana and alternatives
Platform comparisons
- Looker Alternative, top Looker alternatives for embedded analytics
- Looker vs Metabase, head-to-head comparison
- Sisense Alternative, proving the replacement before you migrate
- Sisense vs Looker, which wins for embedded use cases
- Tableau vs Power BI, the classic BI showdown
- Power BI Embedded Alternative, where Azure cost and integration work show up
- Power BI Embedded vs Looker Embedded, the two enterprise routes side by side
- Qlik Alternative, testing the deployment route before comparing replacements
Ready to launch customer-facing analytics?
Stop losing customers to competitors with better analytics. Sumboard's customer-facing analytics platform lets you launch self-service dashboards in days, not months.