
Marketing analytics inside your product.
Client results under the agency's own brand.
Experience Sumboard
Builder view and customer view.
Switch between the workspace where your team builds and the branded dashboard your customer sees.
- 01Create data insights
- 02Customize with your brand
- 03Embed in your app
What goes wrong in Marketing dashboards.
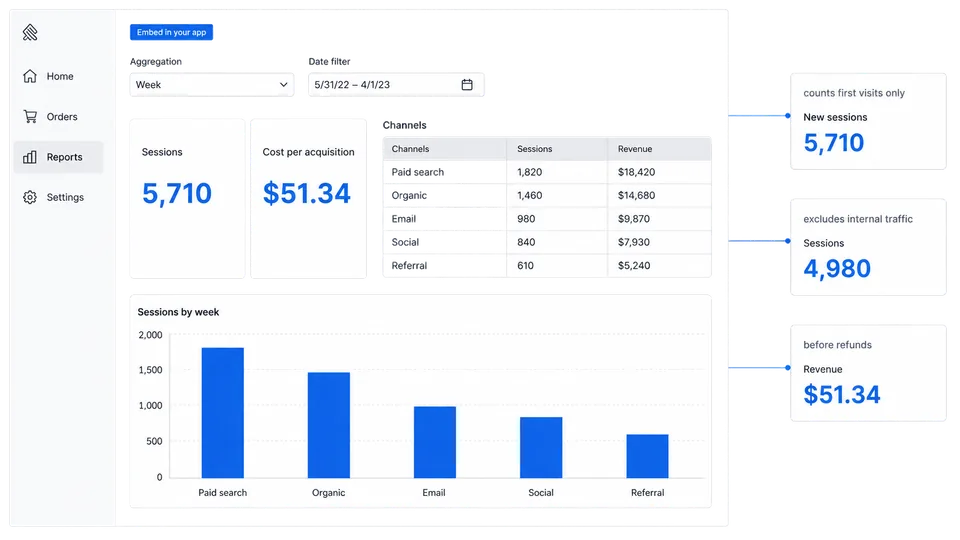
The people reading these numbers are measured by them, so each metric is shown with its counting rule.
The people reading these numbers are measured by them. A metric label without its counting rule lets each team assume a different definition.
Permission resolution at query time.
An agency sees its own clients, and each client sees only itself and usually does not know the agency's other clients exist. White-label is a requirement here: the wrong logo on an export is a commercial problem.
One metric definition, shared across teams.
Sessions
Visits in a period, with the dashboard stating whether internal and bot traffic are excluded. Tools count sessions differently.
Cost per acquisition
Spend divided by conversions for a stated window. Conversion windows differ per platform, so a blended figure states its window.
Return on ad spend
Attributed revenue against spend. The attribution model is stated with the figure; two models on the same data give different results.
Attributed conversions
Conversions assigned to a channel by a stated model. Last-click and data-driven models give different counts, so the model is named.
Three failure modes in production.
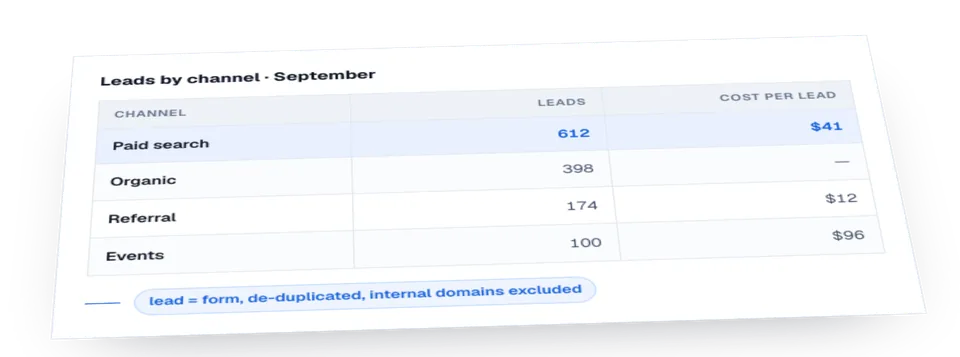
Metric names without their definitions
A card that says 'Conversions: 1,284' and nothing else leaves the definition to the reader.
A vendor's brand on a client-facing report
A report with a vendor logo on it shows the agency's client who the supplier is. Branded exports and sender domains are the requirement.
Blended totals with silent gaps
When one platform's data has not landed, a blended total reads low. Per-source freshness makes the gap visible.
How fresh the numbers need to be.
Campaign data arrives from several platforms on different schedules and some of it restates for days after the fact. The dashboard shows when each source last landed; a blended number is as fresh as its slowest input.
Further reading for Marketing engineering teams.
Marketing Dashboards: Named by Purpose or by Source
Marketing dashboards get named after their purpose or their source, and the two cuts overlap. Attribution, the metrics that survive, and what changes when the dashboard faces a MarTech customer.
Customer-Facing Marketing Analytics: From Sources to Decisions
Build marketing dashboards from reconciled source data, explicit attribution and currency rules, tenant scope, freshness, and a decision-led customer task.
Campaign Performance Tracking: What Works (And What Doesn't)
Most campaign dashboards show you data. The best ones show you what to do next.
White Label Analytics for Agencies: Beyond Marketing Reports
Agencies are discovering white label analytics opens doors beyond campaign reporting, from embedded product analytics to new revenue streams.
Frequently asked questions.
Can each client see only their own data?
Yes, and they do not see that other clients exist. Scope is resolved in the query, not in the interface.
Will our clients see your name anywhere?
No. The dashboard, the scheduled emails, the PDF and the spreadsheet export all carry your brand and your sending domain.
Can we show what a metric counts inside the dashboard?
Yes. Definitions are part of the model and are shown with the number.
Can clients schedule their own reports?
Yes. They set the frequency, the format and the filters themselves.