
HR analytics inside your product.
Workforce numbers, per customer, inside your product.
Experience Sumboard
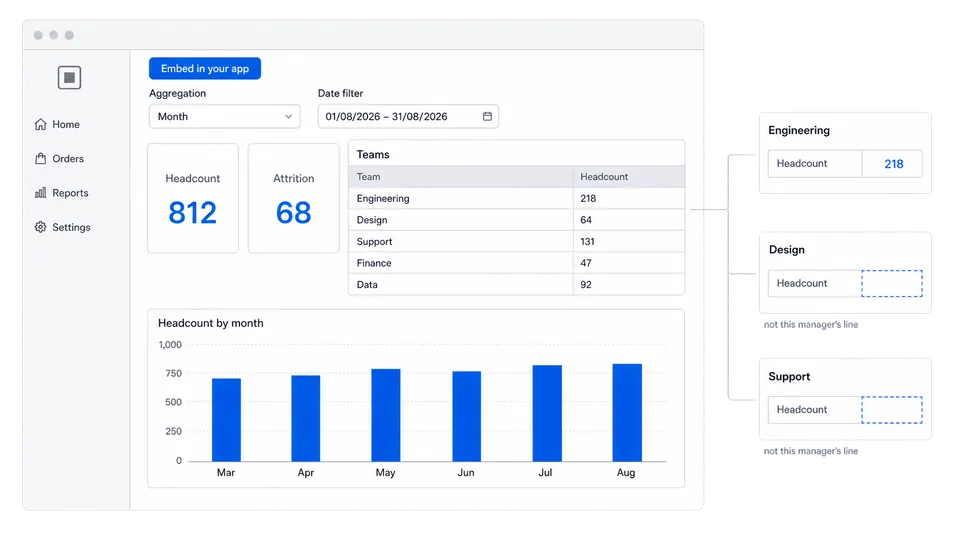
Builder view and customer view.
Switch between the workspace where your team builds and the branded dashboard your customer sees.
- 01Create data insights
- 02Customize with your brand
- 03Embed in your app
What goes wrong in HR dashboards.
People data is the most access-controlled data a product holds. A manager may see their own team and nobody else's, and that rule changes as the org chart changes.
Entitlement is a function of the reporting line, and the reporting line changes without a deploy. A dashboard that resolves visibility from a static role list rather than from the current org chart keeps returning rows after a transfer.
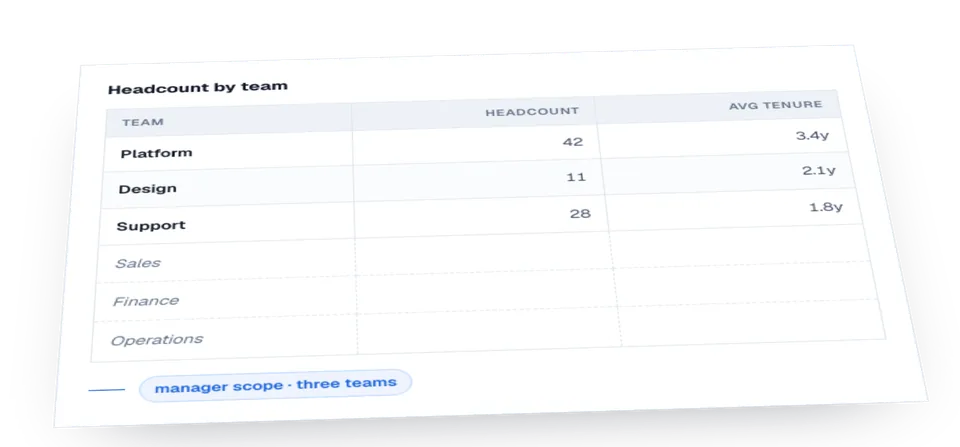
Permission resolution at query time.
A manager sees their own reporting line and nobody else's, and the line that defines it moves every time somebody transfers, goes on leave or changes manager. The rule is not a list of user IDs; it is a query against the org chart as it stood on the date being asked about.
One metric definition, shared across teams.
Headcount
Active employees on a stated date. The dashboard states whether contractors and people on unpaid leave are included.
Attrition
Leavers in a period divided by average headcount in the same period. Voluntary and involuntary exits are reported separately.
Time to fill
Days from requisition approved to offer accepted. Open requisitions are excluded and the exclusion is stated.
Span of control
Direct reports per manager, read from the same org chart the permissions come from. Both are read from the same source.
Three failure modes in production.
Permissions modelled as a filter
Applying the manager filter after the query has returned every row leaves the underlying rows exposed in exports and shared links.
The org chart is treated as static
Resolving 'my team' against today's chart restates last quarter's numbers after every reorganisation.
Small groups shown without a floor
Attrition for a team of three identifies a person. Values below a minimum group size are suppressed.
How fresh the numbers need to be.
Workforce numbers are read weekly and reviewed monthly, so the as-of date matters more than same-day freshness. Every headcount figure carries the date it describes.
The platform.
Tenant isolation, white-label theming, exports and scheduled reports.
Frequently asked questions.
Can a manager see their skip-level reports?
Yes, if your org chart says so. The scope is what your hierarchy query returns; 'direct reports only' and 'the whole reporting line' are both expressible in one dashboard.
How do you handle a manager who moves mid-quarter?
The token carries who is asking; the query decides what that meant on the date in question. A move changes what they see next time they open it, with no re-provisioning step.
Can we hide numbers for teams below a certain size?
Yes. Your query applies a minimum group size, so suppressed rows are not returned.
Do employees see their own record?
That is your scoping decision, using the same token mechanism as the manager rule. Employee-level views and manager roll-ups can run off one dashboard definition.