
April 27, 2026•8 min read
Store Performance Metrics: From Comparable Scope to Action
Define comparable store metrics, reconcile their data, isolate operational drivers, and connect every signal to an owner and review decision.
Topic
A KPI dashboard is useful only when its measures match the operating question. This cluster groups practical examples by team and use case, including finance, healthcare, retail, manufacturing, logistics, marketing, and supply chain. Each article starts with the decisions the dashboard must support, then works backward to the metrics and views that make those decisions possible.
Define comparable store metrics, reconcile their data, isolate operational drivers, and connect every signal to an owner and review decision.
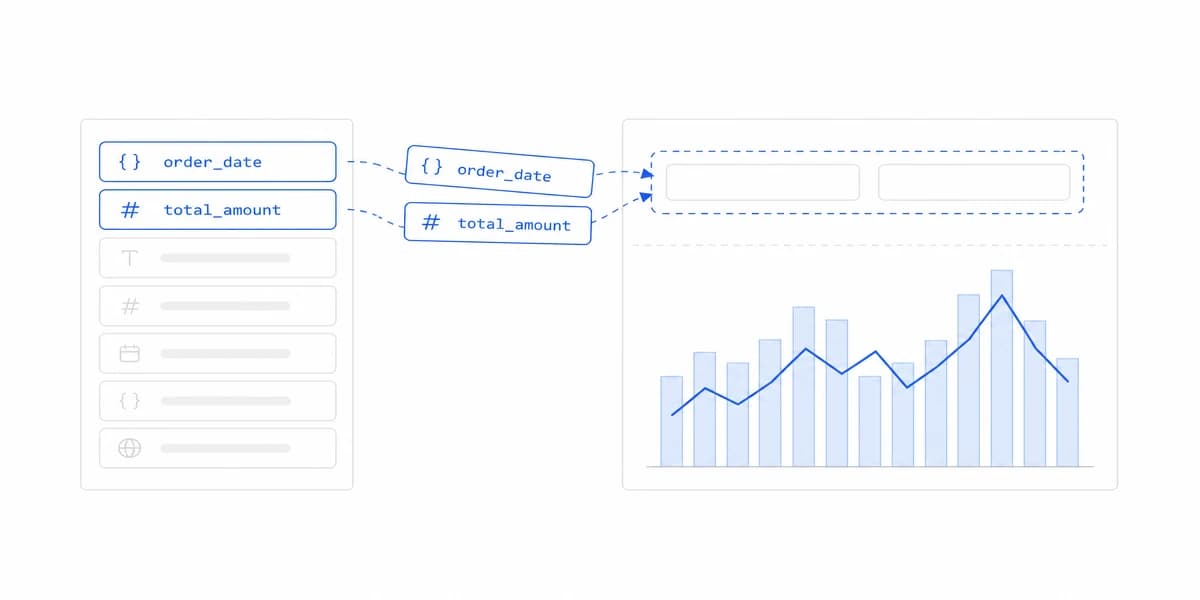
Design retail dashboards around reconciled sales, accepted inventory movements, store-local time, customer scope, and the decision window.
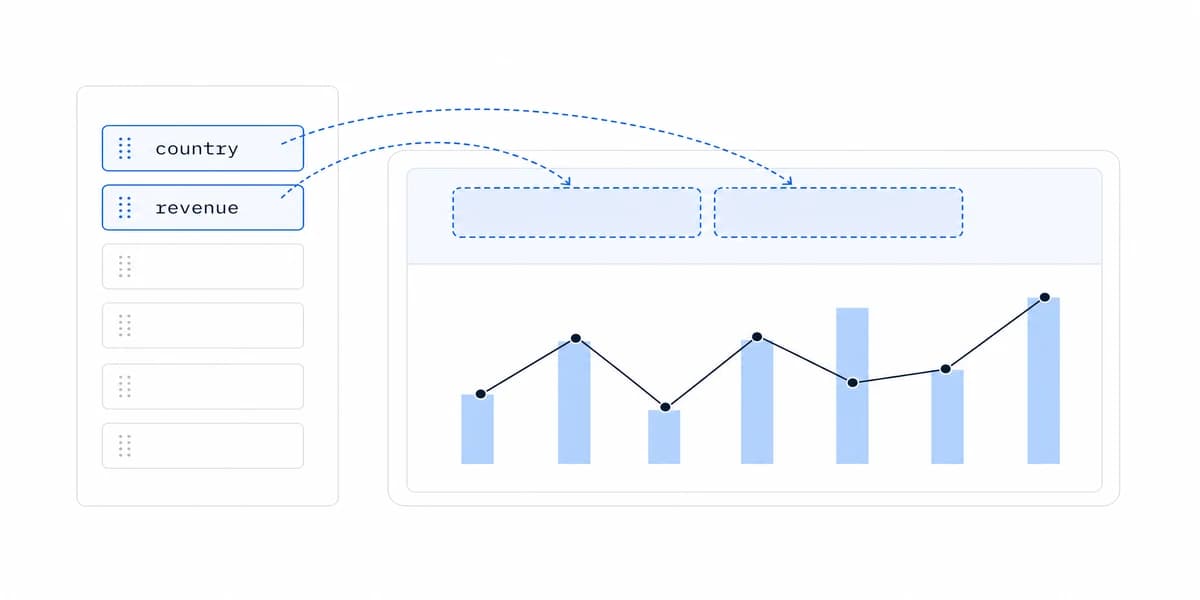
Build marketing dashboards from reconciled source data, explicit attribution and currency rules, tenant scope, freshness, and a decision-led customer task.
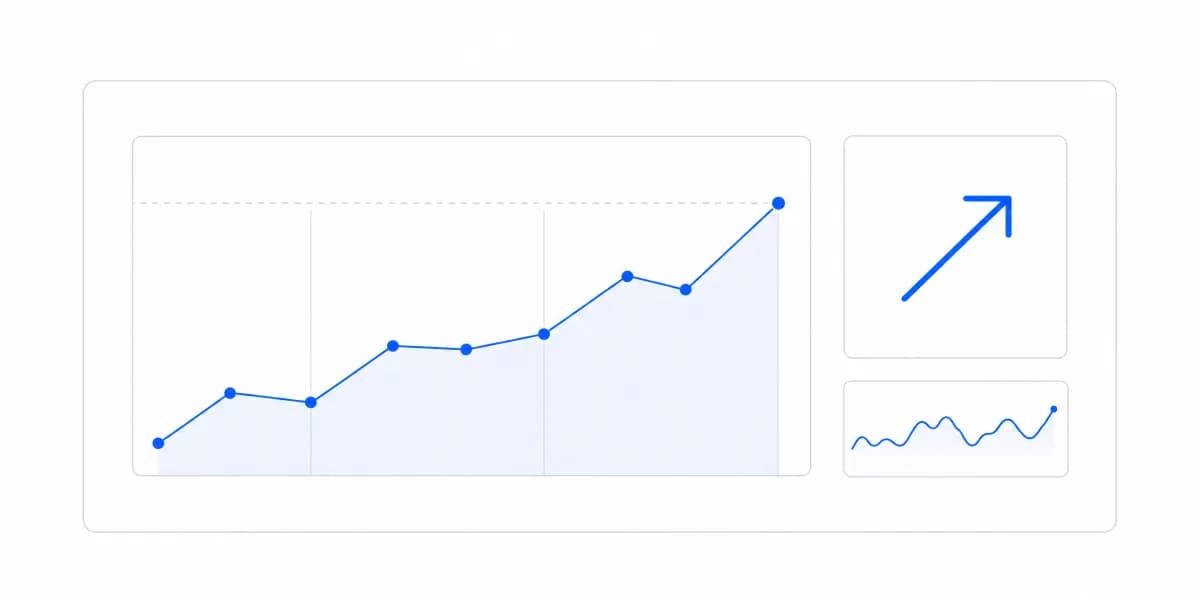
Build logistics dashboards from governed shipment milestones, explicit SLA clocks, correction-aware metrics, and an owned exception response.
Build supply-chain dashboards from governed order, shipment, inventory, supplier, and cost contracts instead of borrowed thresholds.
Most campaign dashboards show you data. The best ones show you what to do next.
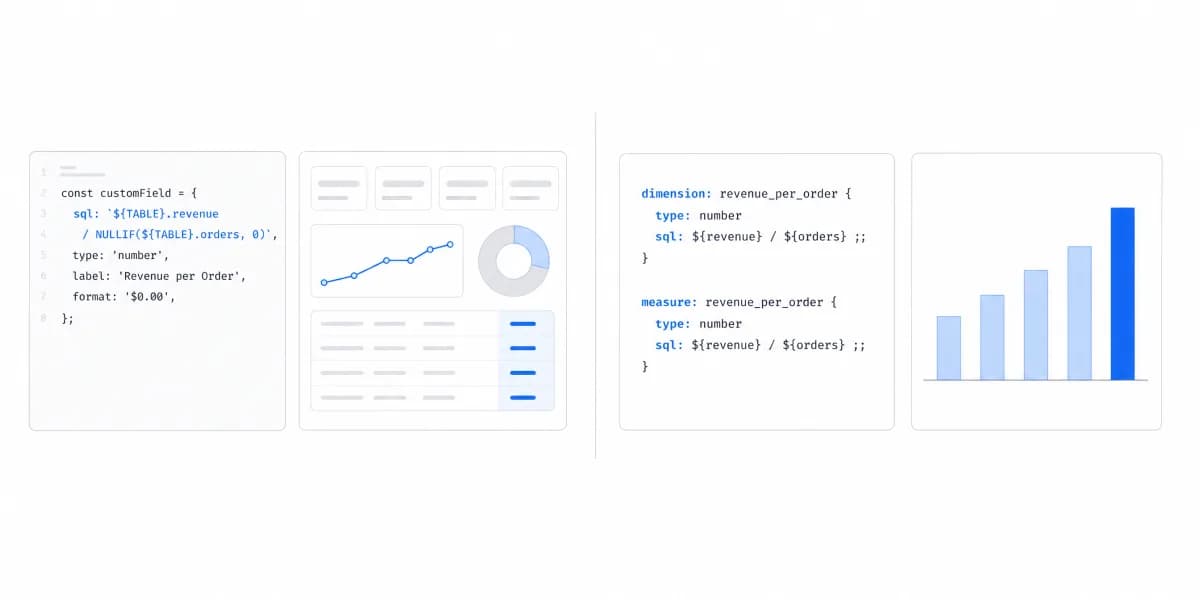
Build a revenue dashboard that separates subscription metrics, recognized revenue, and cash, then reconciles each number to its source and policy.
Define patient metrics, authorization, provenance, presentation, and release evidence before embedding a healthcare dashboard.
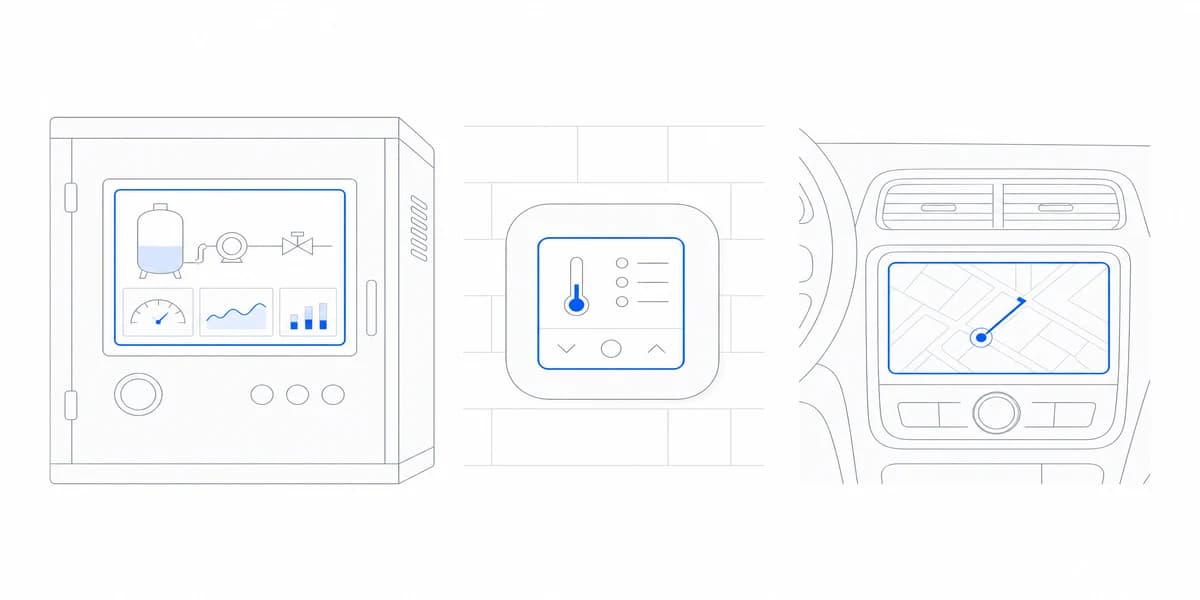
Define manufacturing metrics from eligible events, reconcile their sources, apply tenant and role scope, and connect every signal to an owner.
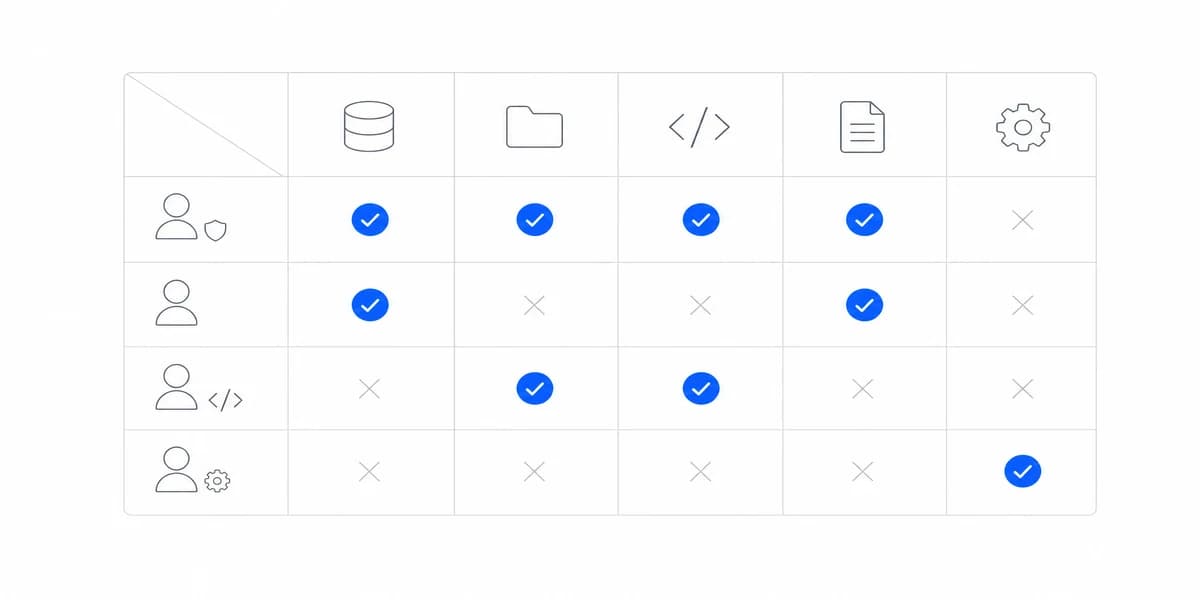
Turn healthcare KPI labels into versioned measure contracts with defined populations, sources, adjustment, authorization, and permitted decisions.
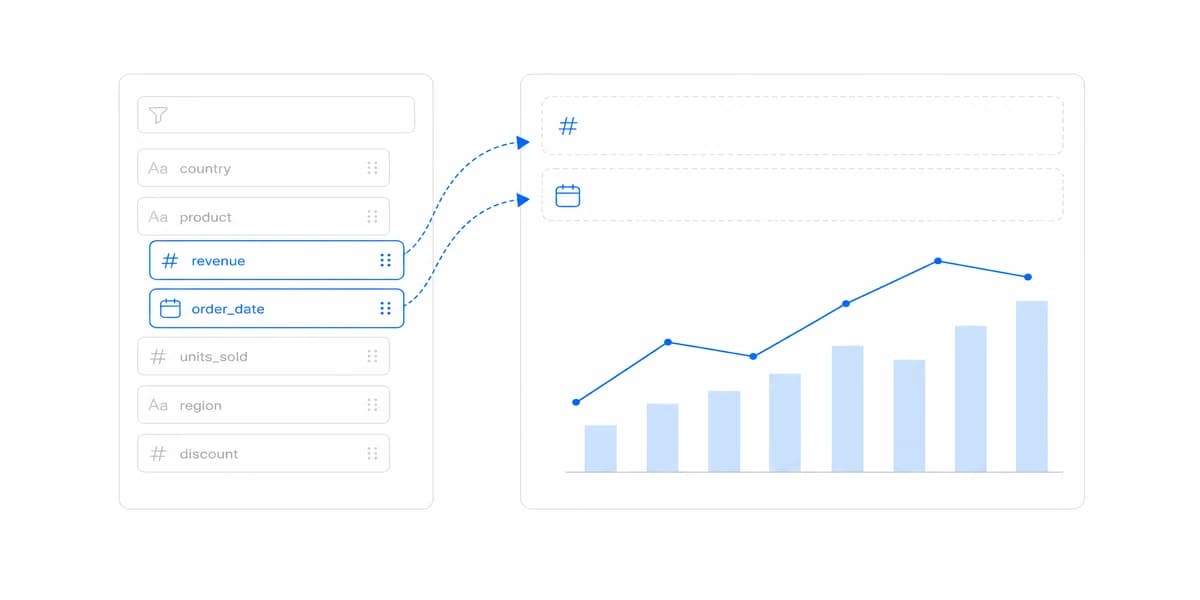
Design customer-facing financial metrics across subscription activity, accounting policy, cash timing, tenant scope, close, and reconciliation.
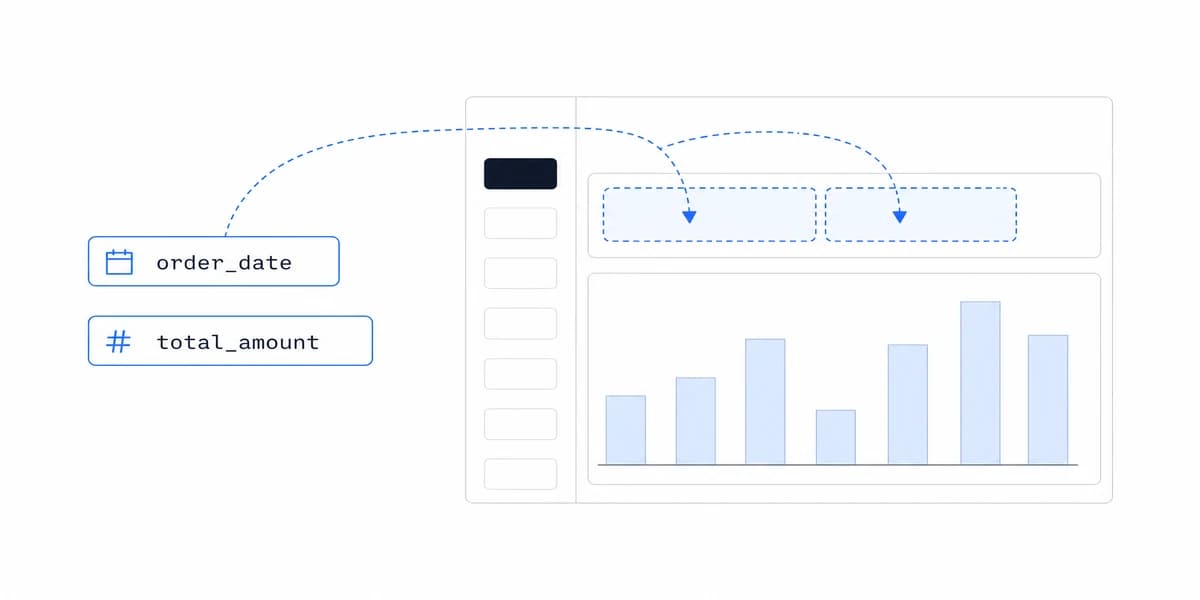
Use sales, marketing, customer, finance, and product KPI examples as operating contracts with definitions, references, owners, and actions.
Design executive dashboards around strategic decisions, metric definitions, references, ownership, actions, responsive tasks, and evidence, not arbitrary KPI counts.

Build powerful supply chain dashboards with real-time visibility into logistics, inventory, and operations. Track KPIs, optimize costs, and improve delivery performance.

Retail KPIs fall into four groups, and a tile earns its place only by driving an action. Sales, inventory and customer analytics, for retailers and for the SaaS products serving them.

Marketing dashboards get named after their purpose or their source, and the two cuts overlap. Attribution, the metrics that survive, and what changes when the dashboard faces a MarTech customer.

A plant already has the data; it arrives too late and in four shapes. OEE and the KPIs worth a tile, and why the business case is not faster reporting.

Healthcare dashboards pull from sources that disagree about who a patient is and when something happened. The six components that recur, where the connectors carry the compliance risk, and what HIPAA changes.

A financial dashboard is the summary; the accounting system keeps the ledger. Which finance metrics earn a tile, and why a reader with nobody to ask changes the architecture for FinTech products.