Healthcare technology companies face mounting pressure to deliver sophisticated analytics while maintaining HIPAA compliance and managing limited engineering resources. The gap between what customers expect and what organizations can realistically build in-house has never been wider.
Healthcare dashboards bridge this divide by transforming complex clinical, operational, and financial data into actionable insights. Whether you're building telemedicine platforms, EHR systems, or remote patient monitoring solutions, the right analytics approach can mean the difference between losing deals to competitors and becoming the preferred choice in your market.
This guide explores how healthcare SaaS companies can deliver professional analytics to their customers through purpose-built embedded analytics, without derailing their core product roadmap or spending 6-12 months on custom development. On compliance, verify each vendor's current certifications directly, ours included, and ask for the auditor's report rather than accepting a claim on a marketing page.
Live demo: Interactive healthcare dashboard built with Sumboard, explore patient encounters, revenue cycle, claim denials, and provider productivity analytics.
A Healthcare Dashboard Consolidates Sources That Disagree About Identity and Time
A specialized analytics tool that consolidates data from multiple healthcare sources, electronic health records (EHR), billing systems, lab results, patient monitoring devices, into unified visual interfaces designed for clinical, operational, and administrative decision-making.
A healthcare dashboard is a specialized analytics tool that consolidates data from multiple healthcare sources, electronic health records (EHR), billing systems, lab results, patient monitoring devices, into unified visual interfaces. Unlike generic business intelligence tools, healthcare dashboards must work through strict regulatory requirements, complex data relationships, and the unique workflows of clinical and administrative users.
For healthcare SaaS companies, dashboards serve dual purposes: internal business intelligence to monitor your own platform performance, and a customer-facing analytics product that your clients embed within their workflows. The latter represents the larger opportunity, and the more complex technical challenge.
Healthcare dashboards differ fundamentally from standard business dashboards in three critical ways. First, regulatory compliance isn't optional. Every dashboard displaying Protected Health Information (PHI) must meet HIPAA security standards, including encryption, audit logging, and role-based access controls (HIPAA Journal, 2025). Second, data complexity runs deeper. Healthcare data arrives in inconsistent formats from dozens of sources, requiring sophisticated integration approaches that maintain data integrity. Third, user diversity demands flexible interfaces. A dashboard serving both physicians making split-second clinical decisions and administrators planning quarterly budgets must accommodate radically different needs.
Six Components Recur in Every Healthcare Dashboard, and Connectors Carry the Risk
Modern healthcare dashboards comprise six essential elements. Data connectors form the foundation, integrating with EHR systems like Epic and Cerner, billing platforms, laboratory information systems, and real-time patient monitoring devices. The data visualization layer transforms raw data into charts, tables, and graphs optimized for rapid comprehension during time-sensitive decisions (GoodData, 2025).
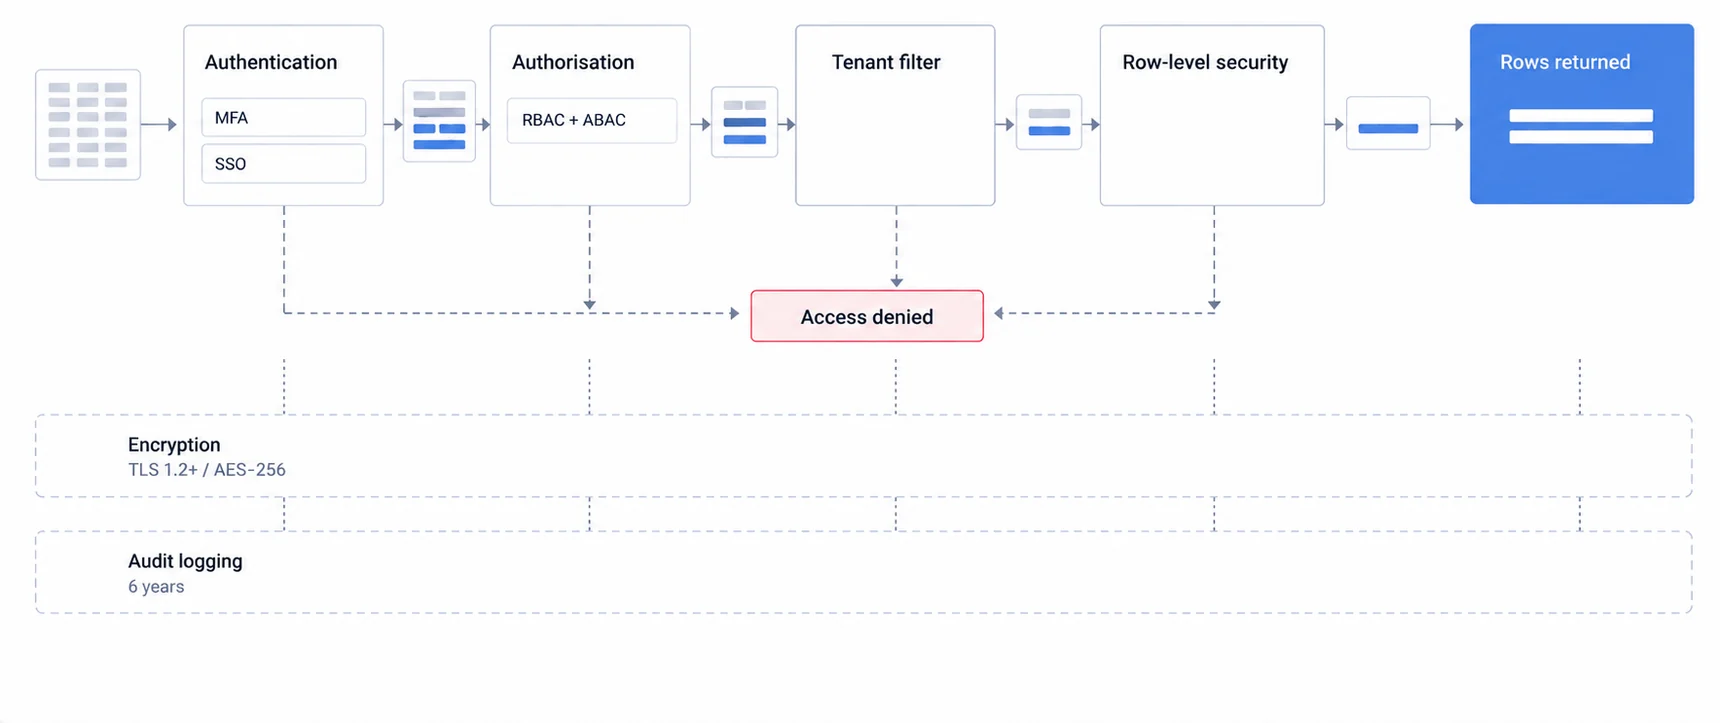
Security and compliance infrastructure operates continuously in the background. Multi-tenant isolation ensures patient data from one organization never mingles with another's. Row-level security controls which specific records each user can access based on their role and patient relationships. Audit logging tracks every data access event, creating the compliance trail HIPAA mandates.
Real-time processing capabilities enable dashboards to update as new data arrives, critical for emergency department monitoring and intensive care unit oversight. Mobile responsiveness allows physicians to access dashboards during rounds, and administrators to check metrics from any device. Finally, white-label customization lets healthcare SaaS products maintain brand consistency, displaying dashboards that appear native to your platform rather than obviously embedded third-party tools.
Healthcare Analytics Carries Constraints a General BI Dashboard Never Meets
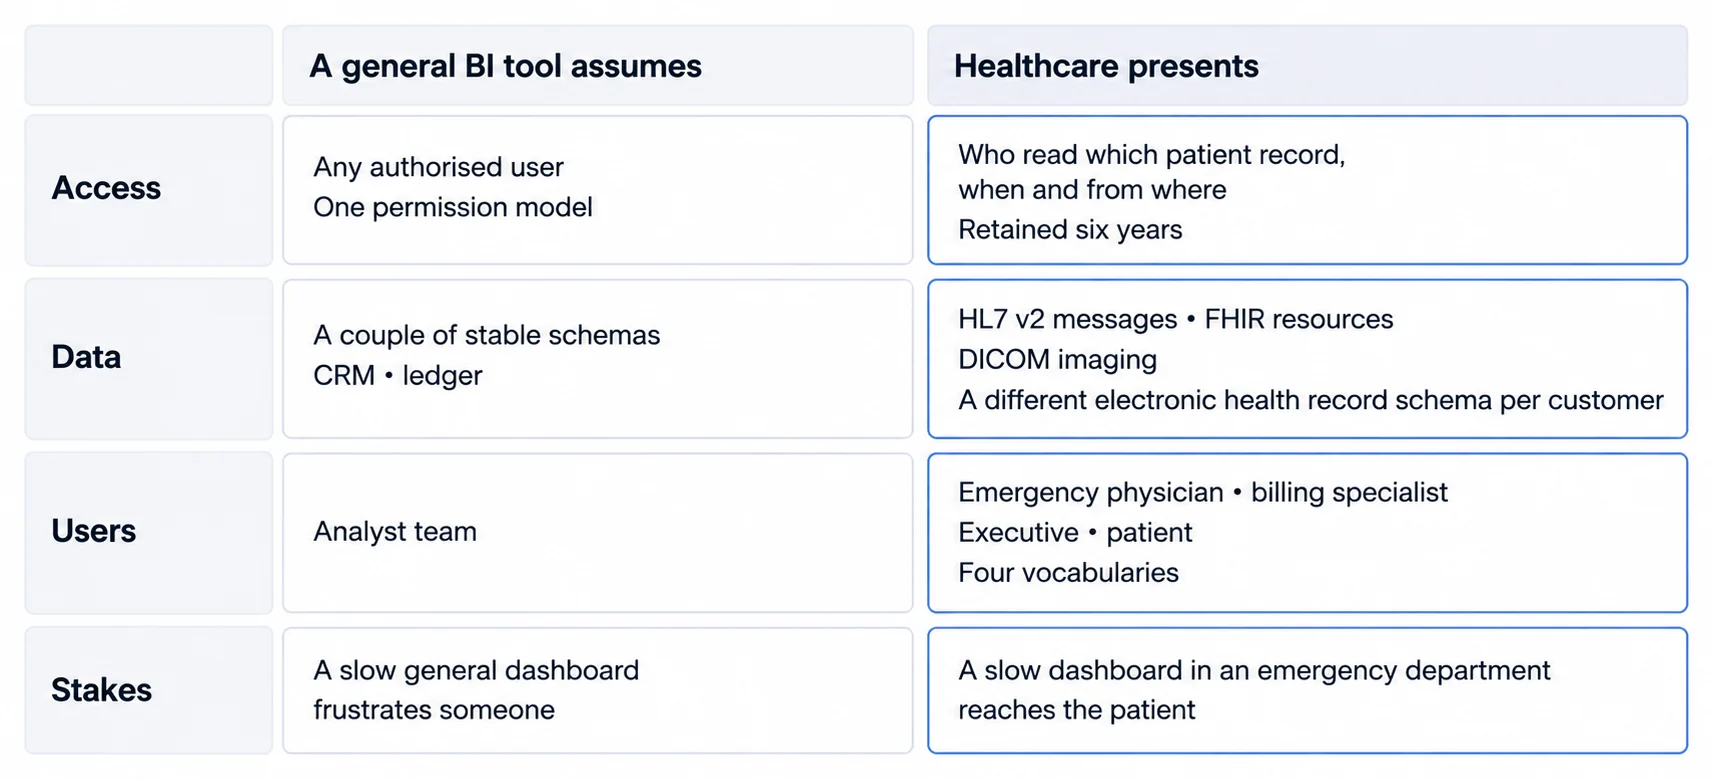
Healthcare analytics face constraints that generic business intelligence tools weren't designed to handle. HIPAA compliance creates a strict framework around who can access what data, when, and how that access gets documented. Generic BI tools often require extensive customization to meet these standards, customization that becomes your team's ongoing maintenance burden.
Clinical data structures present another distinction. While business dashboards might integrate sales data from Salesforce and financial data from QuickBooks, healthcare dashboards must reconcile HL7 messages, FHIR resources, DICOM imaging formats, and proprietary EHR schemas. This isn't a problem you solve once; as your customer base grows, you'll encounter dozens of variations in how healthcare organizations structure their data.
User diversity in healthcare exceeds most industries. Your dashboard might serve emergency physicians who need instant vital signs visualization, billing specialists analyzing claim denial patterns, hospital executives tracking strategic KPIs, and patients monitoring their own health metrics. Each group requires different views of data with different levels of clinical detail and terminology.
Finally, stakes matter differently in healthcare. A sluggish sales dashboard frustrates users. A slow healthcare dashboard in an emergency department directly impacts patient outcomes. Performance isn't a nice-to-have feature. It's a clinical requirement.
Healthcare Dashboards Split Four Ways, by Who Is Accountable for the Number
Healthcare dashboards segment into four primary categories, following the framework outlined in our dashboard types guide, each serving distinct user groups with specific decision-making needs. Understanding these categories helps healthcare SaaS companies prioritize which analytics capabilities to build first and how to position their embedded offerings (Arcadia, 2025).
Clinical dashboards are read mid-decision, so speed and clarity outrank completeness
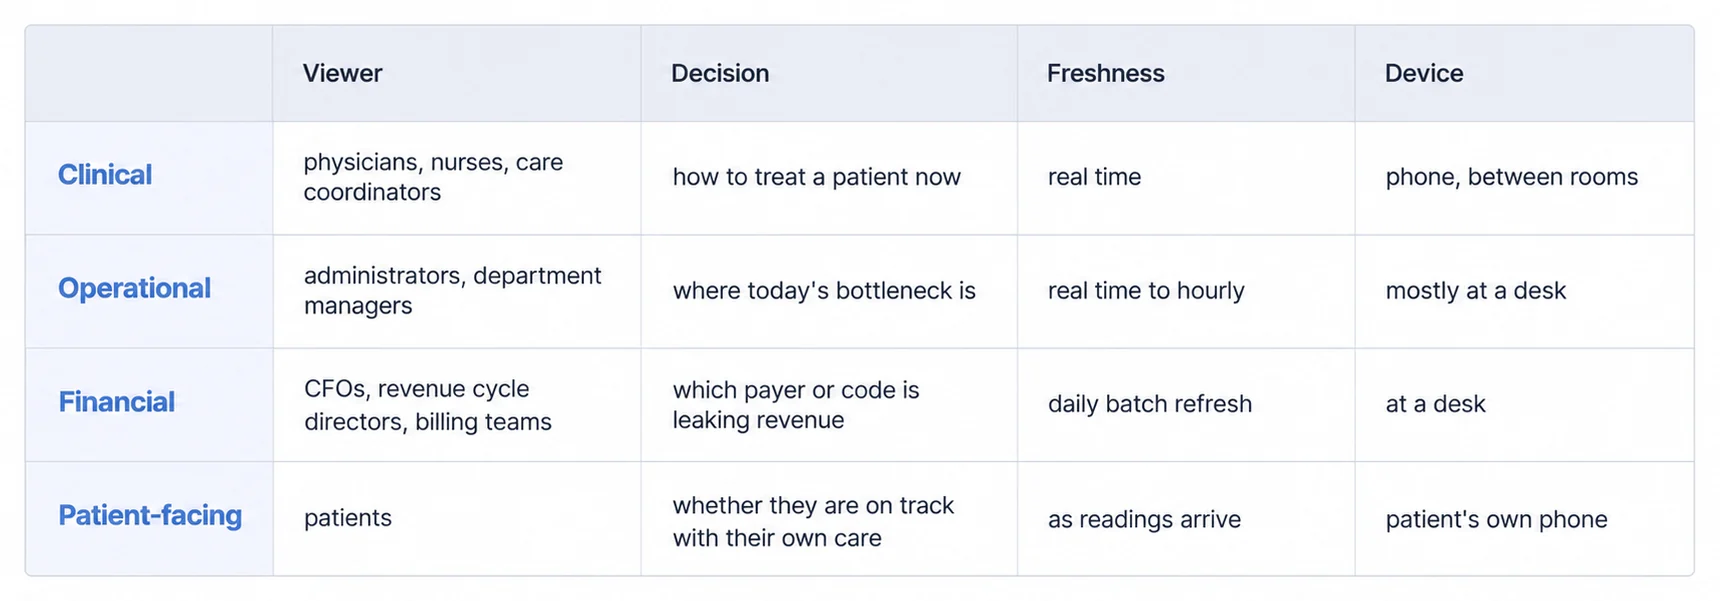
Clinical dashboards serve frontline healthcare providers, physicians, nurses, and care coordinators making real-time treatment decisions. These interfaces prioritize speed and clarity, displaying patient vital signs, medication schedules, lab results, and care team notes in formats optimized for rapid comprehension during high-pressure moments.
Patient status monitoring forms the core use case. Emergency department real-time dashboards track patient flow from admission through discharge, highlighting wait times and flagging patients requiring immediate attention. Intensive care unit dashboards display real-time vital signs with configurable alert thresholds, notifying staff when metrics deviate from normal ranges. Post-acute care dashboards help case managers coordinate discharge planning and follow-up appointments.
Clinical quality metrics provide the second layer of utility. Dashboards surface infection rates, medication adherence, readmission risks, and other indicators that inform both immediate patient care and longer-term quality improvement initiatives. For healthcare SaaS companies building EHR extensions or clinical decision support tools, embedding these capabilities directly into clinical workflows creates stickier products than requiring users to switch to separate analytics platforms.
Mobile accessibility matters more for clinical dashboards than any other type. Physicians move constantly, between exam rooms, operating suites, and patient floors. Dashboards that don't render cleanly on smartphones and tablets simply won't get used, regardless of their desktop functionality (Bold BI, 2025). Modern patient analytics dashboard implementations prioritize mobile-responsive designs that maintain clinical utility across all device types.
Operational dashboards answer where the capacity went, not how a patient is doing
Operational dashboards help hospital administrators, department managers, and operations teams optimize resources and improve facility performance. These interfaces focus on capacity utilization, staff productivity, patient flow efficiency, and operational cost management.
Bed management represents a critical operational use case. Dashboards visualize real-time bed availability across departments, predict discharge timing based on patient status, and identify bottlenecks preventing patient placement. The mechanism is visibility rather than capacity: boarding time falls when a placement decision stops waiting on a phone call to establish which beds are free. Single-site reductions get quoted for this, and they belong to the hospital that measured them, so no figure is given here.
Staffing optimization forms another key application. Dashboards correlate patient census with staff scheduling, identifying understaffed shifts before they create problems and highlighting overstaffing that wastes budget. Surgery scheduling dashboards maximize operating room utilization by minimizing gaps between procedures and flagging schedule patterns that lead to overtime costs.
Supply chain and equipment management dashboards track medical device utilization, pharmaceutical inventory levels, and supply costs across departments. Hospitals cut medical supply waste by identifying expiring inventory before it becomes unusable and setting par levels from actual consumption rather than historical guesswork. We are not quoting a reduction percentage, because we could not link a source that publishes one.
Financial dashboards follow the money from service delivered to payment collected
Financial dashboards target hospital CFOs, revenue cycle directors, and billing teams monitoring the economic health of healthcare organizations. These tools track everything from claims processing efficiency to payer mix analysis to days in accounts receivable.
Revenue cycle performance forms the primary focus. Dashboards visualize claim denial rates, days to payment, collections efficiency, and write-offs by payer, procedure type, and provider. Healthcare organizations using revenue cycle dashboards typically identify the denial patterns they can address: incorrect coding, missing documentation and authorization issues, which together account for a meaningful share of revenue leakage.
Payer contract performance provides another critical insight area. Dashboards compare reimbursement rates across different insurance contracts, helping organizations identify which payers consistently underpay relative to contract terms and which service lines generate strongest margins with specific payers. This intelligence informs contract renegotiation strategies and service line expansion decisions.
Cost management dashboards drill into departmental spending, procedure costs, and resource utilization. Hospitals identify procedures with costs exceeding reimbursements, departments spending above budget, and opportunities to standardize equipment purchasing across facilities to negotiate volume discounts.
Patient-facing dashboards are the newest category, and payment models are what created them
Patient-facing dashboards represent the newest category, driven by consumer expectations and value-based care payment models that reward patient engagement. These interfaces enable patients to track their own health data, understand treatment plans, and participate actively in care decisions.
White-label analytics matters critically for patient dashboards. These tools must reflect your healthcare SaaS brand, not a third-party analytics vendor's branding. Patients need to perceive dashboards as integral parts of your platform, not bolted-on afterthoughts. This integration builds trust and increases engagement rates.
Personal health records visualization helps patients understand their medical history. Dashboards display lab results with context explaining what values mean, medication lists with dosing instructions, vaccination records, and care team contact information. For healthcare SaaS companies building patient portals or telehealth platforms, embedded analytics products deliver these capabilities without requiring custom development.
Wellness and chronic disease management represents a high-engagement use case. Diabetes patients track blood glucose trends and see how diet and medication affect levels. Hypertension patients monitor blood pressure patterns and medication adherence. Weight management dashboards visualize progress toward goals. The shift from reactive sick care to proactive health management creates sustained dashboard engagement rather than one-time logins after doctor visits.
Care coordination dashboards help patients work through complex treatment journeys. Cancer patients see upcoming appointments, treatment protocols, side effect management guidance, and care team members coordinating their treatment. Surgical patients track pre-operative preparation requirements, post-operative recovery milestones, and rehabilitation progress.
Healthcare Metrics Follow the User Group, Because a Measure Label Is Not a Specification
Effective healthcare dashboards require selecting the right metrics for each user group. Too many metrics overwhelm users. Too few metrics miss critical insights. The following framework organizes essential healthcare metrics by dashboard type and user role.
| Category | Example metrics | Primary users |
|---|---|---|
| Clinical | Readmission rate, hospital-acquired infections, medication adherence, complication and mortality rates | Clinical teams |
| Operational | Avg length of stay, ED wait times, OR utilization (70-85% target), staff productivity | Hospital management |
| Financial | Days in A/R (30-40 day target), claim denial rate, net collection rate (95%+) | Revenue cycle teams |
| Patient engagement | Portal login frequency, appointment adherence, refill rates, HCAHPS satisfaction scores | Patient experience teams |
Clinical metrics measure outcomes and care quality, starting with who came back
Clinical metrics focus on patient outcomes and care quality. Readmission rates measure whether patients return to hospitals within 30 days of discharge, indicating either inadequate treatment or insufficient discharge planning. Hospital-acquired infection rates track conditions patients develop during hospitalization, central line infections, catheter-associated urinary tract infections, surgical site infections, ventilator-associated pneumonia. These metrics directly correlate with patient safety and reimbursement; Medicare penalizes hospitals with high infection rates.
Medication adherence tracks whether patients take prescribed medications as directed. Non-adherence contributes to 125,000 deaths annually and costs $290 billion in avoidable medical spending (NCBI, 2025). Dashboards visualizing adherence patterns help care teams intervene with patients struggling to maintain medication regimens.
Clinical outcome metrics measure treatment effectiveness. For surgical procedures, dashboards track complication rates, mortality rates, and length of stay by procedure type and surgeon. For chronic disease management, dashboards monitor disease progression markers, A1C levels for diabetes patients, blood pressure control for hypertension, viral load for HIV patients.
KPI dashboards for clinical teams typically display 10-15 key metrics updated daily or in real-time depending on clinical setting urgency. Emergency departments need real-time updates; outpatient clinics suffice with daily refreshes. More complete analysis appears in our healthcare KPI metrics guide.
Operational metrics measure efficiency, and length of stay carries two different stories
Operational metrics focus on efficiency and resource utilization. Average length of stay measures how long patients occupy beds, with longer stays indicating either complex cases requiring extended treatment or inefficient discharge processes. Emergency department wait times and patient boarding hours directly affect patient satisfaction and clinical outcomes.
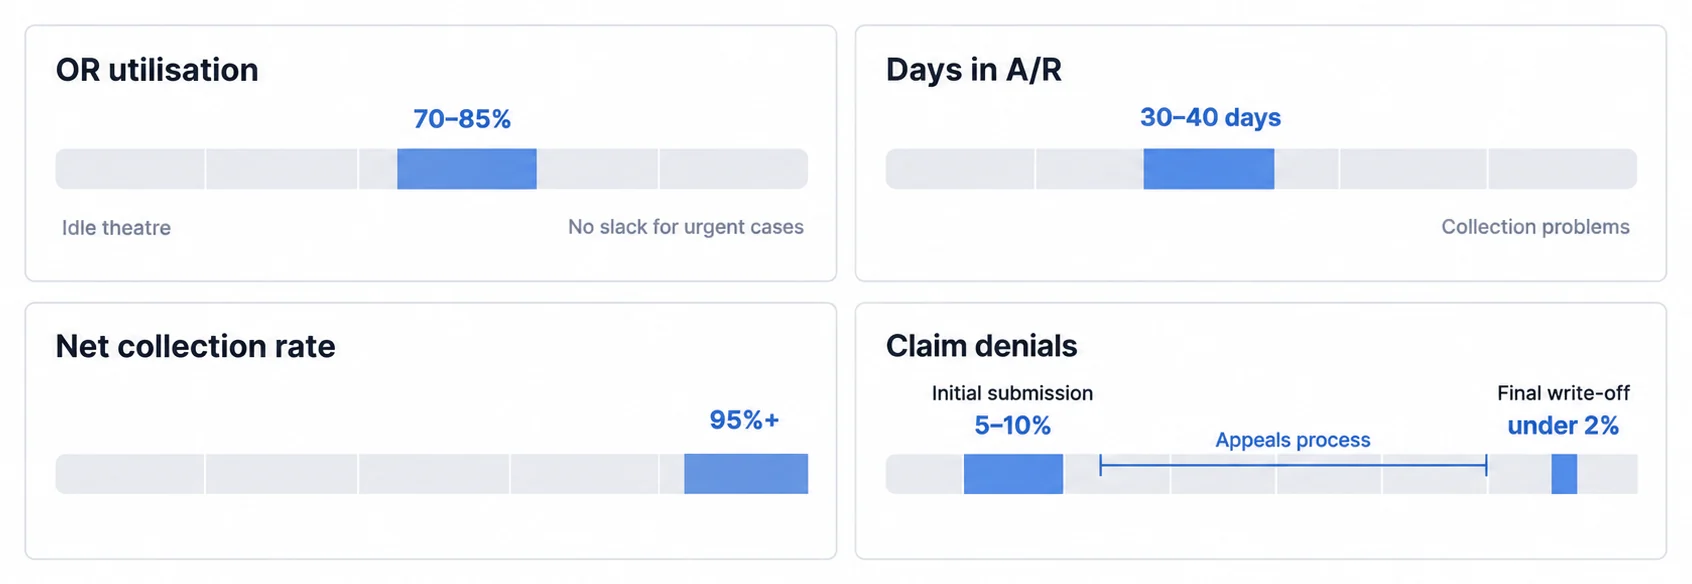
Operating room utilization tracks the percentage of available surgery time actually used for procedures. Hospitals targeting 70-85% utilization balance maximizing expensive operating room capacity against scheduling flexibility for urgent cases. First-case on-time starts measure whether the first surgery of each day begins as scheduled; delays cascade through the day's surgical schedule.
Staff productivity metrics include patients per nurse (monitoring workload safety), revenue per provider (tracking clinical productivity), and overtime hours by department (identifying staffing imbalances). Supply chain metrics track inventory turnover, days supply on hand, and supply costs per patient day.
Patient flow metrics visualize how patients move through care continuum, admission to discharge for inpatients, arrival to departure for emergency patients, registration to appointment completion for outpatients. Bottlenecks in patient flow indicate process problems needing operational intervention.
Financial metrics measure the revenue cycle, and days in accounts receivable is its clock
Financial metrics focus on revenue cycle performance and profitability. Days in accounts receivable measures average time from service delivery to payment collection. Healthcare organizations target 30-40 days; higher values indicate collection problems needing resolution.
Claim denial rates and denial write-off percentages reveal revenue leakage. Initial denial rates of 5-10% are typical, but final write-off rates should remain under 2% if organizations effectively appeal denied claims. Dashboards breaking down denials by payer, denial reason, and provider help identify systematic problems, certain payers consistently denying specific procedure codes, particular providers generating documentation deficiencies, authorization problems concentrated in specific departments.
Net collection rate measures how much of expected revenue healthcare organizations actually collect after contractual adjustments and write-offs. Organizations achieving 95%+ collection rates demonstrate strong revenue cycle management. Lower rates indicate either aggressive charge schedules disconnected from payer contract reimbursement or ineffective collection processes.
Revenue by service line and payer mix analysis shows which clinical specialties and insurance types drive financial performance. Some service lines generate strong margins; others operate at break-even or loss to fulfill community benefit obligations. Payer mix dashboards reveal whether patient populations skew toward high-reimbursing commercial insurance or lower-reimbursing Medicaid/Medicare.
Patient engagement metrics measure participation, and portal logins are the first signal
Patient engagement metrics measure how actively patients participate in their own care. Portal login frequency indicates whether patients access their health information regularly. Appointment adherence rates track whether patients attend scheduled visits; high no-show rates suggest access barriers or engagement problems.
Medication refill rates serve as proxy measures for medication adherence; patients refilling prescriptions on schedule more likely take medications as directed. Patient-reported outcome measures (PROMs) track symptoms, functionality, and quality of life from patient perspectives rather than clinical observations alone.
Satisfaction scores from patient surveys correlate with engagement levels. The Hospital Consumer Assessment of Healthcare Providers and Systems (HCAHPS) survey measures patient experience across multiple dimensions, communication with doctors and nurses, responsiveness of hospital staff, cleanliness and quietness of environment, pain management, medication communication, and discharge information quality.
Healthcare Dashboard Design Adds Clinical Context to the Universal Principles
Creating effective healthcare dashboards requires understanding both universal design principles and healthcare-specific considerations. The following practices emerge from studying high-performing healthcare analytics implementations across multiple organizations and vendor platforms.
Information density has to be traded against comprehension speed, not maximised
Healthcare dashboards must balance information density against comprehension speed. Clinical dashboards serving emergency physicians need to pack maximum relevant information into limited screen space, vital signs, medication allergies, recent lab results, active problems all visible without scrolling. Patient-facing dashboards can afford more whitespace and explanation since users aren't making split-second decisions.
The "5-second rule" guides clinical dashboard design: users should grasp the patient's status within 5 seconds of viewing the dashboard. This demands clear visual hierarchies emphasizing abnormal values through color, size, and position. Critical information appears in the upper-left quadrant where eyes naturally gravitate first in left-to-right reading cultures.
Color coding follows clinical conventions. Red indicates critical abnormal values requiring immediate attention. Yellow flags borderline values needing monitoring. Green shows normal ranges. This color scheme aligns with clinical training and reduces cognitive load. However, roughly 1 in 12 men (8%) and 1 in 200 women (0.5%) have a colour vision deficiency (Colour Blind Awareness); effective dashboards supplement color with icons, text labels, and patterns ensuring accessibility for all users.
Information density varies by user expertise. Physicians trained to interpret dense data tables appreciate complete dashboards displaying multiple data streams simultaneously. Patients with limited health literacy need simpler dashboards explaining clinical concepts in plain language and minimizing medical jargon. Healthcare SaaS platforms serving diverse user types benefit from configurable dashboards adapting information density to user roles.
Our dashboard design principles guide explores universal principles applicable across industries. Healthcare implementations add compliance requirements and clinical workflow considerations to these baseline best practices. Similarly, our data visualization best practices framework provides foundation for effective chart selection and visual encoding.
Physicians are rarely at a workstation, so mobile is the primary surface
Physicians spend limited time at desktop workstations. Modern clinical workflows demand dashboards functioning effectively on smartphones and tablets. Truly mobile-optimized dashboards don't simply scale desktop designs to smaller screens, they reimagine interfaces for touch interaction and limited screen real estate.
Priority-based layouts show critical information first on mobile devices, relegating detailed breakdowns to scrollable sections below the fold. Swipeable card interfaces let users quickly browse through patient lists or data categories. Collapsible sections hide secondary information until users explicitly expand them.
Touch-friendly controls require larger tap targets than mouse-pointer interfaces. Buttons and links need minimum 44x44 pixel dimensions to accommodate finger taps; smaller targets generate frustration and misclicks. Spacing between interactive elements prevents accidental activation of adjacent controls.
Offline functionality matters for mobile clinical dashboards. Physicians rounding in hospital areas with poor WiFi coverage or working in remote clinics with unreliable internet need dashboards caching essential data locally. Progressive web app technologies enable dashboards that work offline and sync when connectivity resumes.
A number without its reference range is not information yet
Effective healthcare dashboards provide context helping users interpret data correctly. Raw numbers without reference ranges create confusion, is 142 mg/dL glucose high, normal, or low? Dashboards displaying reference ranges, trend arrows indicating direction of change, and historical context enable informed interpretation.
Patient-facing dashboards especially benefit from embedded education. Diabetes dashboards explaining what A1C measures and why it matters improve patient understanding and engagement. Definitions of medical terminology, explanations of treatment goals, and guidance on when to contact care teams transform dashboards from data displays into patient education tools.
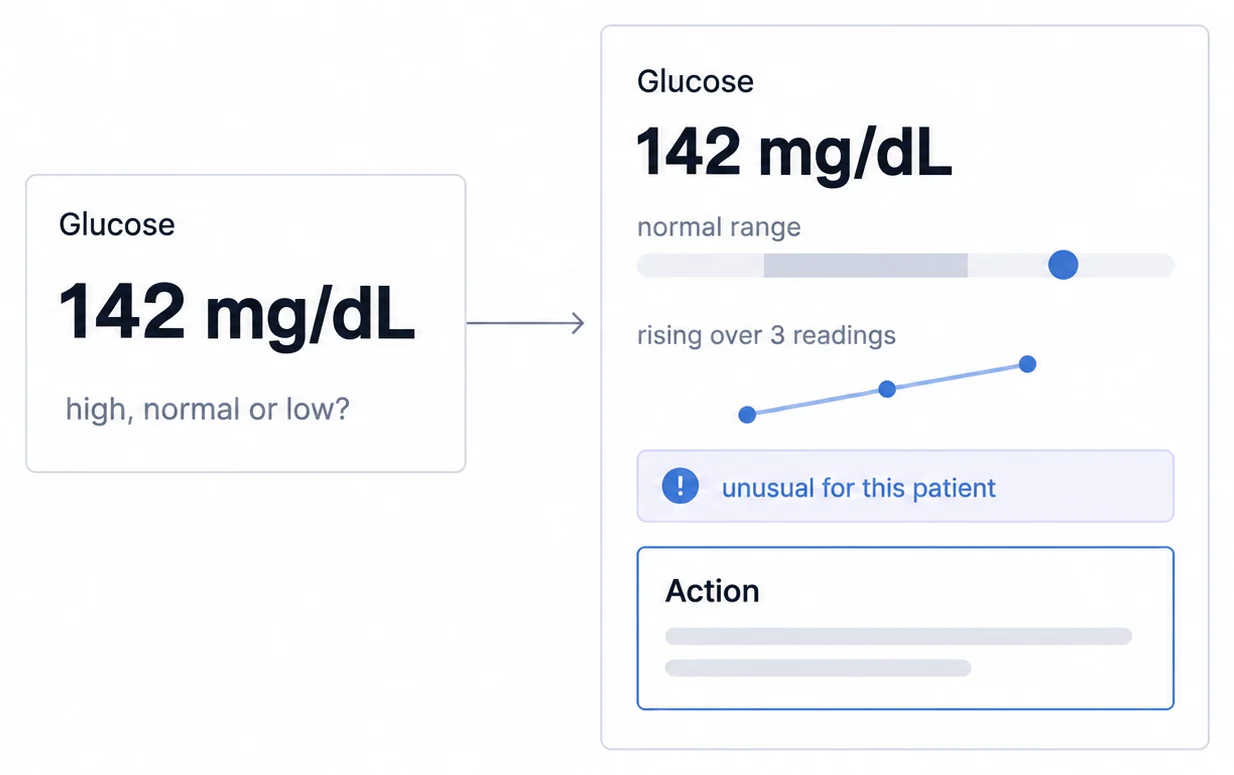
Contextual alerts guide attention to items requiring action. Rather than displaying dozens of metrics with equal visual weight, effective dashboards highlight abnormal values and metrics trending in concerning directions. Alert fatigue (users ignoring frequent low-priority notifications) plagues poorly designed systems. Thoughtful alert thresholds balance sensitivity (catching true problems) against specificity (minimizing false alarms).
A summary tile creates the question that drill-down has to answer
High-level summary dashboards provide situational awareness but users often need deeper detail. Drill-down capabilities let users click from summary metrics to underlying details without working through away from their current context.
Clinical dashboards might display patient census by department at the summary level, then drill down to individual patient lists, then to specific patient charts. Financial dashboards show overall revenue cycle performance, drill to performance by payer, then to specific denied claims needing resolution.
Breadcrumb navigation shows users their current position in data hierarchies and enables quick return to higher levels. "Back" buttons and clear visual transitions between detail levels prevent users from getting lost in nested data views.
The decision sets the time horizon, so real-time and historical are not competing
Different decisions require different time horizons. Clinical decisions often need real-time or near-real-time data. Intensive care unit dashboards displaying vital signs from 6 hours ago provide little value; these dashboards refresh every few seconds to minutes. Emergency department patient tracking dashboards update continuously as patients arrive, move through treatment stages, and discharge.
Operational and financial decisions typically rely more on historical trends than real-time snapshots. Revenue cycle dashboards compare current month performance against prior months and year-over-year trends. Staffing dashboards analyze patterns across weeks to identify systematic over/understaffing rather than reacting to single-day fluctuations.
Effective dashboards provide both views. Real-time analytics capabilities update critical metrics as new data arrives while historical trend charts provide context. Users toggle between live monitoring during active management and historical analysis during planning sessions. Our real-time dashboards guide explores technical approaches for implementing live data updates without overwhelming users or infrastructure.
Healthcare Data Arrives From Systems With Different Formats, Latency and Consent Rules
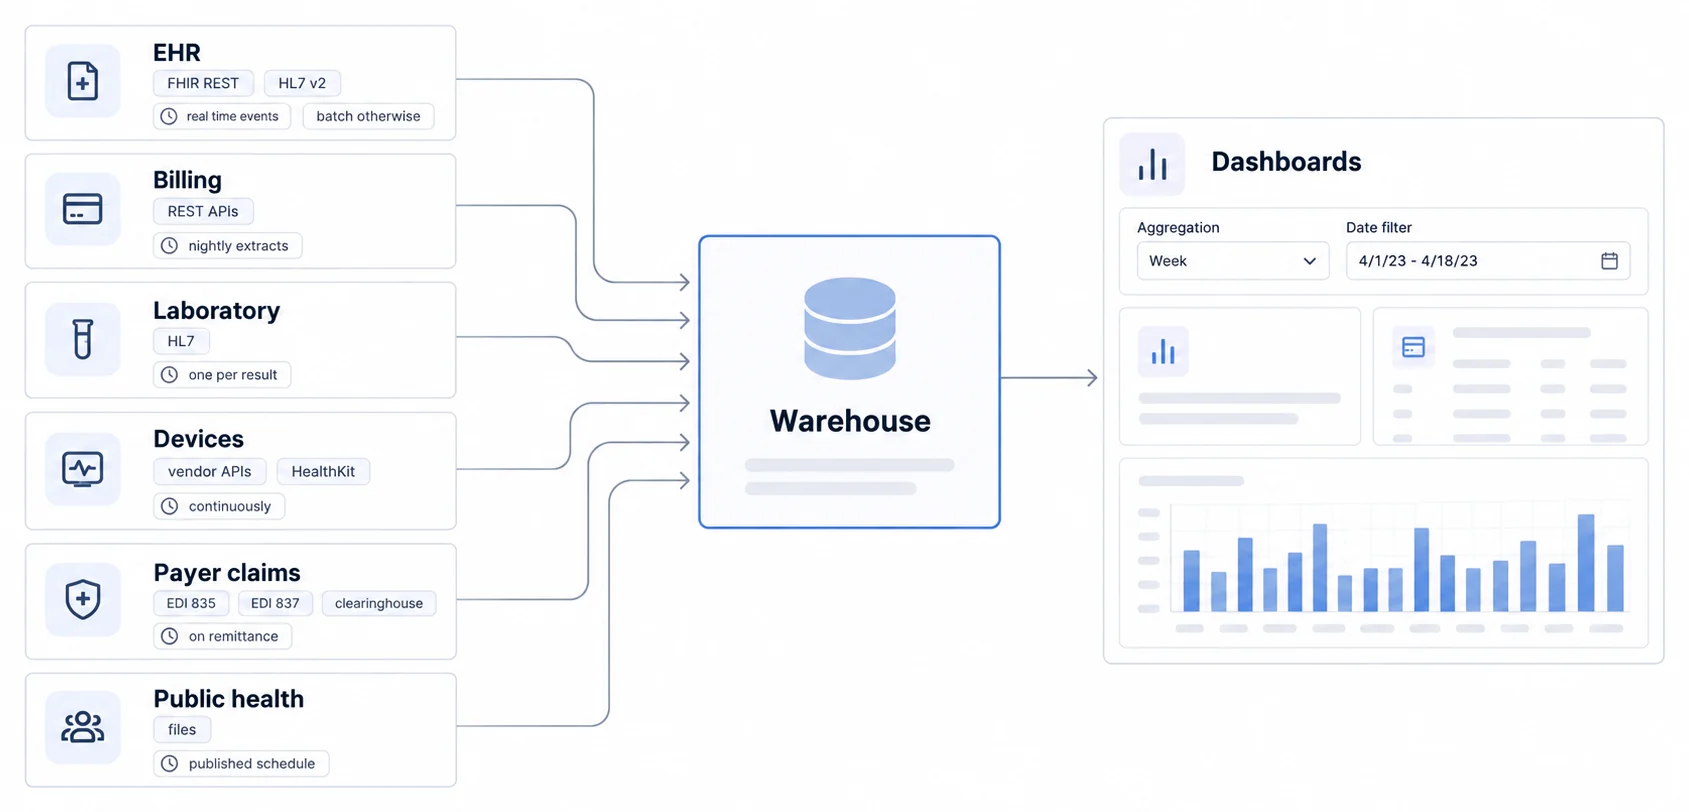
Healthcare dashboards aggregate data from numerous sources, each with distinct data formats, refresh frequencies, and integration approaches. Successfully connecting these sources while maintaining data integrity and regulatory compliance represents one of the more challenging technical aspects of healthcare dashboard implementation.
EHR systems hold the clinical record, and Epic and Cerner decide how you reach it
EHR systems store the complete clinical record, patient demographics, medical history, medications, lab results, imaging reports, clinical notes. Epic and Cerner dominate the U.S. hospital EHR market, with Meditech, Allscripts, and athenahealth serving additional market segments. Outpatient practices often use different EHR systems than hospitals, requiring dashboard platforms to integrate with multiple EHR vendors.
FHIR (Fast Healthcare Interoperability Resources) represents the modern standard for EHR integration. FHIR provides RESTful APIs accessing structured clinical data, patient resources, encounter resources, observation resources, medication resources. The 21st Century Cures Act mandates that certified EHR systems support FHIR APIs, improving healthcare SaaS platforms' ability to access clinical data programmatically.
HL7 v2 interfaces remain common for real-time clinical event notifications. EHR systems send HL7 messages when patients admit, discharge, transfer, or when new lab results become available. These pipe-delimited text messages require parsing into structured formats for dashboard consumption. While FHIR gradually replaces HL7 v2, legacy integrations persist for years during healthcare's characteristically slow technology transitions.
Direct database access provides another integration approach, particularly for healthcare organizations running dashboards internally rather than embedding analytics in external SaaS platforms. EHR vendors generally discourage direct database queries, database schemas change without notice, queries can impact EHR performance, and vendor support doesn't cover problems caused by external database access. However, organizations needing maximum flexibility sometimes accept these trade-offs.
Billing systems track the lifecycle from registration to the payment that closes it
Revenue cycle systems track the financial lifecycle from patient registration through final payment collection. These systems store claims data, payment data, payer contracts, patient account balances, and denial information. Epic and Cerner offer integrated revenue cycle modules, while specialized revenue cycle vendors like Change Healthcare and Optum provide standalone platforms.
Claims data provides rich analytics substrate, procedure codes revealing services delivered, diagnosis codes indicating clinical conditions, place of service codes showing where care occurred, modifier codes capturing special circumstances affecting reimbursement. Effective financial dashboards use this coded data to analyze service utilization patterns, reimbursement trends, and denial root causes.
Integration approaches vary by system architecture. Cloud-based revenue cycle systems typically offer REST APIs for data access. Legacy on-premise systems might require database connections, file exports, or custom integration development. Many healthcare organizations run daily batch extracts from billing systems, loading aggregated data into analytics databases feeding dashboard platforms.
Laboratory systems own the result before the EHR ever shows it
Laboratory systems manage test orders, specimen tracking, result reporting, and quality control for clinical laboratories. Lab data flows into EHR systems for clinical use but dashboards sometimes integrate directly with LIS for analytics unavailable through EHR interfaces, lab turnaround times, specimen rejection rates, quality metrics.
HL7 messages communicate lab orders from EHR to LIS and results from LIS back to EHR. Dashboards monitoring lab operations typically tap into these HL7 feeds or query LIS databases directly. Lab dashboards track test volume by type, average turnaround time, critical result notification compliance, and quality control metrics.
Devices produce a continuous stream, which is a different ingestion problem entirely
Wearable devices, implantable monitors, and home monitoring equipment generate continuous streams of patient data. Glucose meters, blood pressure cuffs, weight scales, activity trackers, cardiac monitors, and sleep apnea machines increasingly transmit data to cloud platforms that dashboards can access via APIs.
Integration complexity varies by device ecosystem. Some manufacturers provide open APIs enabling third-party access. Others gate data behind proprietary platforms requiring contractual relationships. Apple HealthKit and Google Fit aggregate data from multiple consumer devices, providing single integration points accessing diverse data streams.
Real-time processing requirements for device data exceed most other healthcare data sources. Cardiac monitors need immediate alert capabilities when dangerous rhythms appear. Remote patient monitoring platforms create dashboards updating as new readings arrive rather than batch-processing overnight.
Payer claims data is where you learn what was denied, and why
Insurance payers provide claims data back to healthcare providers showing which services they've paid, denied, or are still processing. This data reveals reimbursement trends, denial patterns, and coverage policies affecting revenue.
Electronic Data Interchange (EDI) standards govern payer-provider data exchange. The 835 transaction set communicates payment information; 837 transactions submit claims. Healthcare clearinghouses often sit between providers and payers, translating data formats and managing transmission logistics. Dashboards accessing payer data typically integrate with clearinghouses or internal billing systems that receive clearinghouse data rather than connecting directly to each payer.
Registry reporting is an obligation, so the dashboard tracks compliance rather than insight
Healthcare organizations report data to public health agencies, disease registries, and quality reporting programs. Dashboards monitoring compliance with reporting requirements track submission deadlines, data quality, and completeness metrics.
Some dashboards incorporate external benchmark data from public sources, Medicare claims data, CDC disease surveillance, CMS quality metrics, state health department statistics. These benchmarks provide context helping organizations compare their performance against peer institutions or geographic regions.
Building Healthcare Analytics In-House Means Owning HIPAA Alongside the Charts
Healthcare SaaS companies face a fundamental decision: build analytics capabilities in-house or embed third-party dashboard platforms. This choice affects product development timelines, engineering resource allocation, feature completeness, and total cost of ownership over 3-5 years.
Building buys maximum control, and the bill arrives as engineering time
Building healthcare dashboards in-house offers maximum control over features, user experience, and data architecture. Your engineering team fully understands the codebase, can implement custom visualizations exactly matching product vision, and maintains ability to modify dashboards without third-party dependencies.
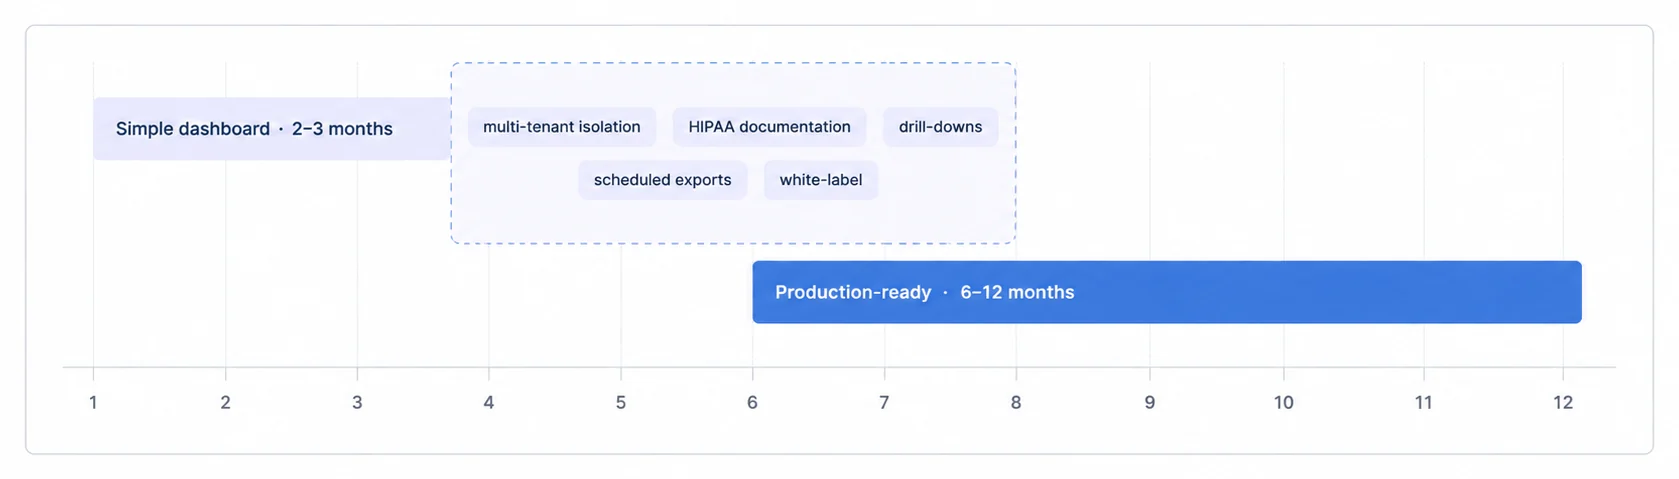
Simple dashboards displaying basic charts might reach production in 2-3 months. Production-ready analytics with advanced features, drill-downs, scheduled exports, white-label customization, multi-tenant isolation, HIPAA compliance documentation, realistically require 6-12 months. The gap between those two is where estimates usually go wrong: the compliance documentation and the multi-tenant isolation are easy to leave out of a plan and hard to leave out of a product.
Development costs accumulate beyond initial estimates. A dedicated team working full-time for 6-12 months is the direct labour line. Add product management, design, QA and infrastructure, and the project reaches $200K-500K+ before production, which is the range our own build-vs-buy guidance uses. Price the labour line at your own loaded costs; that is where the range narrows.
Maintenance work persists after launch. Dashboard infrastructure requires security patches, browser compatibility updates, database optimization, incident response, and feature changes driven by users and upstream systems. Estimate that recurring line from your own named owners, on-call coverage, loaded time, infrastructure invoices, and release history; a generic staffing ratio or annual figure does not describe your operating model.
Opportunity cost matters more than direct costs for most healthcare SaaS companies. Engineering time spent building analytics infrastructure doesn't build core product features differentiating your platform from competitors. If analytics isn't your primary product value proposition, dedicating extensive engineering resources to dashboard development potentially misallocates scarce technical talent.
The build vs buy embedded analytics decision framework examines factors beyond cost, strategic importance of analytics to product differentiation, available engineering resources, time-to-market pressures, and long-term product roadmap.
An embedded platform buys the infrastructure you would otherwise operate yourself
Embedded analytics platforms provide pre-built dashboard infrastructure that healthcare SaaS companies integrate into their products through SDKs and APIs. These platforms handle the undifferentiated heavy lifting, chart rendering, data connectors, export functionality, scheduling, authentication, multi-tenancy, enabling engineering teams to focus on healthcare-specific features and clinical workflows.
Time-to-production advantages drive many companies toward embedded platforms. Solutions like Sumboard enable integration in hours to days rather than months to years. Healthcare SaaS companies ship customer-facing analytics capabilities to market faster, potentially winning competitive deals where analytics matters to buyers.
Feature completeness represents another advantage. Purpose-built embedded analytics platforms provide capabilities that in-house builds often postpone, scheduled report delivery, mobile optimization, advanced filtering, complete export options, white-label customization. Building these features in-house extends development timelines and increases maintenance burden.
A platform provider takes on part of the HIPAA work rather than all of your team's burden. Reputable embedded analytics vendors maintain SOC 2 certification, implement required security controls, provide compliance documentation, and handle security updates. That shifts significant overhead, and what HIPAA-compliant analytics does and does not shift to the vendor is worth settling before you plan around it, because at least one vendor answers that question in its own documentation.
Cost structures favor embedded platforms for most healthcare SaaS companies. Platforms like Sumboard charge flat monthly fees (€199-€499) independent of viewer counts, providing predictable costs scaling with your business rather than per-user fees that explode as customer base grows. Over three years the platform side is arithmetic from that published price, €7,200 to €18,000. The in-house comparison is not arithmetic: build costs in this category get quoted in the high hundreds of thousands, and that is a planning assumption rather than a figure measured for your team.
If analytics represents a required feature rather than your core product differentiator, if you need production deployment within months rather than years, if engineering resources are constrained, and if avoiding ongoing maintenance burden matters, embedded analytics platforms typically deliver superior outcomes versus in-house builds.
A hybrid split works only when the two halves have genuinely different requirements
Some healthcare SaaS companies pursue hybrid strategies, building basic dashboards in-house while embedding third-party platforms for advanced analytics. This approach works when simple operational dashboards serve internal users while sophisticated customer-facing analytics require professional polish and complete features.
Another hybrid pattern involves white-label analytics platforms for initial launch, then gradually replacing vendor dashboards with custom builds as the product matures and engineering resources expand. This approach mitigates time-to-market risk while maintaining long-term flexibility.
Evaluate a Healthcare Embedded Platform on Compliance Evidence, Not Feature Lists
Healthcare SaaS companies evaluating embedded analytics products, Sumboard's included, should assess vendors across multiple dimensions beyond basic features and pricing. The following framework guides thorough evaluation ensuring platform selection aligns with technical requirements, business model, and long-term product strategy.
HIPAA compliance is not a negotiable feature, so ask for the evidence
HIPAA compliance isn't negotiable for platforms handling PHI. Vendors should provide:
- SOC 2 Type II audit reports demonstrating security controls
- Business Associate Agreement (BAA) coverage
- Encryption in transit (TLS 1.2+) and at rest (AES-256)
- Audit logging capturing all data access events
- Role-based access controls and row-level security
- Multi-factor authentication support
- Regular penetration testing and vulnerability assessments
Beyond HIPAA, evaluate whether platforms support additional compliance frameworks relevant to your customer base, GDPR for European customers, HITRUST for healthcare organizations with stringent security requirements, state-specific privacy laws like CCPA.
Ask vendors about their security incident response processes, data retention policies, and breach notification procedures. Healthcare organizations won't tolerate platforms creating compliance liabilities.
Every customer needs complete isolation, and that is an architecture question, not a setting
Healthcare SaaS platforms serve multiple customer organizations, each requiring complete data isolation from other customers. Embedded analytics platforms must support reliable multi-tenancy preventing data leakage between customers.
Evaluate tenant isolation approaches:
- Database-level isolation: Separate database instances or schemas per tenant provides strongest isolation but complicates vendor infrastructure management and can increase costs
- Row-level security: Shared databases with filtering logic ensuring queries only access data for the authenticated tenant
- API-level filtering: Application layer controls restricting data access based on authentication tokens
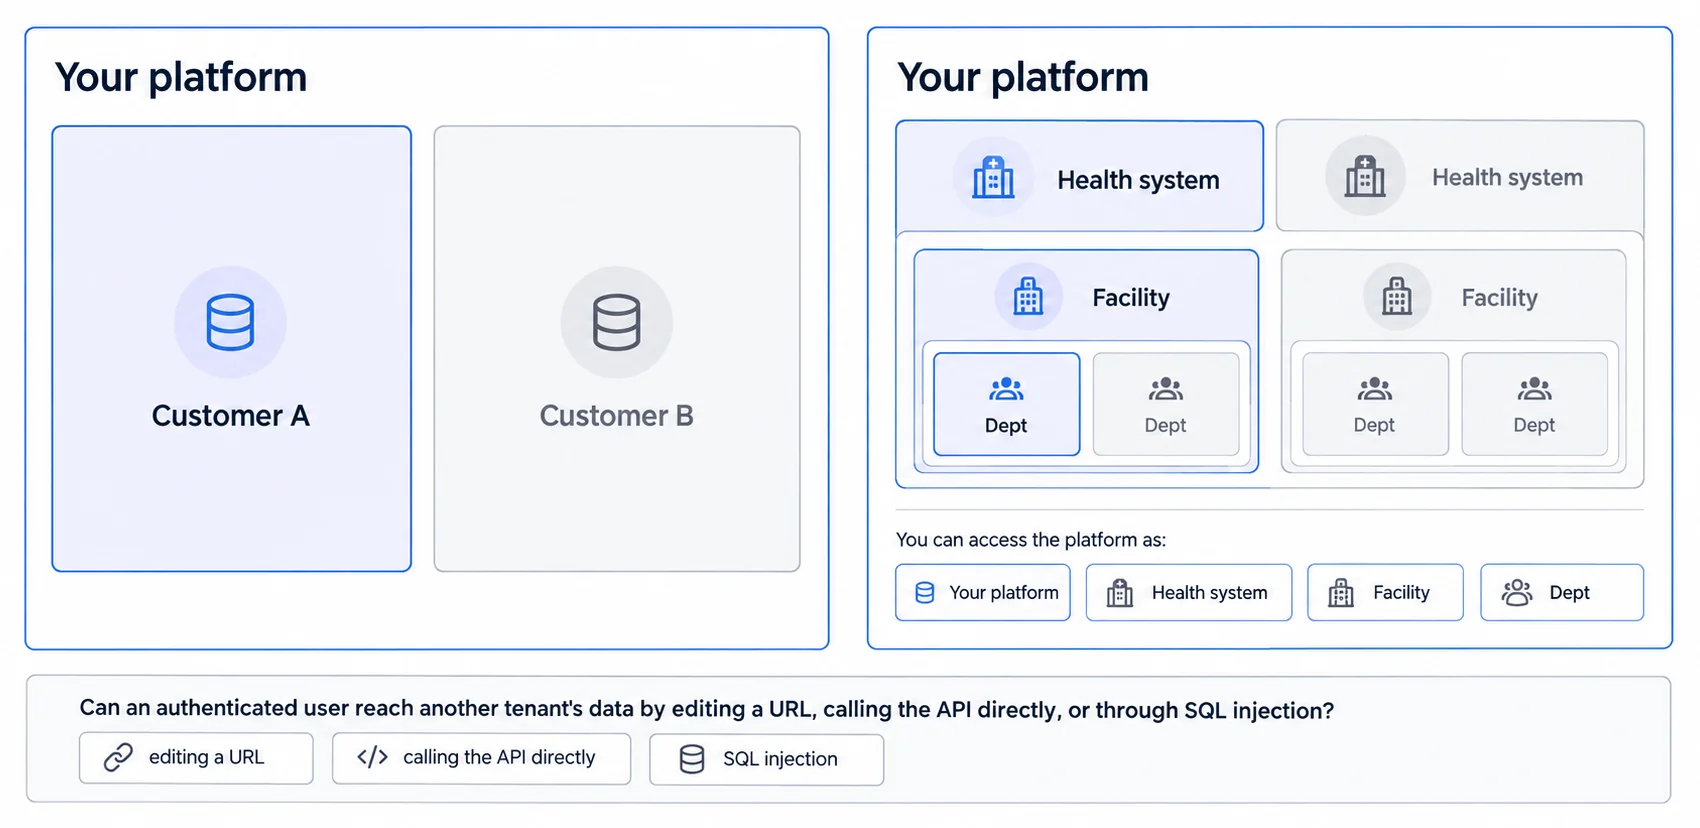
Test tenant isolation mechanisms thoroughly. Can authenticated users access data from other tenants through URL manipulation, API calls, or SQL injection? What happens if authentication tokens get compromised?
Assess whether platforms support hierarchical tenancy for healthcare SaaS companies serving both individual practices and health systems containing multiple facilities. You might need three-tier isolation: your platform contains multiple health systems, each health system contains multiple facilities, each facility serves multiple departments.
Integration breadth decides what the dashboard can ever show
Healthcare dashboards require connections to EHR systems, billing platforms, lab systems, medical devices, and potentially dozens of other sources. Evaluate platform integration approaches:
- Pre-built connectors: Does the vendor provide native integrations with Epic, Cerner, athenahealth, or other systems your customers use?
- API flexibility: Can you build custom connectors for proprietary or less common systems?
- FHIR support: Does the platform consume FHIR resources natively or require transformation?
- HL7 processing: Can the platform receive and parse HL7 v2 messages?
- Batch vs. real-time: Does data integration support both scheduled batch imports and real-time streaming?
- Data transformation: What ETL capabilities exist for cleaning, normalizing, and enriching healthcare data?
Some embedded platforms provide data warehousing and ETL as part of their offering. Others expect you to maintain separate data infrastructure and connect dashboards to your databases. Understand which approach aligns with your existing architecture and team capabilities.
Customers expect your product, not a third-party tool wearing your logo
Healthcare organizations using your SaaS platform expect analytics to match your product's look and feel, not obviously appear as third-party tools. Evaluate white-label capabilities:
- Branding customization: Can you replace vendor logos with yours, customize color schemes, and control typography?
- Domain control: Can dashboards render on your domain rather than vendor subdomains?
- UI flexibility: How much control do you have over dashboard layouts, chart types, and interaction patterns?
- Custom components: Can you extend platform capabilities with custom visualizations or business logic?
Test customization limits. Some platforms advertise white-label support but only allow superficial theming. Others provide SDK frameworks enabling deep customization approaching custom-built experiences.
Our guide to white-label analytics explores the spectrum of customization approaches across vendors and technical architectures enabling truly branded analytics experiences.
Pricing varies enough across vendors that the model matters more than the number
Pricing across the embedded analytics alternatives varies dramatically. Common models include:
- Flat monthly fees: Fixed costs regardless of usage, providing cost predictability
- Per-viewer pricing: Charges based on number of users accessing dashboards
- Per-dashboard pricing: Charges per published dashboard or report
- Compute-based pricing: Charges based on query processing or data volume
- Hybrid models: Combination of base fees plus usage-based components
For healthcare SaaS companies, per-viewer pricing creates problematic economics. If your SaaS platform charges €100-€500 per user monthly while analytics vendors charge €30-€50 per viewer, dashboard costs consume 10-50% of revenue per customer. This makes embedded analytics economically unfeasible.
Flat-fee models or capped pricing provide superior economics. Platforms like Sumboard charging €199-€499 monthly regardless of viewer count enable healthcare SaaS companies to offer unlimited analytics access to customers without per-user fees cascading through pricing.
Assess scaling costs beyond initial adoption. What happens when you reach 1000 customers? 10,000 end-user viewers? Vendors with per-user pricing might quote acceptable initial costs but become prohibitively expensive at scale.
Dashboard speed decides adoption, and clinical use raises the bar
Dashboard performance directly affects user adoption. Slow dashboards frustrate users and reduce engagement. For clinical dashboards supporting time-sensitive decisions, performance problems become patient safety issues.
Request performance benchmarks from vendors:
- Query response times: How quickly do dashboards load and refresh?
- Concurrent user capacity: How many simultaneous viewers can the platform support?
- Data volume limits: Does performance degrade with large datasets?
- Caching strategies: How do platforms optimize repeated queries?
Evaluate reliability through SLA (Service Level Agreement) commitments. Healthcare organizations reasonably expect 99.9% uptime (approximately 9 hours downtime annually). Ask about historical uptime performance, incident response times, and compensation if SLA targets aren't met.
Developer experience is what your team pays for every week after launch
Your engineering team's productivity integrating and maintaining embedded analytics depends on developer experience quality. Evaluate:
- Documentation quality: Is documentation complete, accurate, and well-organized?
- API design: Are APIs intuitive and RESTful or confusing and inconsistent?
- SDK maturity: Do SDKs exist for your technology stack (React, Vue, Angular)?
- Code examples: Are working code samples available for common integration patterns?
- Developer support: How responsive is technical support for integration questions?
Request proof-of-concept access. Your team should integrate the platform with sample data before committing to contracts. POCs reveal implementation friction that sales demonstrations never expose.
Healthcare Dashboard Use Cases Span Clinical, Operational and Financial Decisions
Healthcare dashboards serve diverse use cases across clinical, operational, and business contexts. Understanding these applications helps healthcare SaaS companies prioritize which analytics capabilities to build first and how to position embedded offerings for maximum market impact.
A command centre puts the dashboard on a wall, which changes what it may show
Large hospital systems increasingly implement operations command centers, physical spaces with wall-mounted dashboards providing real-time visibility into hospital status. These dashboards aggregate data across departments, facilities, and time zones, enabling coordinated response to capacity constraints, staffing shortages, and operational problems.
Command center dashboards typically display:
- System-wide capacity: Real-time bed availability across all facilities
- Patient flow: Emergency department volumes, admission/discharge rates, transfer requests
- Staffing levels: Actual vs. planned staffing by department and shift
- Critical events: Code calls, rapid response activations, equipment failures
- External factors: Ambulance diversion status, regional emergency department saturation, weather events affecting operations
Cleveland Clinic's centralized operations center reduced patient boarding times by 40% after implementing dashboards providing visibility into bed availability and predicted discharges across their multi-hospital system (Cleveland Clinic, 2024). Command center staff can proactively address capacity crunches before they create clinical problems or patient safety issues.
For healthcare SaaS companies, command center use cases suggest opportunities for embedded analytics use cases at enterprise scale. Hospital systems need platforms aggregating data from multiple facilities in a single interface rather than managing dozens of separate dashboards.
Value-based payment is what turned population health into a dashboard problem
Value-based care payment models compensate healthcare organizations for health outcomes rather than service volume. This shift creates demand for population health dashboards tracking patient cohorts over time rather than individual encounters.
Population health dashboards help care management teams identify high-risk patients needing intervention:
- Chronic disease registries: Diabetic patients with poor glucose control, heart failure patients with recent exacerbations, asthma patients with frequent emergency visits
- Preventive care gaps: Patients overdue for cancer screenings, vaccinations, or wellness visits
- Social determinants: Patients with transportation barriers, food insecurity, housing instability affecting health outcomes
- Care plan adherence: Patients not following treatment protocols or missing appointments
One accountable care organization using population health dashboards reduced hospital readmissions by 23% by identifying patients at highest readmission risk and providing intensive post-discharge support (NEJM Catalyst, 2025). Dashboards enabled proactive intervention rather than reactive response after readmissions occurred.
For healthcare SaaS companies building care management platforms or population health tools, these dashboards represent core product features rather than nice-to-have analytics. A customer-facing analytics product enabling care teams to identify intervention opportunities directly drives clinical and financial outcomes.
Telehealth generates its own analytics, and two audiences want different cuts of it
Telehealth platforms generate rich analytics around virtual visit patterns, patient engagement, and clinical outcomes. Dashboards help both telehealth companies monitor platform performance and healthcare organizations optimize virtual care delivery.
Telehealth operations dashboards track:
- Visit volumes: Daily telehealth encounters by specialty, provider, and time slot
- Wait times: Time from appointment request to scheduled visit, time from scheduled appointment to actual provider connection
- Technical quality: Video connection quality, audio problems, visit interruptions
- No-show rates: Percentage of scheduled telehealth visits where patients don't connect
- Patient satisfaction: Post-visit survey scores measuring virtual care experience
Clinical outcome dashboards assess telehealth effectiveness:
- Diagnosis accuracy: Conditions requiring subsequent in-person visits after telehealth diagnosis
- Treatment compliance: Whether patients fill prescriptions issued during telehealth visits
- Follow-up adherence: Whether patients complete recommended follow-up care after virtual visits
- Cost effectiveness: Comparing costs per episode of care for telehealth vs. in-person visits
The pandemic pushed telehealth from a small share of visits to a large one at its peak, and it settled well above where it started without holding that peak. We are not quoting the shares, because we could not link a source that states them. Dashboards distinguishing effective telehealth applications from scenarios requiring in-person care help healthcare organizations optimize virtual/physical care mix.
Revenue cycle dashboards carry the financial sustainability of the organisation
Revenue cycle dashboards deserve specific attention given their critical importance to healthcare organization financial sustainability. These dashboards help billing teams, revenue cycle directors, and CFOs identify revenue leakage and process inefficiencies.
Denial management dashboards represent high-value applications. Healthcare organizations carrying a material claim denial rate can cut write-offs through systematic denial analysis and appeal processes. We are not quoting before-and-after percentages, because we could not link a source that publishes them. Dashboards visualizing denial reasons, payers generating highest denials, providers with frequent documentation deficiencies, and procedure codes commonly denied enable targeted intervention.
Accounts receivable aging dashboards track outstanding balances by payer and aging bucket (0-30 days, 31-60 days, 61-90 days, 90+ days). Balances aging past 90 days become increasingly difficult to collect; dashboards highlighting old balances prompt collection activities before accounts become uncollectible.
Authorization dashboards monitor prior authorization requirements and approvals. Some procedures require insurance authorization before delivery; performing services without authorization creates denial risk. Dashboards tracking authorization status, average authorization processing times by payer, and authorization denial rates help organizations optimize authorization workflows.
White-label analytics platforms enable revenue cycle management SaaS companies to embed sophisticated financial dashboards into their products without building analytics infrastructure from scratch. These embedded capabilities become product differentiators in competitive RCM software markets.
Remote monitoring moves the data source into the patient's home
Remote patient monitoring platforms collect physiological data from home-based devices, blood pressure monitors, glucose meters, weight scales, pulse oximeters. RPM dashboards aggregate device data, identify patients with concerning trends, and enable proactive clinical intervention.
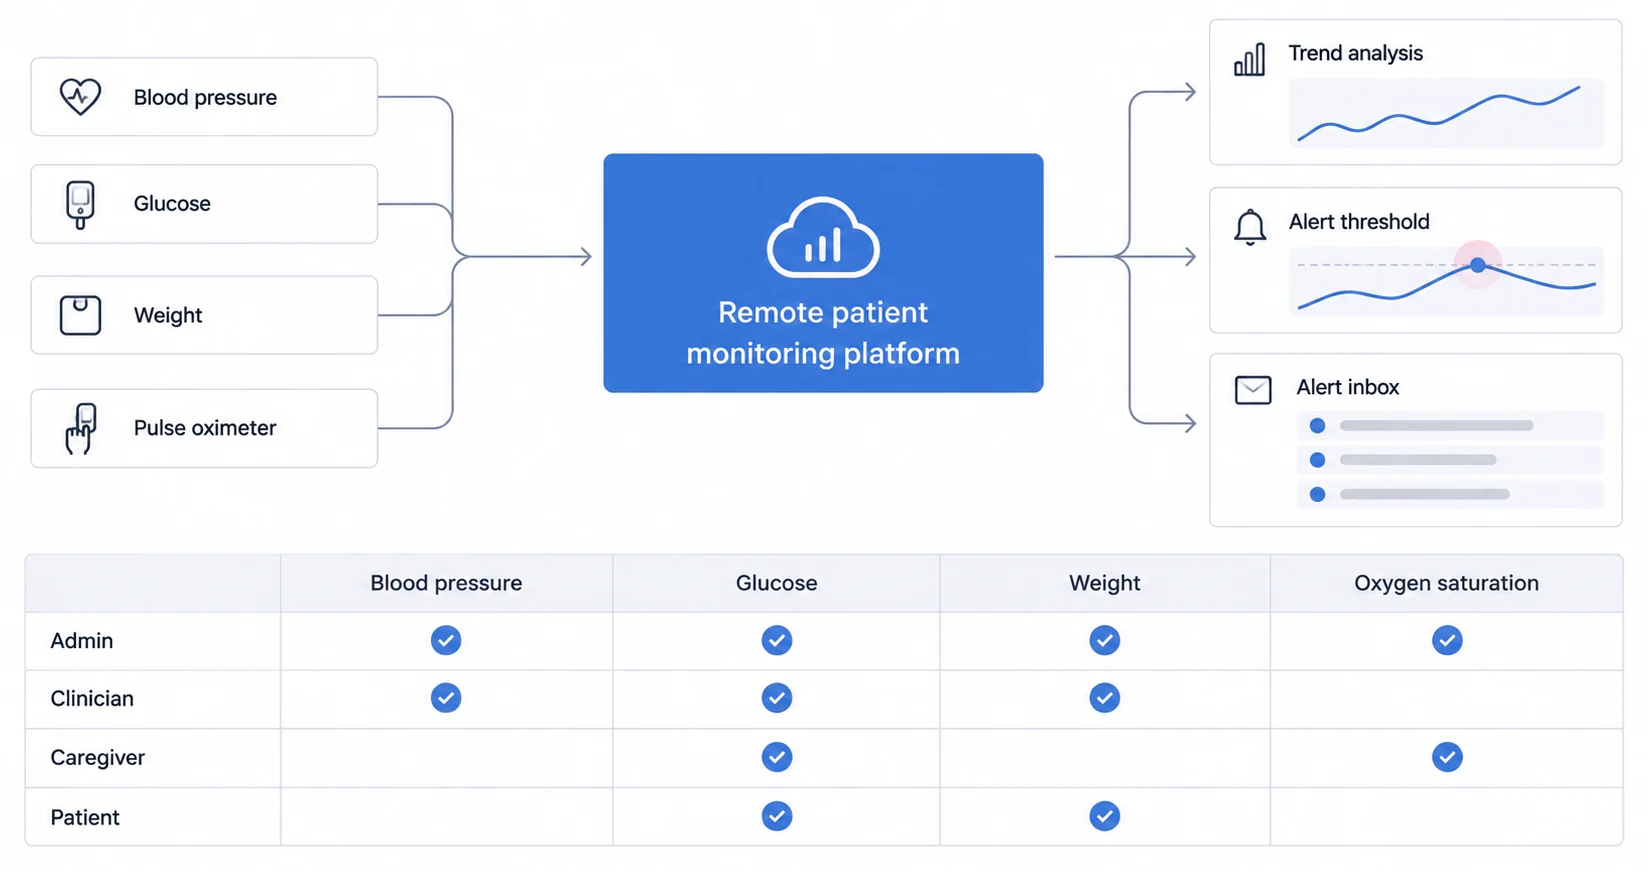
Patient summary dashboards show:
- Recent readings: Latest values from each monitored device
- Trend analysis: Graphs showing parameter changes over days or weeks
- Alert thresholds: Visual indicators when values exceed safe ranges
- Compliance tracking: Whether patients take readings as frequently as protocols require
Clinical team dashboards aggregate multiple patients:
- Alert inbox: Prioritized list of patients with abnormal readings
- Compliance reports: Patients not submitting regular readings
- Population trends: Aggregate metrics across entire patient panel
- Intervention tracking: Documentation of clinical responses to abnormal readings
One remote patient monitoring company serving heart failure patients reduced hospital readmissions by 38% through daily weight and vital sign monitoring with dashboard-driven clinical interventions (American Heart Association, 2024). Dashboards enabled care teams to detect fluid retention early and adjust diuretic dosing before patients required emergency department visits.
Healthcare SaaS companies building RPM platforms benefit from real-time dashboard capabilities. Devices transmit readings throughout the day; dashboards should update immediately rather than batch-processing overnight.
Healthcare CRM dashboards track the conversation rather than the care
Healthcare customer relationship management platforms help organizations manage patient communications, marketing campaigns, and engagement programs. CRM dashboards track patient acquisition, engagement patterns, and communication effectiveness.
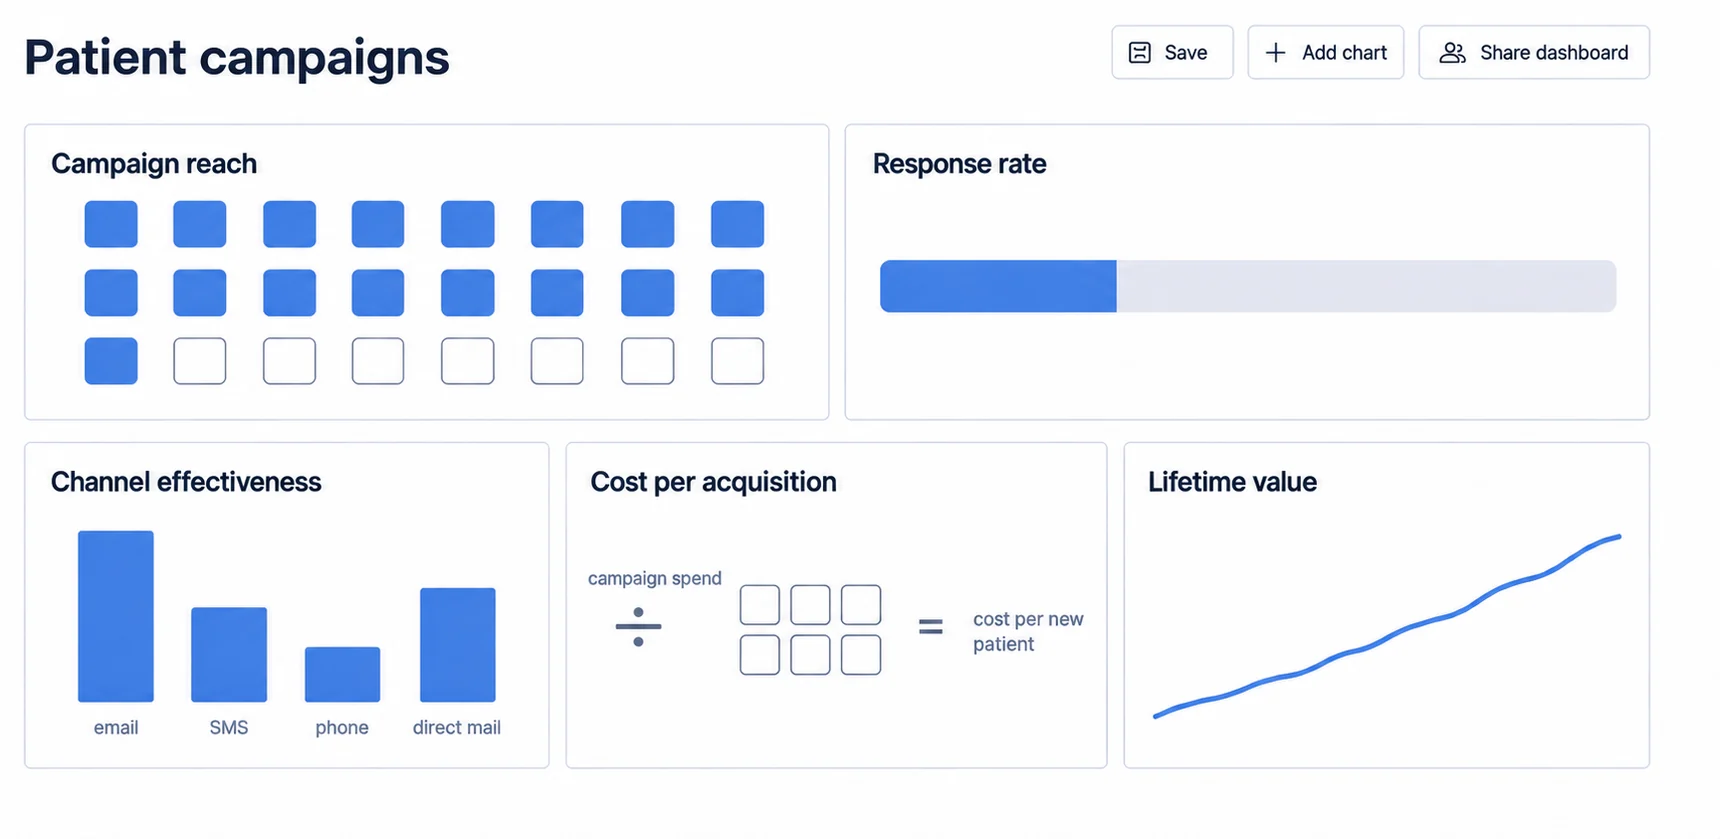
Marketing campaign dashboards measure:
- Campaign reach: Patients exposed to marketing messages
- Response rates: Patients scheduling appointments after marketing outreach
- Channel effectiveness: Comparing email, SMS, phone, and direct mail performance
- Cost per acquisition: Marketing spend divided by new patients acquired
- Lifetime value: Revenue generated by patients acquired through specific campaigns
Patient journey dashboards visualize:
- Touchpoint sequence: Path patients follow from awareness to appointment to ongoing care
- Drop-off analysis: Where potential patients disengage in the journey
- Conversion rates: Percentages converting from one journey stage to the next
- Time-to-appointment: Duration from initial contact to first scheduled visit
Engagement scoring dashboards identify highly engaged vs. at-risk patients:
- Portal usage: Login frequency, features accessed, time spent
- Appointment adherence: Historical no-show rates and cancellation patterns
- Communication preferences: Preferred channels and response rates
- Satisfaction indicators: Survey scores and sentiment analysis from patient feedback
Healthcare CRM platforms embedding sophisticated analytics gain competitive advantages in increasingly crowded markets. Providers comparing CRM solutions favor platforms providing actionable insights rather than basic contact management.
Healthcare Security and Compliance Are Requirements, Not Differentiators
Security and regulatory compliance represent non-negotiable requirements for healthcare dashboards handling Protected Health Information. HIPAA violations create substantial financial penalties, $100 to $50,000 per violation with annual maximums reaching $1.5 million per violation category (HHS, 2025). Beyond financial penalties, security breaches damage reputation and erode patient trust.
The HIPAA Security Rule names three safeguard classes, and all three land on the dashboard
The HIPAA Security Rule establishes national standards protecting electronic Protected Health Information (ePHI). Dashboard platforms must implement administrative, physical, and technical safeguards.
Administrative Safeguards require:
- Security management process: Risk analysis identifying vulnerabilities, risk management implementing countermeasures, sanction policies enforcing compliance, information system activity review monitoring security measures
- Workforce security: Authorization procedures determining access rights, workforce clearance confirming employee suitability, termination procedures revoking access promptly
- Information access management: Isolating healthcare clearinghouse functions, authorizing access based on job roles, implementing access establishment and modification procedures
- Security awareness and training: Security reminders updating staff on threats, protection from malicious software, log-in monitoring detecting unauthorized access, password management requiring strong authentication
Physical Safeguards address facility access and workstation security:
- Facility access controls: Limiting physical access to systems containing ePHI, validating visitor access, maintaining access control records
- Workstation security: Implementing policies restricting workstation use to authorized individuals
- Device and media controls: Governing ePHI disposal, media re-use, accountability, and data backup/storage
Technical Safeguards protect ePHI through:
- Access controls: Unique user identification, emergency access procedures, automatic logoff, encryption and decryption
- Audit controls: Recording and examining activity in systems containing ePHI
- Integrity controls: Ensuring ePHI isn't improperly altered or destroyed
- Transmission security: Protecting ePHI transmitted over networks through encryption and integrity controls
Dashboard platforms satisfying these requirements through platform features reduce compliance burden on healthcare SaaS companies embedding analytics. Vendors should provide compliance documentation (security policies, audit reports, penetration test results) enabling customers to satisfy their own compliance obligations.
Multi-factor authentication stopped being optional in the 2025 HIPAA updates
Reliable authentication prevents unauthorized access. Multi-factor authentication (MFA) became HIPAA-required in 2025 updates. Dashboards should support MFA through SMS codes, authenticator apps, or biometric verification.
Single sign-on (SSO) integration simplifies authentication for healthcare SaaS platforms. Users authenticate once to your platform, receiving tokens enabling dashboard access without separate login. SSO reduces password fatigue and improves security by centralizing authentication controls.
Role-based access control (RBAC) ensures users only access data appropriate for their roles. Emergency physicians shouldn't see billing data; revenue cycle staff shouldn't access clinical notes; patients should only see their own records. RBAC systems map user roles to permissions, automatically enforcing access restrictions.
Attribute-based access control (ABAC) provides finer-grained security than RBAC. ABAC policies consider user attributes (role, department, location), resource attributes (patient assignment, data sensitivity), and environmental attributes (time of access, device security posture). ABAC enables complex policies like "physicians can access patient records for their assigned patients during working hours from hospital networks."
Encryption is required in transit and strongly recommended at rest
Encryption protects data confidentiality if unauthorized access occurs. HIPAA requires encryption during transmission and strongly recommends encryption at rest.
Encryption in transit protects data traveling between users' browsers and dashboard servers and between dashboard servers and data sources. TLS 1.2 or higher should encrypt all network traffic. Healthcare dashboards must reject older protocols (SSL, TLS 1.0, TLS 1.1) vulnerable to known attacks.
Encryption at rest protects data stored on disk. Database encryption, file system encryption, or application-level encryption prevents attackers accessing ePHI if they compromise database servers or backup media. AES-256 encryption provides strong protection meeting HIPAA requirements.
Encryption key management requires careful attention. Keys should be rotated periodically, stored separately from encrypted data, and protected through hardware security modules or cloud key management services for highest security.
HIPAA mandates the log, so the only question left is what it has to capture
HIPAA mandates recording system activity involving ePHI. Audit logs must capture:
- User authentication events: Successful and failed login attempts, logouts, session timeouts
- Data access events: Which users accessed which patient records, when, from what locations
- Data modification events: Changes to ePHI including who made changes and what values changed
- Configuration changes: Modifications to security settings, user permissions, system configurations
- Export/transmission events: Data downloads, report generation, data transfers to external systems
Logs must be tamper-evident and retained for at least 6 years per HIPAA requirements. Centralized log management systems aggregate logs from multiple systems, detect anomalous patterns indicating security incidents, and preserve logs against tampering.
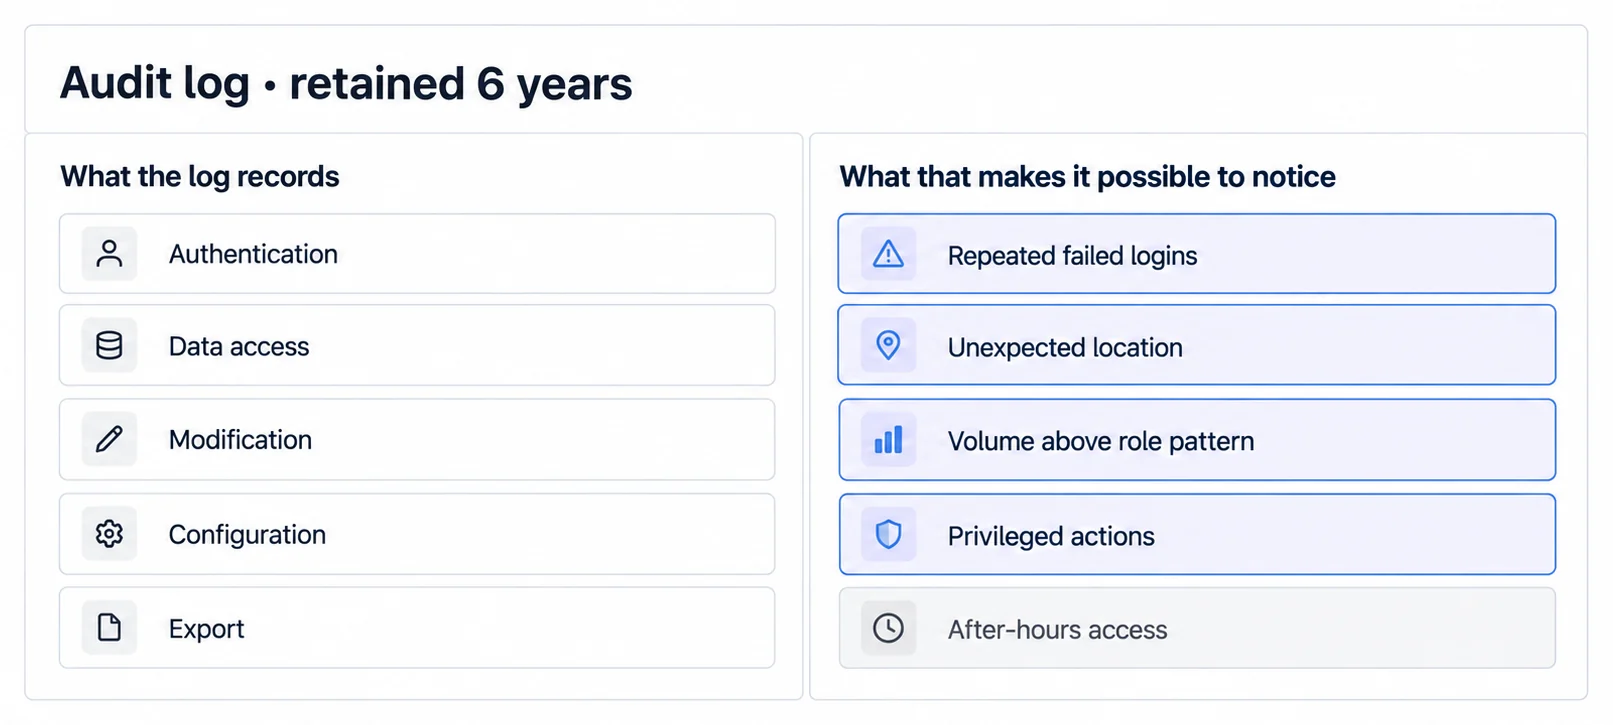
Log monitoring detects suspicious activity requiring investigation:
- Multiple failed login attempts: Potential credential guessing attacks
- Access from unusual locations: Users logging in from unexpected geographic locations
- After-hours access: Legitimate healthcare work occurs 24/7, but unusual patterns warrant scrutiny
- Access volume anomalies: Users accessing unusually large numbers of patient records
- Privileged action alerts: Activities requiring elevated permissions
A streaming connection stays open, which is a security surface a batch job never had
Real-time analytics create security challenges beyond batch-processed dashboards. Streaming data connections remain open continuously rather than executing discrete queries. Long-lived connections require token refresh mechanisms preventing session hijacking. Streaming protocols should encrypt data and authenticate both endpoints.
WebSocket connections enabling real-time dashboard updates should implement connection authentication, message-level encryption if data travels through untrusted intermediaries, and heartbeat mechanisms detecting connection failures.
Server-sent events (SSE) provide simpler unidirectional streaming than WebSockets. SSE connections should include authentication tokens in request headers and implement automatic reconnection with exponential backoff if connections drop.
Dashboards displaying real-time data should implement rate limiting preventing resource exhaustion attacks. Malicious actors shouldn't be able to overwhelm dashboard infrastructure by initiating thousands of streaming connections.
Tenant isolation has to hold at several levels at once, not only in the query
Healthcare SaaS platforms serving multiple customer organizations must prevent data leakage between tenants. Tenant isolation operates at multiple levels:
Network isolation separates tenant traffic through virtual private clouds, network segmentation, or firewall rules. Even if application-level isolation fails, network controls provide defense-in-depth.
Database isolation prevents cross-tenant data access. Separate databases or schemas per tenant provide strongest isolation but complicate infrastructure management. Shared databases require row-level security ensuring queries filter data by authenticated tenant identifier.
Application-level filtering adds tenant context to every database query. Object-relational mappers or database access layers automatically append WHERE clauses filtering results to the authenticated tenant. This approach requires careful implementation, developers can bypass filters through raw SQL, creating tenant isolation vulnerabilities.
Testing tenant isolation thoroughly prevents devastating security failures. Penetration testers should attempt accessing other tenants' data through URL manipulation, API parameter injection, and SQL injection. Security should fail closed, errors should deny access rather than accidentally granting access to wrong tenant's data.
Healthcare Dashboard Implementation Fails on Planning More Often Than on Technology
Successfully implementing healthcare dashboards requires careful planning across technical architecture, data integration, user experience, and change management. The following implementation framework guides healthcare SaaS companies from initial planning through production deployment.
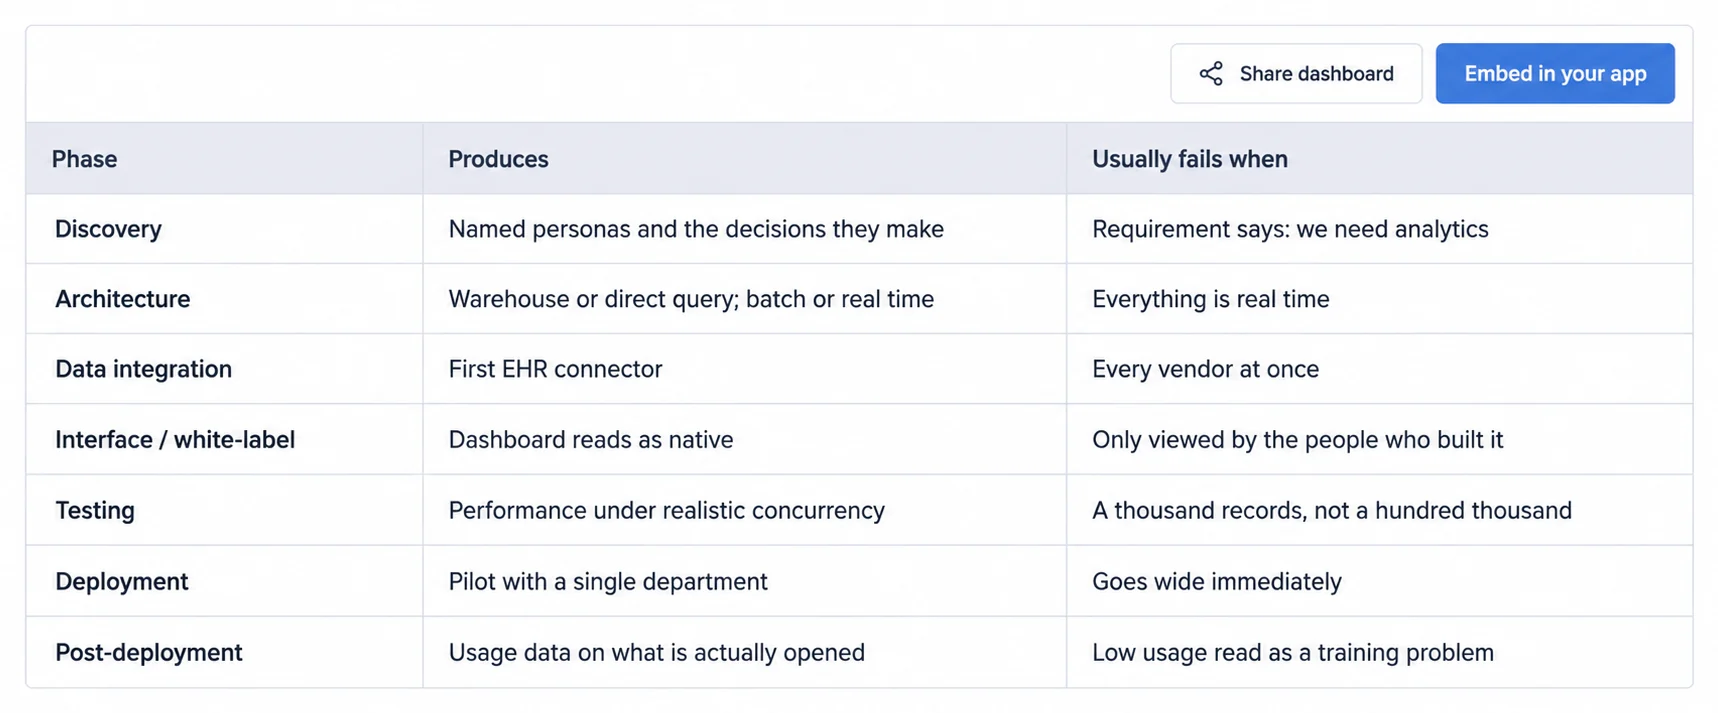
"We need analytics" is not a requirement, and discovery exists to replace it
Begin by understanding exactly what problems dashboards should solve. Generic requirements like "we need analytics" provide insufficient guidance. Effective discovery identifies:
User personas and their goals: Who will use dashboards? Emergency physicians need different analytics than revenue cycle directors. What decisions will each persona make using dashboard data? What questions do they need answered?
Key performance indicators: What metrics matter most to each persona? Clinical quality measures? Operational efficiency metrics? Financial performance indicators? Patient engagement scores?
Data sources and availability: What systems contain required data? Can you access those systems through APIs, database connections, or file exports? How frequently does data update, real-time, hourly, daily, monthly?
Existing workflows: How do users currently access information dashboards will provide? Do they run manual reports? Query databases directly? Call IT for data extracts? Understanding current workflows reveals integration points for new dashboards.
Compliance and security requirements: Beyond basic HIPAA requirements, do specific customers impose additional security controls? Do international customers require data residency in specific regions? What audit reporting do compliance teams need?
Document requirements clearly, prioritizing must-have capabilities versus nice-to-have features. Minimum viable product (MVP) should address core use cases without every possible feature. Additional capabilities can follow initial deployment based on user feedback and usage patterns.
Architecture choices set scalability, security and maintenance burden all at once
Dashboard architecture decisions affect scalability, performance, security, and maintenance burden. Key architecture choices include:
Data warehouse or direct source queries: Dashboards can query operational databases directly or pull data into dedicated analytics databases. Direct queries avoid data duplication but risk impacting source system performance. Data warehouses require ETL processes but enable complex analytics without affecting operational systems.
Healthcare implementations typically prefer data warehouses. Clinical and operational systems can't tolerate query loads from hundreds of dashboard users. Data warehouses also enable joining data from multiple sources (EHR, billing, lab, devices) into unified analytics datasets.
Batch versus real-time processing: Determine which dashboards require real-time updates versus scheduled refreshes. Clinical dashboards monitoring intensive care patients need real-time updates. Financial dashboards analyzing monthly revenue tolerate daily batch refreshes. Different refresh frequencies might apply to different sections of the same dashboard.
Real-time dashboards introduce complexity, streaming data pipelines, change data capture from source systems, message queues buffering updates. Implement real-time processing only where clinical or operational requirements justify the engineering investment.
Embedded versus separate platforms: Should dashboards render within your SaaS application or open in separate windows/tabs? True embedding provides smooth user experience but requires more sophisticated SDK integration. Separate windows simplify initial implementation but fragment user experience.
Healthcare users strongly prefer embedded dashboards maintaining single application context. Clinical workflows break when users must switch between EHR, your SaaS platform, and separate analytics tools. Embedded analytics implementation enables single-pane-of-glass experiences keeping users in flow.
Healthcare integration is mostly terminology mapping rather than transport
Healthcare data integration presents unique challenges, inconsistent data formats across sources, complex clinical terminology requiring mapping, varying refresh frequencies by data type.
EHR integration approach: FHIR APIs represent the modern standard but not all required data exists in FHIR resources yet. Legacy HL7 interfaces might be necessary for real-time clinical events. Direct database access occasionally provides only viable approach for historical data.
Plan for incremental integration. Start with one EHR vendor supporting your largest customer concentration. Expand to additional vendors based on customer demand. Building every possible EHR connector upfront delays launch and wastes engineering time on integrations few customers need.
Data quality and validation: Healthcare data arrives with inconsistencies, errors, and ambiguities. Patient names appear in different formats (LASTNAME, FIRSTNAME vs. Firstname Lastname). Dates might use different formats. Diagnostic codes shift between ICD-9 and ICD-10.
Implement data validation and normalization during ETL. Flag records with missing required fields. Standardize data formats before loading into analytics databases. Maintain audit trails showing source data and transformations applied.
Historical data backfill: New dashboard deployments often require loading historical data providing context for trend analysis. Backfilling years of historical clinical and financial data requires careful planning around source system query capacity, network bandwidth, data volume, and processing time.
Phase historical loads, load most recent 12 months initially, then incrementally load older history during off-peak hours. Prioritize historical data users actually need versus complete archives few will access.
The interface has to read as your product, or it reads as a bolt-on
Healthcare dashboard interfaces should match your SaaS platform's design language, not obviously appear as bolted-on third-party tools. White-label analytics customization requirements include:
Visual design alignment: Match color schemes, typography, button styles, spacing, and other design elements to your platform. Users should perceive dashboards as native features, not external embeds.
Branding elements: Replace vendor logos with yours. Ensure dashboard URLs use your domain rather than analytics vendor subdomains. Include your company name in browser tabs and email reports.
Terminology and language: Healthcare SaaS platforms serving specific specialties should use appropriate clinical terminology in dashboards. Cardiology platforms should reference ejection fractions, atrial fibrillation burden, and other cardiology-specific terms rather than generic "values" and "metrics."
Navigation integration: Dashboards should integrate into your application's navigation structure. Users shouldn't perceive distinct "analytics section", relevant dashboards should appear contextually where users need them.
Test white-label implementation thoroughly. View dashboards from customer perspectives, not just development environments. Customers will notice inconsistencies developers overlook after months viewing the same screens.
Testing here has to cover compliance as well as function
Healthcare dashboard testing must verify functionality, performance, security, and compliance.
Functional testing: Verify dashboards display correct data from test datasets. Validate filters, drill-downs, exports, and all interactive features. Test with multiple data scenarios, empty datasets, single records, large volumes, edge cases like patients with hundreds of encounters or lab results.
Performance testing: Measure query response times, page load times, and concurrent user capacity. Healthcare dashboards must perform acceptably under realistic loads. If 200 clinical users might access dashboards simultaneously during shift changes, test with 200+ concurrent sessions.
Performance often degrades non-linearly with data volume. Dashboards querying 1,000 patient records might perform excellently while the same queries against 100,000 patients time out. Test with production-scale data volumes.
Security testing: Penetration testing should attempt bypassing authentication, accessing unauthorized data, SQL injection, cross-site scripting, and session hijacking. Vulnerability scanning identifies common security flaws. Manual security review catches logic errors automated tools miss.
Compliance testing: Verify audit logging captures required events. Confirm encryption during transmission and at rest. Validate access controls prevent unauthorized access. Document security controls satisfying HIPAA requirements.
User acceptance testing: Healthcare end-users should test dashboards before production deployment. Clinical staff identify workflow integration issues developers won't notice. Billing staff catch terminology or logic errors in financial dashboards. Early user feedback prevents costly post-deployment changes.
Clinical systems cannot tolerate instability, so rollout is gradual by design
Healthcare organizations change technology cautiously. Clinical systems supporting patient care can't tolerate instability. Gradual rollout reduces risk:
Pilot deployment: Deploy dashboards to small user group first, single department, one facility, limited set of power users. Monitor usage, gather feedback, identify problems before broader rollout.
Phased expansion: Progressively expand user access, additional departments, more facilities, eventually full organization. Each phase validates stability under increasing load.
Training and support: Healthcare users need training on dashboard features, interpretation of metrics, and integration into workflows. Just-in-time training delivered shortly before users gain access proves more effective than training weeks in advance.
Provide multiple support channels, video tutorials for self-service learning, reference documentation for lookup, live training sessions for hands-on instruction, help desk for troubleshooting. Different users prefer different learning modalities.
Communication and change management: Users resist analytics platforms imposed without explanation. Communicate why dashboards matter, what problems they solve, how they improve workflows. Involve clinical champions, respected physicians or nurses advocating for analytics adoption.
Leadership visibility matters. When hospital executives actively use dashboards during meetings and reference dashboard metrics in decision-making, front-line staff recognize analytics as important rather than optional.
Deployment is where the work starts, not where it ends
Dashboard deployment isn't the end. It's the beginning of continuous improvement based on usage patterns and user feedback.
Usage analytics: Track which dashboards get accessed, which metrics users examine, which filters they apply, when they use dashboards. Usage patterns reveal what's valuable versus what's ignored.
Low usage might indicate dashboards solving wrong problems, poor integration into workflows, inadequate training, or performance problems discouraging use. Investigate reasons and address root causes.
Performance monitoring: Track query response times, page load times, error rates. Set up alerts notifying if performance degrades. Some performance problems only appear under production loads with real data volumes and usage patterns.
Iterative feature additions: Add capabilities based on user requests rather than guessing what users want. Dashboards should evolve responding to demonstrated needs rather than theoretical requirements.
Regular user feedback sessions: Schedule quarterly reviews with power users gathering feedback on current features, desired capabilities, workflow integration opportunities. Users become invested in platforms when their input shapes development.
The Healthcare Dashboard Stack Decides What You Operate, Not Just What You Buy
Understanding the technology components underlying healthcare dashboards helps healthcare SaaS companies make informed build-versus-buy decisions and evaluate vendor platforms effectively.
The backend carries authentication, query processing, caching and scheduling
Dashboard platforms require backend services handling authentication, data access, query processing, caching, and scheduling.
Database layer: Analytics databases optimized for read-heavy workloads differ from operational databases optimized for transactional writes. Column-oriented databases like Amazon Redshift, Google BigQuery, or Snowflake excel at aggregating large datasets. Time-series databases like InfluxDB or TimescaleDB optimize temporal healthcare data, vital signs, lab results, medication administrations.
Caching layer: Caching frequently accessed queries dramatically improves dashboard performance and reduces database load. Redis or Memcached cache query results in-memory. Caching must respect data sensitivity, cached clinical data shouldn't persist beyond user session expiration risking unauthorized access.
API layer: RESTful APIs or GraphQL endpoints provide data to frontend dashboard components. API-first analytics architectures separate data access from presentation, enabling multiple frontend experiences (web dashboards, mobile apps, embedded widgets) consuming the same backend APIs.
Query engine: SQL query engines translate user interactions into database queries. Query builders automatically generate SQL from filter selections, date ranges, and drill-downs. Query optimization identifies inefficient queries and suggests index improvements.
Job scheduling: Batch data refreshes, scheduled report generation, and automated data exports require job scheduling infrastructure. Airflow, cron jobs, or cloud scheduler services execute recurring tasks reliably.
The frontend is what turns the data into something a clinician can read at a glance
Dashboard user interfaces render in web browsers, requiring frontend frameworks translating data into visual representations.
Charting libraries: D3.js provides low-level control over visualizations but requires extensive custom code. Higher-level libraries like Recharts, Victory, Chart.js, Highcharts, or ECharts offer pre-built chart types requiring less development effort. Our React chart libraries guide compares popular options.
Component frameworks: React, Vue, or Angular structure dashboard applications. React's component model and ecosystem make it the most common choice for modern dashboard development. Component-based architecture enables reusable chart components, filter widgets, and layout templates.
State management: Complex dashboards tracking filter selections, drill-down state, and user interactions benefit from state management libraries, Redux, MobX, Zustand. State management prevents spaghetti code as dashboard complexity grows.
Responsive design: Healthcare dashboards must function on desktops, tablets, and smartphones. Responsive design frameworks like Bootstrap or Material-UI provide mobile-friendly components and grid systems. CSS frameworks like Tailwind enable custom responsive designs.
Data fetching: Frontend applications fetch data through AJAX requests to backend APIs. Libraries like React Query or SWR handle caching, request deduplication, background refetching, and error handling.
Several embedding patterns exist, and the choice decides what you still own
Healthcare SaaS companies embedding analytics into their products choose from several integration patterns:
iFrame embedding: Simplest approach, render dashboard URLs in iFrames within your application. iFrames isolate dashboard code from your application, preventing style conflicts. However, iFrames create integration challenges, cross-origin restrictions, sizing difficulties, authentication token passing complexity.
iFrame embedding works adequately for simple use cases but falls short for smooth integration. Users perceive iFramed dashboards as separate tools rather than native features.
SDK integration: Dashboard platforms providing JavaScript SDKs enable deeper integration. SDKs render dashboards as native application components, accepting authentication tokens, filter parameters, and styling configuration through JavaScript APIs.
SDK approaches produce superior user experiences, dashboards appear fully integrated, share application state, and style consistently. However, SDK integration requires more development effort than iFrame embedding.
Component libraries: Most sophisticated embedding approach, dashboard platforms provide React/Vue/Angular component libraries your team imports and composes alongside your own components. This approach provides maximum flexibility and integration depth but requires larger engineering investment.
Our React dashboard components analysis explores best practices for component-based analytics integration.
Security here spans several layers, so no single control covers it
Healthcare dashboard security spans multiple technology layers:
SSL/TLS certificates: HTTPS encryption requires valid SSL certificates. Let's Encrypt provides free certificates with automated renewal. Commercial certificate authorities offer extended validation certificates providing visual trust indicators in browsers.
Identity providers: Healthcare organizations increasingly use single sign-on through SAML 2.0 or OpenID Connect protocols. Dashboard platforms must integrate with identity providers like Okta, Azure Active Directory, or OneLogin.
Web application firewalls: WAFs filter malicious traffic before it reaches application servers. Cloud WAFs like Cloudflare, AWS WAF, or Azure WAF block common attacks, SQL injection, cross-site scripting, distributed denial of service.
Vulnerability scanning: Regular scanning identifies security weaknesses. OWASP dependency checking detects vulnerable libraries. Static code analysis flags potential security bugs. Dynamic scanning tests running applications for vulnerabilities.
Embedded Pricing Models Meet a Healthcare Customer Count You Are Trying to Grow
Healthcare SaaS companies evaluating embedded analytics platforms encounter diverse pricing structures affecting total cost of ownership and business model economics.
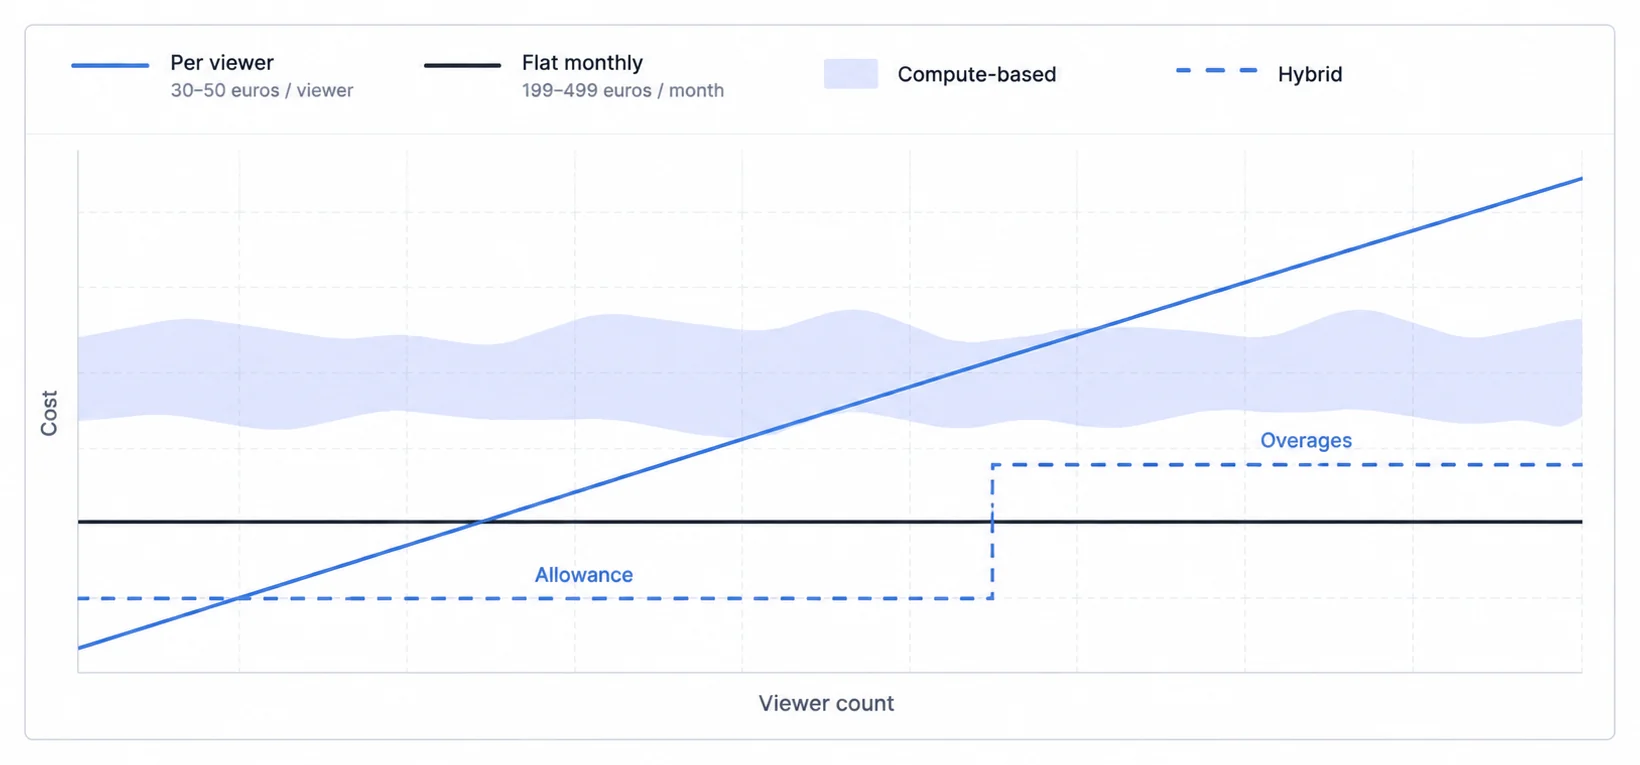
Per-viewer pricing turns every new clinician into a line on the invoice
Per-viewer models charge based on number of users accessing dashboards monthly. Typical pricing: €30-€50 per viewer. This model creates problematic economics for healthcare SaaS companies with high user counts.
If your SaaS platform charges €200 per user monthly while analytics vendors charge €40 per viewer, analytics costs consume 20% of revenue. As customer bases grow to thousands of users, cumulative viewer fees become prohibitive.
Healthcare SaaS companies with low viewer counts, platforms serving small hospitals with 20-50 administrative users, might find per-viewer pricing acceptable. However, platforms serving hundreds to thousands of clinical users quickly hit economic constraints.
Per-viewer pricing creates perverse incentives limiting analytics access to preserve margins. Healthcare organizations benefit from broad analytics access, but per-viewer fees encourage healthcare SaaS companies restricting access to control costs.
A flat fee buys predictability, which is exactly what a growing viewer count destroys
Flat-fee models charge fixed monthly amounts regardless of usage. Sumboard's €199-€499 monthly pricing typifies this approach. Flat fees provide cost predictability and superior economics at scale.
Healthcare SaaS companies can offer unlimited analytics access without per-user fees cascading to customers. This aligns analytics business model with healthcare value, broad access improves clinical decisions, operational efficiency, and patient outcomes.
Flat-fee vendors manage costs by setting feature caps rather than user limits, maximum dashboard count, query volume limits, data refresh frequencies. These constraints rarely bind healthcare SaaS companies with typical use patterns.
Compute pricing bills the query, so the refresh rate becomes a cost decision
Cloud data warehouses like Snowflake or BigQuery charge based on query compute consumption. Users pay for CPU cycles executing queries and storage for maintaining data. Costs vary with data volume and query complexity.
Compute-based pricing provides extreme flexibility, organizations only pay for what they use. However, cost predictability suffers. Query patterns vary month-to-month. Complex dashboards executing expensive queries can generate surprise bills.
Healthcare organizations with sophisticated analytics teams understanding query optimization can manage compute costs effectively. Smaller organizations lacking expertise might struggle controlling costs or over-provision capacity paying for unused compute to avoid performance problems.
Hybrid models combine a base fee with usage, so both meters have to be read
Some platforms combine base fees with usage-based components. €500 monthly base fee might include 100,000 query executions, 1 TB data storage, and 10 dashboards. Overages incur incremental charges.
Hybrid models balance predictability with scalability. Base fees cover typical usage; variable components prevent excessive costs from one large customer subsidizing others. However, hybrid models introduce complexity, organizations must monitor usage and predict overage charges.
A platform comparison only settles once you total three to five years
Comparing platform pricing requires calculating 3-5 year total cost of ownership including:
- License fees: Monthly or annual subscription costs
- Implementation costs: Integration development, data pipeline construction, initial dashboard creation
- Training and change management: User training, documentation creation, adoption programs
- Ongoing maintenance: Dashboard updates, new data source connections, performance optimization
- Infrastructure costs: Data warehouse costs, data transfer fees, backup storage
Build-versus-buy analysis should compare these complete costs rather than initial pricing alone. In-house builds might appear cheaper initially but accumulate substantial ongoing costs, engineering time maintaining infrastructure, feature additions responding to user requests, security updates addressing vulnerabilities.
What Is Changing in Healthcare Analytics, Sorted by What You Must Buy First
Healthcare analytics continues evolving, driven by advancing technology, changing payment models, and rising patient engagement expectations. Healthcare SaaS companies should anticipate these trends when building or selecting dashboard platforms.
AI moves the dashboard from what happened to what is about to
Artificial intelligence increasingly augments clinical dashboards with predictive insights and automated decision support. Rather than merely displaying historical data, AI analytics platforms predict future events and recommend interventions.
Sepsis prediction models analyze vital signs, lab results, and clinical notes, identifying patients at risk of developing sepsis hours before obvious clinical manifestation. Early identification is what makes preventive intervention possible at all. We are not quoting a mortality reduction: that is a clinical outcome, the figure would need a specific trial behind it, and we could not link one. Dashboards incorporating sepsis risk scores alert clinicians to high-risk patients requiring immediate evaluation.
Readmission risk models predict which patients face highest likelihood of returning to hospitals within 30 days after discharge. Hospitals target post-discharge support programs, home health visits, medication reconciliation, follow-up phone calls, toward high-risk patients, reducing readmissions cost-effectively.
AI-powered analytics will expand beyond risk prediction into automated insight generation. Rather than clinicians manually reviewing thousands of patients identifying patterns, AI surfaces anomalies and trends warranting attention. "Dr. Smith's diabetic patients show higher average glucose levels this quarter compared to last quarter" or "Emergency department wait times spiked 40% on Tuesdays after nurse staffing changes."
Natural language query removes the filter interface, not the data model behind it
Natural language query (NLQ) enables users to ask questions in plain English rather than working through complex filter interfaces. "Show me heart failure patients admitted in the last 30 days with readmission risk scores above 70%" generates appropriate dashboards without users manually configuring filters and parameters.
NLQ dramatically expands dashboard accessibility. Non-technical users (physicians, nurses, administrators) can explore data without training on query interfaces. This democratizes analytics, enabling broader organizational use rather than limiting dashboards to analysts.
Conversational interfaces extending NLQ support multi-turn dialogues. Users refine queries through follow-up questions: "Now break that down by attending physician" or "How does this compare to last year?" Conversational analytics feels more natural than traditional BI tool interactions.
Patient-generated data arrives from outside the health system entirely
Wearables, smartphone apps, and home monitoring devices generate continuous streams of patient data outside traditional healthcare settings. Apple Watch detects atrial fibrillation. Glucose meters transmit readings to diabetes management platforms. Sleep trackers monitor sleep apnea treatment adherence.
Healthcare dashboards increasingly incorporate patient-generated health data (PGHD) alongside clinically-collected data. Clinicians viewing complete patient timelines see:
- Clinical encounters: Office visits, hospitalizations, emergency visits
- Laboratory results: Blood tests, imaging, pathology
- Medication administration: Hospital medication records, pharmacy fill data
- Patient-reported data: Symptoms, pain levels, quality of life
- Device-generated data: Vital signs, activity levels, sleep patterns
Integrating PGHD creates technical challenges, data arrives from hundreds of device types and apps, data quality varies widely, clinical workflows must accommodate continuous data streams rather than periodic snapshots. However, PGHD provides context missing from episodic clinical encounters. Physicians seeing weekly glucose patterns make better diabetes management decisions than physicians reviewing single glucose values during quarterly office visits.
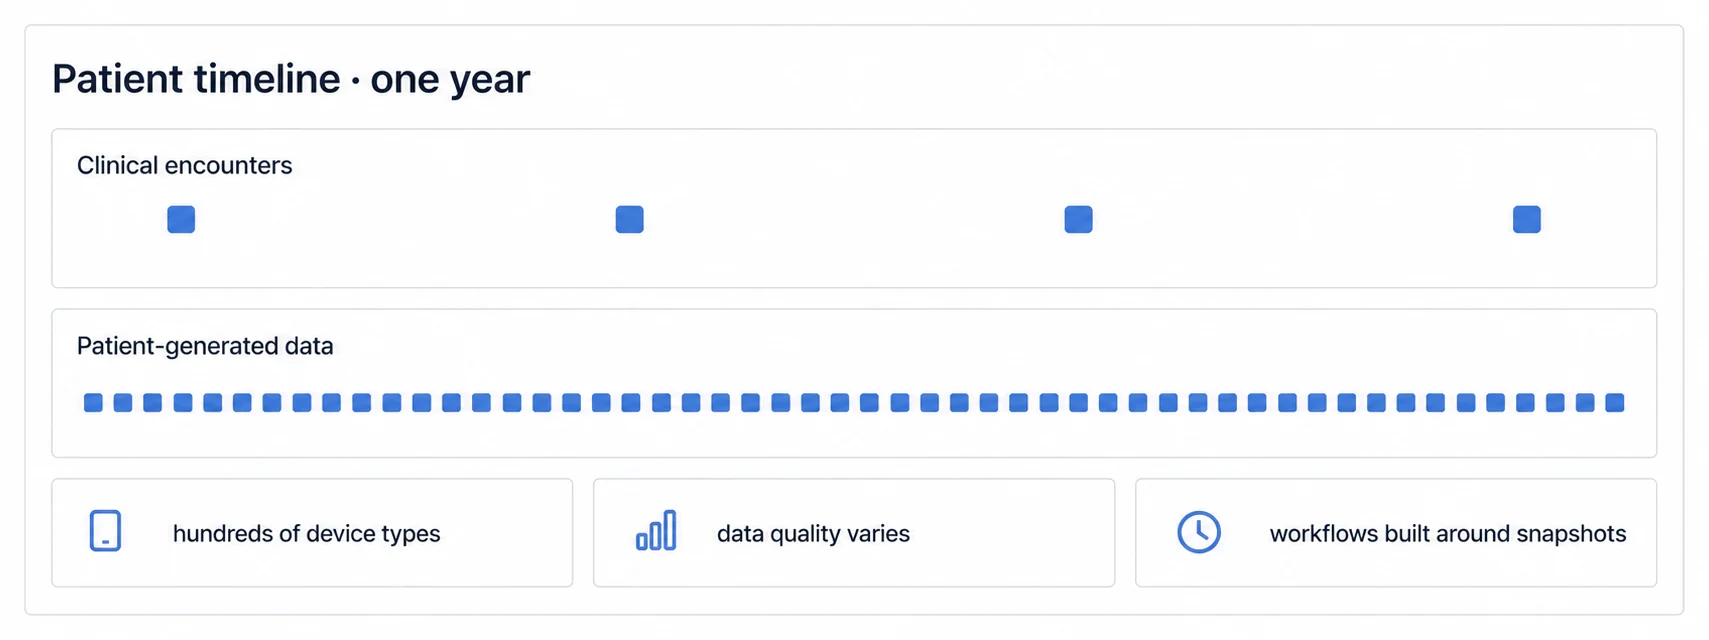
Value-based contracts change which numbers the organisation is paid on
Healthcare payment models shifting from fee-for-service to value-based contracts (accountable care organizations, bundled payments, capitation) create demand for population health analytics extending beyond individual encounters.
Value-based dashboards track:
- Population health metrics: Percentage of diabetic patients achieving glucose control, hypertension patients reaching blood pressure targets, cancer screening rates
- Care gaps: Patients overdue for preventive services, recommended screenings, chronic disease monitoring
- Cost efficiency: Total cost of care per patient, resource utilization patterns, variation in treatment approaches
- Quality measures: Core measure performance, patient safety indicators, patient satisfaction scores
Healthcare organizations succeed in value-based contracts by identifying high-risk, high-cost patients early and providing proactive interventions preventing expensive complications. Dashboards enabling sophisticated population health management become strategic assets rather than nice-to-have analytics.
Outcomes track housing, food and transport as closely as they track treatment
Healthcare outcomes correlate strongly with social determinants, housing stability, food security, transportation access, social support networks. Clinical treatment addresses only part of health; social circumstances often drive health trajectory more than medical interventions.
Progressive healthcare organizations screen patients for social determinants and incorporate results into care planning. Dashboards visualizing social determinants help care teams:
- Identify resource needs: Patients with food insecurity, transportation barriers, housing instability
- Connect patients with services: Community resources, social services, assistance programs
- Measure intervention effectiveness: Whether addressing social determinants improves health outcomes
- Understand health disparities: How social determinants correlate with health outcomes across populations
Dashboards might highlight that diabetic patients with food insecurity achieve worse glucose control than financially stable patients. This insight prompts interventions addressing food access alongside diabetes medication adjustments.
Healthcare data is still fragmented, and every dashboard inherits that constraint
Healthcare data remains fragmented across disconnected systems, hospital EHRs, ambulatory practice EHRs, laboratory systems, pharmacy systems, insurance claims, wearable devices. Creating complete patient views requires aggregating data from dozens of sources.
The 21st Century Cures Act and ONC interoperability rules mandate standardized data access through FHIR APIs. Healthcare dashboards will increasingly use FHIR to aggregate multi-source data without requiring custom integration with each source system.
Health information exchanges (HIEs) facilitate data sharing across organizations. Regional or statewide HIEs aggregate data from multiple healthcare systems, enabling dashboards displaying patient encounters across providers. A patient visiting three different hospital systems generates fragmented data; HIE-connected dashboards unify that data into complete longitudinal records.
In a crowded healthcare SaaS market, analytics is one of the few visible differences
Healthcare SaaS markets grow increasingly competitive. EHR vendors, specialized clinical decision support tools, revenue cycle management platforms, patient engagement platforms, dozens of vendors compete in each category.
Analytics capabilities increasingly differentiate winners from also-rans. Healthcare organizations choosing between functionally similar platforms favor vendors providing superior analytics. Sophisticated dashboards signal platform maturity, data quality, and ongoing product investment.
Healthcare SaaS companies embedding professional analytics gain competitive advantages in sales cycles, customer retention, and expansion revenue. Customers value platforms eliminating needs for separate analytics tools. Single-platform solutions reduce total cost of ownership and simplify workflows compared to point solutions requiring constant application switching.
Choose a Healthcare Dashboard Solution on the Compliance Boundary You Can Actually Hold
Healthcare SaaS companies must make strategic decisions about analytics capabilities, whether to build custom dashboards, embed third-party platforms, or pursue hybrid approaches. The right choice depends on your product strategy, technical capabilities, timeline constraints, and long-term vision.
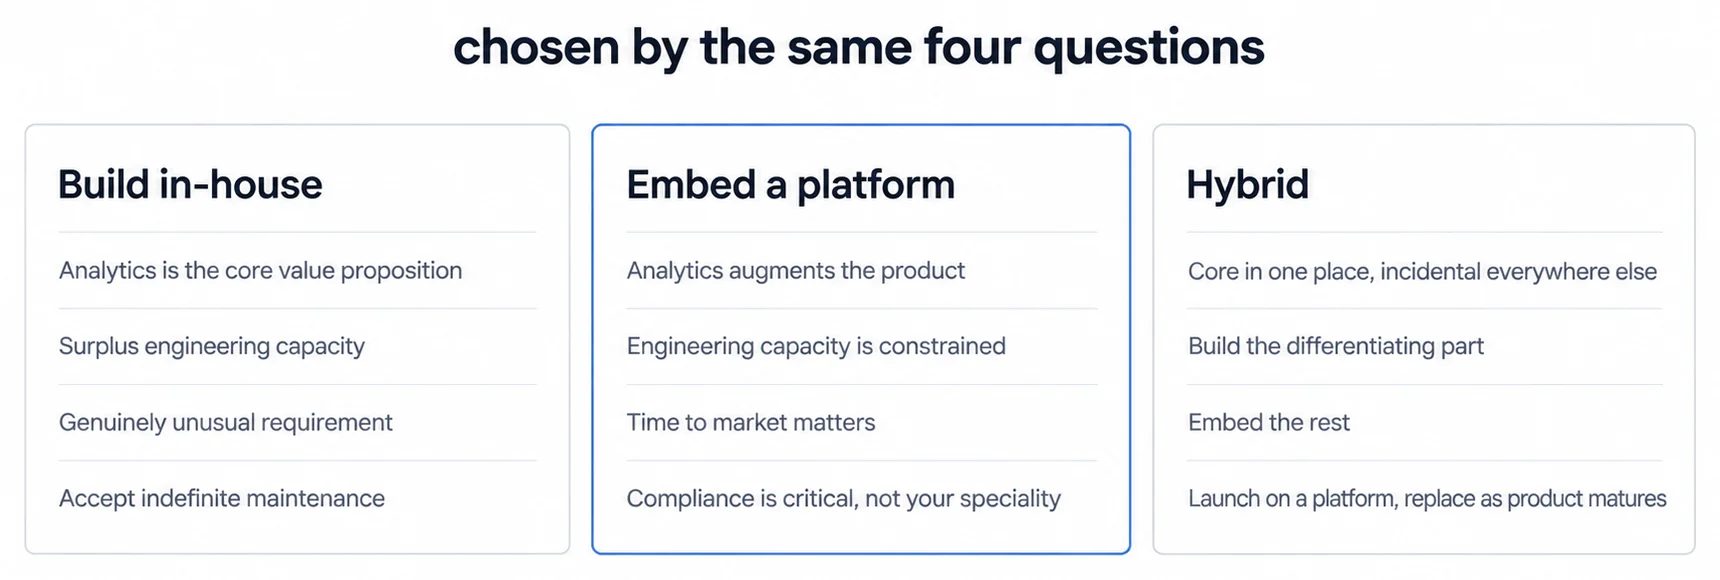
When to Build In-House
Building healthcare dashboards in-house makes sense when:
Analytics differentiates your core product. If your SaaS platform's primary value proposition centers on analytics, clinical decision support platforms, population health management tools, revenue cycle intelligence, then analytics justifies significant engineering investment. Deep customization and proprietary algorithms might create competitive moats justifying build costs.
You have surplus engineering capacity. Teams with available engineering resources and extended timelines can build analytics infrastructure without derailing other priorities. However, most healthcare SaaS startups face engineering constraints and aggressive product roadmaps, making the "surplus capacity" scenario rare.
Standard platforms can't satisfy unique requirements. Some use cases demand capabilities embedded platforms don't provide, proprietary machine learning models, extremely specialized visualizations, novel interaction patterns. If you've thoroughly evaluated available platforms and confirmed they can't meet needs, custom development might be necessary.
You're prepared for long-term maintenance commitments. In-house builds become your team's responsibility forever. Security updates, browser compatibility, new feature development, bug fixes, all require ongoing engineering attention. Organizations embracing this indefinite commitment can build successfully. Organizations underestimating maintenance burden regret build decisions years later.
When Embedded Platforms Win
Modern embedded analytics platforms like Sumboard provide superior outcomes for most healthcare SaaS companies when:
Analytics augments rather than defines your product. If analytics represents one of many features, telemedicine platforms, EHR extensions, care coordination tools, then embedded platforms accelerate delivery without requiring extensive engineering investment. Focus engineering resources on features differentiating your product.
Time-to-market matters. Competitive markets reward fast movers. Healthcare SaaS companies using embedded analytics ship features in days or weeks rather than quarters or years, potentially winning competitive deals where analytics becomes a deciding factor.
Engineering resources are constrained. Small teams can't afford dedicating multiple engineers to analytics infrastructure for 6-12 months. Embedded platforms multiply small team productivity, enabling complete analytics without proportional engineering headcount.
You need complete features quickly. Embedded platforms provide professionally-built capabilities out-of-box, scheduled reports, mobile responsiveness, white-label customization, export functionality, drill-downs. Building equivalent features in-house extends timelines substantially.
Predictable costs matter. Platforms with flat-fee pricing (like Sumboard's €199-€499 monthly) provide cost predictability. Per-viewer pricing creates economic challenges as user counts scale, but flat-fee models remain affordable even serving thousands of dashboard users.
Compliance is critical but not your specialty. HIPAA compliance requires ongoing effort, security updates, penetration testing, audit logging, compliance documentation. Embedded platforms make compliance their responsibility, reducing your burden. However, you still share compliance obligations, choose vendors demonstrating strong compliance programs with SOC 2 certifications and willingness to sign Business Associate Agreements.
Blending build and buy works when each side owns a different part of the surface
Some healthcare SaaS companies blend approaches:
Basic internal dashboards plus embedded advanced analytics. Build simple operational dashboards for internal use while embedding sophisticated customer-facing analytics. This balances engineering capacity constraints against desire for some custom capabilities.
Phased transition. Launch with embedded platform achieving fast time-to-market, then gradually replace vendor dashboards with custom builds as product matures and engineering resources expand. This approach mitigates time-to-market risk while maintaining long-term flexibility.
White-label analytics platform with custom extensions. Use embedded platforms for standard dashboard infrastructure while building custom visualizations or workflows addressing unique requirements. Platform SDKs often support custom components extending baseline capabilities.
An evaluation framework is what keeps the comparison honest across vendors
When evaluating embedded analytics platforms for healthcare applications, systematically assess:
Security and compliance capabilities: Does the vendor provide SOC 2 reports? Will they sign a Business Associate Agreement? Do they maintain HIPAA-compliant infrastructure? What security controls exist for multi-tenancy, encryption, audit logging, authentication?
Integration flexibility: Can the platform connect to your data sources, EHR systems, billing platforms, lab systems? Does it support FHIR, HL7, or custom APIs? How does data refresh, real-time, hourly, daily?
Customization depth: Can you white-label dashboards matching your product's design? Can you embed smoothly or only through iFrames? Can you extend capabilities with custom components?
Pricing model sustainability: Will costs remain affordable as your customer base scales? Do per-viewer fees create economic problems? Are flat-fee models available? What happens at 1000 customers? 10,000 viewers?
Developer experience quality: Is documentation complete? Are SDKs available for your technology stack? Does the vendor provide good technical support? Can you complete proof-of-concept integrations successfully?
Performance and reliability: What query response times should you expect? What uptime SLAs does the vendor commit to? How many concurrent users can the platform support?
Four Healthcare Implementation Scenarios, With Their Assumptions Left Visible
The walkthroughs below are constructed scenarios. They illustrate how a rollout is structured and which trade-offs a team weighs; the companies, timelines and figures in them are assumptions of the scenario rather than measured results, and the only price stated is one you can check on a published page. Treat every outcome as a hypothesis to instrument against your own data, not as a benchmark for your sector.
A practice management platform serving 400 clinics needed revenue cycle analytics
A medical practice management SaaS platform serving 400 outpatient clinics needed financial analytics helping clinic administrators monitor revenue cycle performance. The platform already provided basic scheduling, billing, and patient management functionality but lacked complete reporting.
The product team considered building dashboards in-house but recognized several challenges. Their engineering team consisted of 5 developers focused on core product features, scheduling optimization, patient communications, payment processing. Dedicating 2 engineers to dashboard development for 8-12 months would delay other roadmap priorities.
The team evaluated embedded analytics platforms, prioritizing HIPAA compliance, white-label capabilities, and billing data integration. They selected an embedded platform offering flat-fee pricing independent of viewer counts, since clinic administrators accessing dashboards would number in the thousands.
Implementation took 6 weeks, 2 weeks architecting data pipelines extracting billing data into analytics database, 2 weeks configuring initial dashboard templates, 2 weeks white-label customization and user testing. The platform launched dashboards showing claims denial rates, days in accounts receivable, collection percentages, and payer mix analysis.
Clinic administrators immediately identified actionable insights. Several clinics discovered denial patterns, specific procedure codes consistently rejected by certain payers due to documentation deficiencies. Addressing these patterns reduced denial write-offs by 1.5% annually, representing €45,000 revenue recovery for a mid-sized clinic processing €3 million annually.
The SaaS platform added analytics to their marketing materials, emphasizing revenue cycle optimization capabilities. Sales teams reported analytics became a competitive differentiator, competing platforms offered billing functionality but lacked sophisticated analytics helping clinics improve financial performance.
A patient monitoring platform needed status across hospital units, not one patient at a time
A hospital patient monitoring SaaS platform tracking vital signs and alerting nurses to abnormal values needed dashboards displaying patient status across hospital units. Intensive care units, medical-surgical floors, and emergency departments each required different dashboard views prioritizing relevant metrics.
The clinical team specified rigid requirements around real-time data updates, dashboards must refresh vital signs every 30 seconds to support clinical decision-making. Delayed data created patient safety risks. The platform also needed mobile optimization, since nurses primarily accessed monitoring systems from tablets and smartphones during patient rounds.
The product team initially attempted building dashboards using an open-source charting library. After 4 months, they'd created basic dashboards but struggled with real-time data streaming, mobile responsiveness, and white-label customization. Engineering estimates suggested 8-10 additional months reaching production quality.
Recognizing build complexity exceeded initial expectations, leadership evaluated embedded analytics platforms specifically emphasizing real-time capabilities and mobile optimization. They found platforms supporting WebSocket-based streaming updates and mobile-responsive designs.
The team migrated to an embedded platform over 6 weeks. Real-time vital sign charts, patient census displays, and alert dashboards replaced in-house prototypes. Nurses reported the new dashboards loaded faster and worked better on tablets than the internal build.
Post-deployment analysis revealed the embedded platform cost €499 monthly versus €200,000 estimated cost completing the in-house build plus ongoing €60,000 annual maintenance. The platform freed engineering resources returning to core product features, improving alarm algorithms, integrating additional monitoring devices, enhancing nurse notification systems.
A remote monitoring startup had to aggregate three home devices into one view
A remote patient monitoring startup serving heart failure patients needed dashboards aggregating data from home weight scales, blood pressure monitors, and symptom surveys. Cardiologists monitored patient panels ranging from 50 to 500 patients each, requiring efficient interfaces identifying patients with concerning trends.
The 3-person engineering team lacked bandwidth for complete dashboard development. The startup needed analytics capabilities quickly to secure pilot programs with three hospital systems evaluating the platform. Hospital cardiologists explicitly requested dashboards showing patient risk stratification, trend analysis, and alert prioritization.
The team selected an embedded analytics platform with flat-fee pricing fitting the startup's limited budget. Implementation focused on minimum viable dashboards addressing hospital requirements, patient lists sortable by risk score, individual patient trends showing weight and blood pressure patterns, alert queues highlighting patients needing immediate attention.
The startup deployed dashboards within 3 weeks, meeting hospital pilot timelines. Patient analytics dashboard capabilities became central to the platform value proposition, differentiating the startup from competitors offering device connectivity but minimal analytics.
Cardiologist dashboards aggregated data across their entire patient panels, showing population health metrics and identifying systematic problems. One cardiologist discovered that patients prescribed a particular medication combination consistently showed blood pressure spikes, prompting treatment protocol modification. This population-level insight wasn't visible when reviewing individual patient charts sequentially but became obvious when visualized across the entire panel.
The RPM platform initially attempted building dashboards in-house but abandoned development after 8 months when they'd completed only basic functionality and were encountering scaling problems with their multi-tenant architecture. Switching to an embedded analytics platform reduced time-to-production to 3 months and significantly reduced ongoing maintenance burden. The RPM company's product team refocused on their core competency (device integration and clinical algorithms) rather than maintaining dashboard infrastructure.
A healthcare CRM serving 30 hospital systems needed to show whether its messages worked
A healthcare CRM platform serving 30 hospital systems needed analytics helping hospitals understand patient engagement patterns and communication effectiveness. The platform provided both customer-facing dashboards embedded in hospital admin interfaces and internal business intelligence dashboards for the CRM company's own operations team.
Patient journey dashboards trace the path from first marketing touchpoint through scheduling, attendance and ongoing care. The value sits at the breaks in that path. A request that never becomes a booking points at the scheduling process rather than at demand, and a booking made weeks ahead behaves differently from one made for next week. Both are measurable on a hospital's own data, and neither has a published rate worth borrowing, because the shape depends on catchment, specialty mix and the booking system in use.
Communication effectiveness analytics compares channels on the same cohort. The question worth answering is which channel produces a confirmation rather than which one produces a delivery, because the gap between those two is usually where the reminder budget goes. Preferred language is the same kind of question: whether patients contacted in their own language engage more is obvious to state, rarely instrumented, and entirely measurable. What either split is for a given patient population is not something another hospital's number can settle.
Campaign performance dashboards helped hospital marketing teams understand which patient acquisition strategies generated highest ROI. Digital advertising, community health fairs, physician referrals, and patient word-of-mouth all showed different cost-per-acquisition and patient lifetime value. Hospitals used these insights to optimize marketing spend, doubling down on effective channels while curtailing underperforming initiatives.
The CRM platform chose white-label embedded analytics specifically because their hospital customers needed dashboards reflecting each hospital's brand identity rather than the CRM vendor's branding. The platform reported that white-label capability became a frequent sales competitive advantage, competing CRM solutions offered analytics, but branded dashboards that looked foreign within hospital systems created user resistance.
Ship healthcare analytics faster with Sumboard
Join healthcare SaaS companies embedding customer-facing dashboards in days instead of months. Focus on your core product while we handle the analytics infrastructure.