White-label analytics means your customers never discover the platform underneath. The part that decides it is not the dashboard, because the dashboard is the one touchpoint every demo shows you working. It is the artefacts that leave your product: PDF exports, scheduled emails, and the login screen. Those reach your customer's own stakeholders, which is where a third-party brand costs you the most. On price, most of this category publishes nothing, so compare the meters rather than the numbers, and avoid per-user licensing for anything customer-facing.
White-label analytics is software that lets you offer data dashboards and reports under your own brand, with no visible vendor attribution. Your customers see your logo, colors and branding throughout the analytics experience, as if you built everything yourself.
This is not about swapping a logo. True white-label means your customers never discover the underlying platform: when they open a dashboard, receive an email report, or export data, all of it looks and behaves like a native part of your product.
For a SaaS product that matters commercially rather than aesthetically. Analytics that visibly belongs to somebody else reads as a bolted-on third-party tool, and it undermines the positioning you are charging for. If you are still working out the wider picture, start with the guide to embedded analytics and the customer-facing analytics guide.
White-label and embedded analytics get used interchangeably and are not the same thing
These two get used interchangeably and they are not the same thing.
Embedded analytics is the how. The technical integration of analytics into your product: connecting data sources, rendering visualizations, handling authentication.
White-label analytics is the whose. Branding control: removing vendor logos, customizing the visual experience, making sure your brand is the only one present at every touchpoint.
The relationship is one-directional. Most white-label solutions are also embedded, because the analytics live inside your product. But plenty of embedded solutions are not white-label, because somewhere in them is a "Powered by" badge.
Where the branding actually breaks
The depth of white-labeling varies enormously between platforms, and it varies in a specific direction. Four questions separate partial from full:
- Vendor attribution. Can you remove every "Powered by" logo, footer and badge?
- PDF branding. Do exported reports carry your brand, or the vendor's?
- Email reports. Do scheduled emails come from your domain, using your templates?
- UI customization. Can you match your exact colours, fonts and styling, or only pick from a palette?
| Touchpoint | Embedded only | Full white-label |
|---|---|---|
| Vendor logo | Visible, "Powered by X" | Absent |
| Colours and fonts | Limited palette | Full theme control |
| PDF exports | Vendor-branded | Your brand on every page |
| Email reports | Vendor templates, vendor domain | Your email, your design |
| Login experience | May show vendor UI | Continuous with your app |
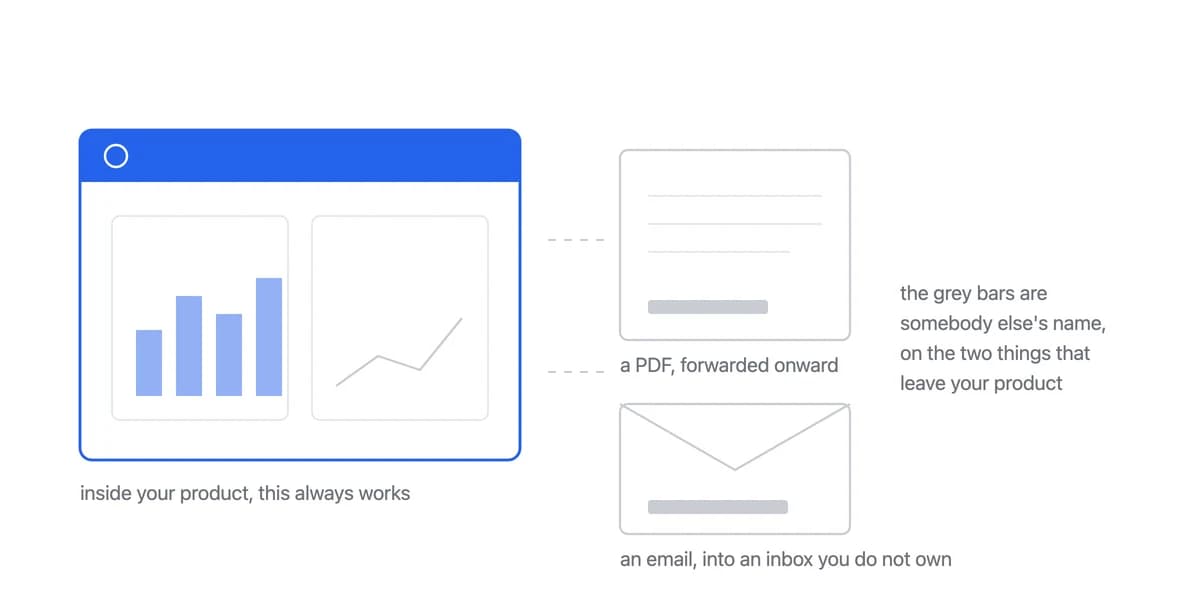
The pattern in that table is the useful part. The dashboard is the touchpoint that always works, because it is the one the demo is built around. The three that fail are the outbound ones, and outbound is exactly where the damage lands: a PDF gets forwarded to your customer's board, a scheduled email arrives in their finance team's inbox. Those artefacts travel to people who have never seen your product, carrying somebody else's name.
Before committing to any platform, ask for a branded PDF export and a branded email rendered with your actual logo and colours. Many tools have customization limits that a live dashboard demo will never reveal, because the dashboard is the part that works everywhere.
When embedded-only is enough
For internal dashboards, or where customers expect and accept a third-party tool, plain embedding is fine. Your own team does not care whose logo is in the corner.
When white-label is essential
When the analytics are customer-facing and brand perception is part of what you charge for, which for most SaaS products is always.
The two levels, and the question that decides between them
Level 1, visual. Logo customization, colour theme selection, limited font choices. Not included: full theme control, branded PDF exports, custom email templates. Best for internal dashboards.
Level 2, complete. Everything in level 1, plus full colour and font control, branded PDF exports, branded email templates, white-labeled client portals, and no vendor attribution anywhere. Best for customer-facing products.
The concrete difference: at level 1 your logo sits on the dashboard header while PDF exports still carry the vendor's footer and email reports arrive from [email protected]. At level 2, every PDF your customers receive looks like your design team made it.
Why it matters commercially
Brand consistency. Every "Powered by" badge invites a question you would rather not have asked: is this company really building their own technology, who else has access to my data, why am I paying premium prices for repackaged software. Enterprise buyers have seen enough software to recognise a third-party add-on, and that recognition affects what they think your product is worth. It is a common enough pattern that deals stall in security review or procurement over exactly this, and the buyers are not being difficult, they are doing their job.
Positioning. Across the platforms compared below, full white-label is consistently the thing gated behind a higher tier. That is an observation about how this category prices itself rather than a claim about what it will do to your own pricing, and it tells you something: the vendors have concluded that branding depth is what buyers will pay for.
Stickiness. When customers depend on dashboards carrying your identity, switching means abandoning what feels like their own analytics environment: the dashboards they built, the email schedules they configured, the PDFs they have circulated to stakeholders, the historical comparisons, the team access. Three of those five are artefacts already outside your product, sitting in inboxes and shared drives belonging to people who do not use your product. That is the part of the switching cost you cannot see in your own usage data, and it is also the part that only exists if the branding held.
For SaaS, white-label is not about reselling but about reading as a native feature
White-label analytics for SaaS is not about reselling. It is about making analytics read as a native product feature.
If your analytics section looks like an add-on, with different UI patterns, visible vendor branding and inconsistent design, it undermines the perceived value of everything around it. Done properly, customers attribute the quality of the analytics to your engineering team rather than to a vendor they could have bought from directly.
Cashpad, a restaurant POS system, is a concrete version of this. Analytics became the first thing shown in demos, the dashboards read as entirely Cashpad's, customers do not encounter the infrastructure underneath, and the support team saw reporting tickets fall.
"Analytics is the first thing we show customers during demos. It immediately differentiates us from competitors who just export CSV files."
Cashpad
Most SaaS companies gate branding depth rather than analytical capability
The structure most SaaS companies land on gates branding depth rather than analytical capability, which is worth noticing because it is counter-intuitive: a free tier gets a standard dashboard with basic branding, a mid tier gets custom dashboards with logo and colours, a business tier gets the full suite with complete white-label, and enterprise adds API access and full customization. Each step is genuine additional value, and once a customer is running fully branded analytics the switching cost is substantial.
The platforms
Sumboard. Built for SaaS companies that want production-ready customer-facing analytics without building it. Drag-and-drop chart builder, multi-tenant architecture, database and API sources, cloud and self-hosted, and integration measured in minutes when your data is already queryable. Custom PDF builder, localization, interactive filters, email schedules, PDF and Excel export, period comparison, and white-label customization across all of it. Published pricing from €199/month with unlimited viewers.
Embeddable. Developer-first, headless architecture, embedding via web component or React SDK rather than iframes, aimed at maximum control over the experience. No published price.
Qrvey. End-to-end embedded analytics built for multi-tenant SaaS, embedding through JavaScript widgets rather than iframes. No published price.
Luzmo. Belgian, drag-and-drop, API-first, embedding via web component. Starter from €995/month billed annually with white-labelled embedding included, priced by solutions deployed and monthly active user band (Luzmo pricing, checked 7 August 2026).
Explo. Cloud-only, aimed at fast time to market, embedding via iframe or web component. Explo links no pricing page from its site and routes to contact, so there is no figure to quote (checked 4 August 2026).
RevealBI. Pivoted from traditional BI to customer-facing analytics, embedding via iframe or SDK, on-premise capable. No published price.
These six are the ones worth reading closely on white-label depth specifically. The category is wider: thirteen platforms are set against each other on published price and integration route in the embedded analytics alternatives guide.
This guide only prints a price we could read on the vendor's own page, with the date we read it. Four of the six route you to sales, so any figure circulating for them is somebody else's negotiated contract rather than a rate you can plan against. That is not us being cagey; it is the actual state of the category, and it is worth knowing before you build a comparison spreadsheet that implies otherwise.
Before you choose
White-label depth. Can you remove all vendor branding, place your logo where you need it, match your palette exactly, and get branded PDF exports and branded email reports?
Technical requirements. Your data sources, native multi-tenancy with row-level security, SSO through SAML, JWT or OAuth, API access for programmatic customization, and performance under your concurrency.
Pricing alignment. Flat fee or per-user, white-label included or an add-on, predictable scaling against your business model, and no hidden per-viewer cost.
Implementation timeline. Realistic time to production with the team you actually have, onboarding and support, and documentation good enough for your engineers.
Three of those four you can settle yourself, from documentation, a trial and your own load testing. White-label depth is the one you cannot, because the only evidence that counts is an artefact rendered with your assets. Which is why the advice above is to ask for the PDF and the email rather than to read the feature list.
Avoid per-user licensing for customer-facing analytics. Per-viewer and named-user models were designed for internal teams, where you control the count. Point them at customers and the meter starts counting somebody else's growth, so your most successful accounts become your most expensive. Prefer flat-rate pricing, unlimited-viewer models where you pay for builders, or revenue share.
Building custom is a permanent maintenance commitment, not a one-off cost
Build custom. 6-12 months of development with a dedicated team, then a permanent maintenance commitment rather than a one-off cost. You get complete control, perfect brand integration and no vendor dependency, and you pay for it in diverted engineering attention for as long as the product exists. Worth it when analytics is genuinely your differentiator and you have the engineering depth to carry it.
Use a platform. Branded dashboards live within a day or two, full customization in one to two weeks, pre-built white-label, updates handled elsewhere. You accept a subscription, some customization ceilings and a dependency.
For most SaaS companies the platform is the right answer, for an unglamorous reason: analytics matters to your customers but it is not what makes your product different, and the engineering attention is worth more elsewhere.
Getting started
1. Audit your branding requirements. What level do you actually need, visual or complete? Where does your brand have to appear: dashboards, PDFs, emails? What do your customers expect, and what do compliance and security require?
2. Define your use case. How many end customers will use analytics? Is it an included feature or a premium upsell? What data sources have to connect?
3. Evaluate platforms. Request white-label demos specifically rather than generic product demos. Test with your real brand assets. Ask to see branded PDF exports and email templates. Have your compliance team verify the multi-tenant security.
4. Pilot with selected customers. Five to ten engaged customers, three to five core dashboards, feedback on brand perception and usability, and a list of customization gaps found before the broader rollout rather than after.
5. Refine and launch. Adjust based on pilot feedback, train sales, support and success, write the customer documentation, and set up monitoring for usage and performance.
6. Measure and iterate. Track brand perception, feature adoption, support ticket volume, retention impact, revenue attribution and premium tier conversions.
What is changing
AI-generated insights are moving past chart recommendations into analysis: automatic insight generation, natural language query, predictive analytics, smart alerts. Mainstream.
No-code dashboard builders extend self-service from exploring data to building the dashboards, which shifts what white-label even means, from "you get branded dashboards" to "your customers build their own, inside your brand". Mainstream.
Enhanced data connectivity as data environments get more complicated: NoSQL, multi-source joins, streaming, API-first architecture. Growing.
Embedded AI agents combining dashboards with conversational exploration, proactive insights and automated reports. Emerging rather than settled, with interest well ahead of production adoption, so treat it as something to watch rather than a requirement to meet.
The strategic read: platforms differentiating on AI, particularly on private AI that does not expose customer data to a third party, are the ones to watch. When evaluating, weigh the roadmap alongside the current feature list.
Glossary
White-label. A product that can be rebranded and offered as your own, with no visible connection to the original vendor. In analytics, that means dashboards, reports and every customer touchpoint carry your brand.
Multi-tenant. An architecture where one instance serves multiple customers with strict data isolation between them. See multi-tenancy.
OEM. Original equipment manufacturer. Similar to white-label: made by one company, sold under another's brand. Common in this market.
Embedded analytics. Data visualization and reporting integrated directly into an application, rather than accessed through a separate tool. See embedded analytics.
Row-level security. Access control restricting which rows each user or tenant can see. Essential for multi-tenant white-label work. See row-level security.
Ready to launch customer-facing analytics?
Stop losing customers to competitors with better analytics. Sumboard's customer-facing analytics platform lets you launch self-service dashboards in days, not months.