Self-service analytics transforms how organizations interact with data by enabling business users to independently explore, analyze, and visualize information without technical expertise or IT dependency. This complete guide examines self-service analytics for B2B SaaS companies, contrasting internal business intelligence implementations with Sumboard's customer-facing analytics, embedded in the product itself.
The distinction matters fundamentally: internal BI serves 10s-100s of employees analyzing company data, while embedded analytics serves 1,000s-10,000s of customers analyzing their own data through your product. These scenarios require different architectures, pricing models, and platform capabilities.
This guide covers self-service analytics core concepts, implementation approaches, industry applications, advanced capabilities, and platform selection criteria, with particular focus on B2B SaaS companies embedding analytics for customers.
What Self-Service Analytics Means for Internal BI and Customer-Facing Products
Self-service analytics is a data analytics approach enabling business users to access, analyze, and visualize data independently without SQL knowledge or IT support. Users create reports, build dashboards, and generate insights through intuitive interfaces rather than submitting requests to analysts.
The "self-service" designation means users control the analytical process: they formulate questions, explore data, create visualizations, and derive insights, all without technical gatekeepers. This democratization of data accelerates decision-making and reduces bottlenecks in data-driven organizations.
Self-service analytics is a data analytics approach that allows business users without technical expertise to independently access, analyze, and visualize data through intuitive interfaces, eliminating dependency on IT teams or data analysts for report generation and insights.
Self-service analytics emerged as organizations recognized that centralizing analytics through specialist teams created bottlenecks. Waiting days or weeks for reports from overwhelmed BI teams meant decisions lagged behind business needs. Modern self-service platforms democratize data access while maintaining governance through semantic layers and access controls.
The approach succeeds when balanced governance meets user empowerment. Too much control recreates bottlenecks; too little control produces unreliable insights. The best implementations provide guardrails (data quality, security, metric definitions) while giving users freedom to explore within those boundaries.
Core Components of Self-Service Analytics
Effective self-service analytics requires several integrated components working together.
Intuitive User Interface
The interface determines self-service viability. Non-technical users need drag-and-drop builders for the dashboard types they actually need, visual query builders that generate SQL automatically, pre-built chart templates for common visualizations, natural language query capabilities, and guided analytics workflows that suggest next steps.
Interface quality matters more than feature count. A simple interface enabling 80% of use cases succeeds better than complex tools requiring extensive training.
Data Connectivity Layer
Self-service platforms must connect to diverse data sources through native connectors for databases (PostgreSQL, MySQL, SQL Server), data warehouses (Snowflake, BigQuery, Redshift), SaaS applications (Salesforce, HubSpot, Google Analytics), APIs and webhooks for custom sources, and real-time streaming data for operational analytics.
The connectivity layer should abstract technical complexity. Users shouldn't understand database schemas, authentication protocols, or data transformation logic. They should simply select "Salesforce" and see business-ready data.
Semantic Layer (Business Logic Layer)
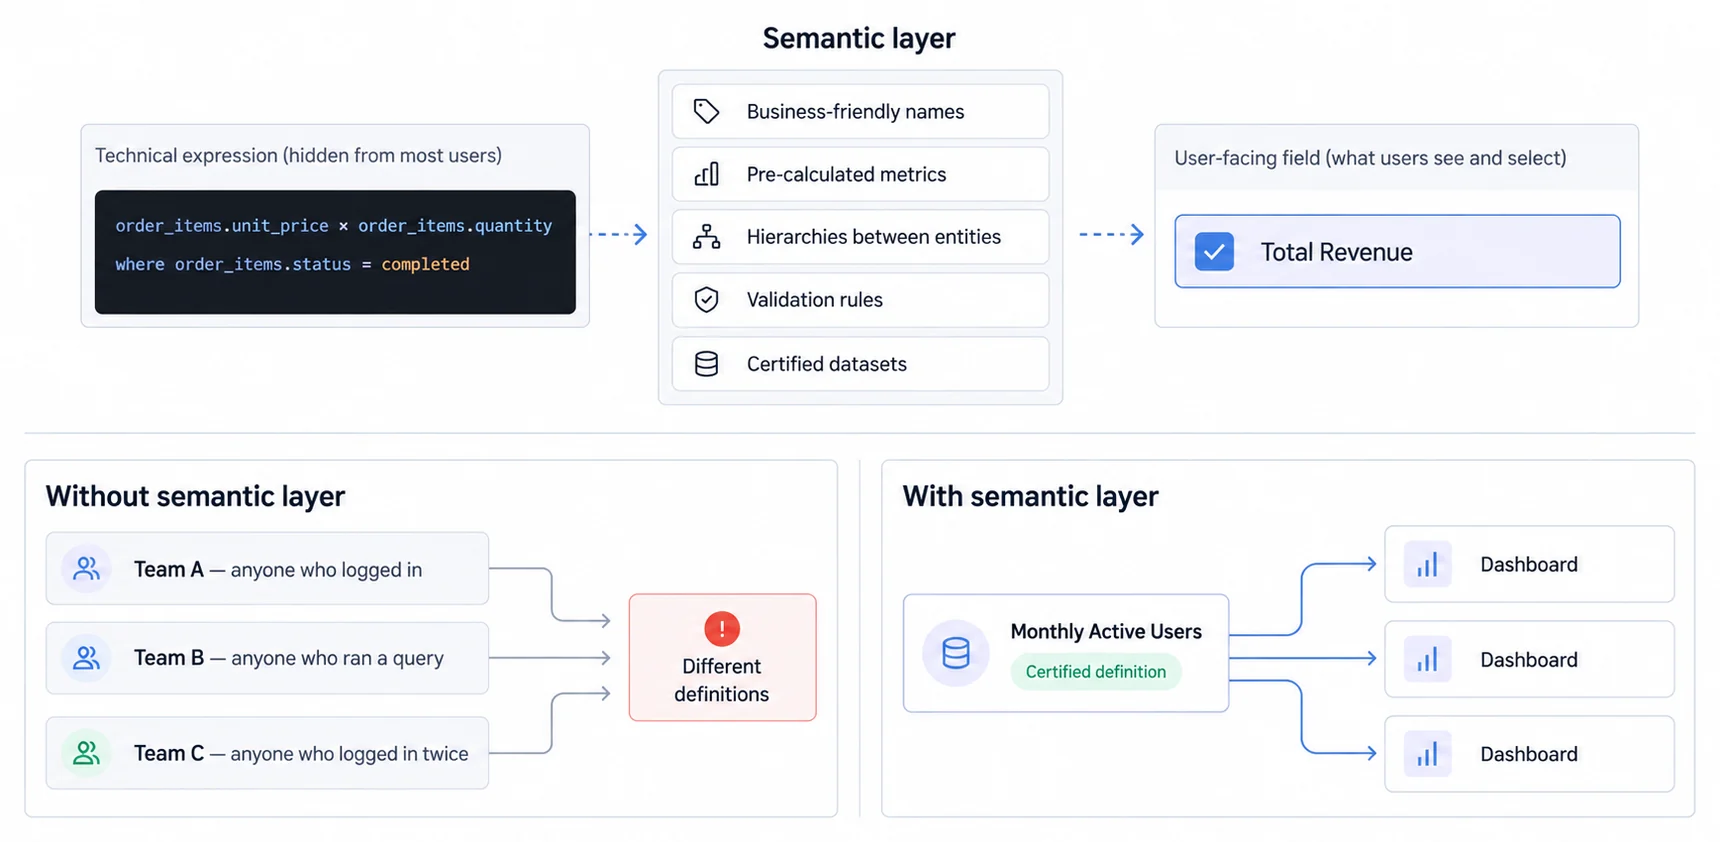
The semantic layer translates technical database structures into business-friendly concepts. It maps "order_items.unit_price * order_items.quantity WHERE order_items.status = 'completed'" into "Total Revenue" that users can simply select.
This layer enforces consistent metric definitions across the organization. Everyone calculating "Monthly Active Users" uses identical logic rather than creating 12 different definitions. The semantic layer becomes the single source of truth for business metrics.
Modern semantic layers support business-friendly naming for technical fields, pre-calculated metrics and KPIs, hierarchical relationships between data entities, business rules and validation logic, and certified datasets that governance teams approve.
Governance and Security
Self-service requires reliable governance preventing data misuse while enabling exploration. This includes row-level security ensuring users see only authorized data, role-based access controls determining feature access, data lineage tracking showing metric origins, audit logs recording all data access, and data quality monitoring flagging issues.
For multi-tenant applications serving external customers, security becomes critical. Each customer organization must see only their data with zero possibility of cross-customer data leakage.
Data Transformation and Preparation
Self-service doesn't mean raw data access. Effective platforms provide data cleaning and normalization, joining related datasets automatically, aggregation and summarization capabilities, filtering and segmentation tools, and calculated fields for custom metrics.
The goal: users work with analysis-ready data rather than spending hours preparing datasets before answering business questions.
Visualization and Exploration
The platform must support diverse visualization needs through standard charts (line, bar, pie, area, scatter), advanced visualizations (heatmaps, treemaps, sankey diagrams), interactive filtering and drill-down capabilities, comparison and trend analysis, and export options (PDF, Excel, CSV, images).
Visualization quality impacts adoption. Poorly designed charts confuse rather than clarify. The best platforms apply data visualization best practices automatically, guiding users toward appropriate chart types for their data.
Self-Service Splits Into Two Use Cases With Fundamentally Different Requirements
The self-service analytics landscape divides into two fundamentally different use cases with distinct requirements.
| Dimension | Internal self-service BI | Customer-facing embedded analytics |
|---|---|---|
| Users | Employees (sales, finance, ops, execs) | External customers of your SaaS product |
| User count | 10s to 100s | 1,000s to 10,000s across many orgs |
| Architecture | Single-tenant, shared company data | Multi-tenant, strict per-tenant isolation |
| Authentication | Corporate SSO (Okta, Azure AD) | External user auth + enterprise SSO |
| Branding | Internal appearance acceptable | Full white-label required |
| Security | Role-based access control | Row-level security per tenant |
| Pricing | Per-user licensing (predictable counts) | Per-user breaks down at scale |
| Examples | Tableau, Power BI, Looker, Qlik | Purpose-built embedded platforms |
Internal Self-Service BI
Internal self-service BI serves company employees across sales, marketing, finance, operations, and leadership. A typical deployment covers tens or hundreds of users sharing company data through a single-tenant architecture, with department or team permissions enforced through role-based access control and corporate SSO such as Okta, Azure AD, or Google Workspace.
Because the audience is known and relatively stable, per-user licensing can remain workable and the interface does not need white-label branding. Tableau, Power BI, Looker, Qlik Sense, and ThoughtSpot are common platform choices. Enterprise implementation usually takes months rather than weeks once data modeling, governance, and training are included; the goal is to help employees analyze company performance and make operational decisions independently.
Customer-Facing Embedded Analytics
Customer-facing self-service analytics serves external users inside a B2B SaaS product, often across hundreds of customer organizations and thousands of end-users. That audience requires a multi-tenant architecture, strict row-level isolation, external authentication with enterprise SSO support, and complete white-label control so the analytics experience belongs to the host product.
At this scale, flat-rate or usage-based pricing is usually easier to sustain than a fee for every viewer. Purpose-built choices include Sumboard embedded analytics, Qrvey, Embeddable, and Luzmo. An SDK integration and its first dashboards can take days to weeks; the goal is to ship analytics as a native product feature through which each customer explores only its own data.
The architectural differences extend beyond user count. Internal BI platforms assume trusted users accessing shared company data. Embedded platforms assume untrusted external users requiring strict data isolation, unlimited scalability, and complete customization.
Choosing the wrong platform category creates fundamental problems. Using Tableau for customer-facing analytics means manually implementing multi-tenancy, white-labeling (often impossible), and paying per-customer-user fees that become unsustainable. Using an embedded platform for internal BI adds unnecessary complexity and developer overhead.
The internal BI vs embedded analytics decision determines your platform category and cannot be changed easily. If you're building customer-facing analytics within your B2B SaaS product, you need an embedded analytics platform from the start, not an internal BI tool that you try to retrofit.
Self-Service Capabilities Layer Up, Each One Enabling Deeper Analysis
Modern self-service platforms provide progressively sophisticated capabilities enabling deeper analysis.
Ad-Hoc Query Builder
Users construct queries visually without SQL through drag-and-drop field selection, point-and-click filtering, visual join builders connecting related data, aggregation functions (sum, average, count, min, max), and query result preview before running full analysis.
The query builder translates visual actions into optimized SQL, handling complexity like joining multiple tables, filtering null values, and applying aggregation logic. Users think in business terms ("Show me monthly revenue by product category") rather than database operations.
Dashboard Creation and Customization
Self-service platforms enable users to build personalized dashboards through drag-and-drop dashboard builders, widget libraries with pre-built visualizations, responsive layouts adapting to different screen sizes, custom filters letting viewers slice data independently, and scheduled dashboard delivery via email.
Dashboard democratization means every user can create views aligned with their specific needs rather than consuming generic reports designed for everyone (and thus optimized for no one).
Data Exploration and Drill-Down
Users work through from summary to detail through multi-level drill-down from aggregates to transactions, cross-filtering where selections in one chart filter others, cohort analysis comparing user groups over time, and path analysis showing user journeys.
Exploration capabilities transform static reporting into dynamic investigation. Users start with "revenue is down" and drill into "which products, in which regions, for which customer segments" to understand root causes.
Collaboration and Sharing
Analytics becomes more valuable when insights propagate through organizations. Modern platforms support commenting on specific data points, @mentions notifying relevant colleagues, sharing dashboards with controlled access, annotations marking significant events, and embedded dashboard integration in tools like Slack or Microsoft Teams.
The social layer around data accelerates organizational learning and alignment around key metrics.
Scheduling and Alerting
Proactive analytics delivers insights automatically through scheduled report delivery (daily, weekly, monthly), threshold-based alerts when metrics exceed limits, anomaly detection highlighting unusual patterns, and subscription management letting users control notification frequency.
Rather than users checking dashboards repeatedly, the system notifies them when attention is required.
Self-Service Looks Different Depending on User Sophistication and Use Case
Self-service manifests differently based on user sophistication and use case requirements.
Guided Analytics
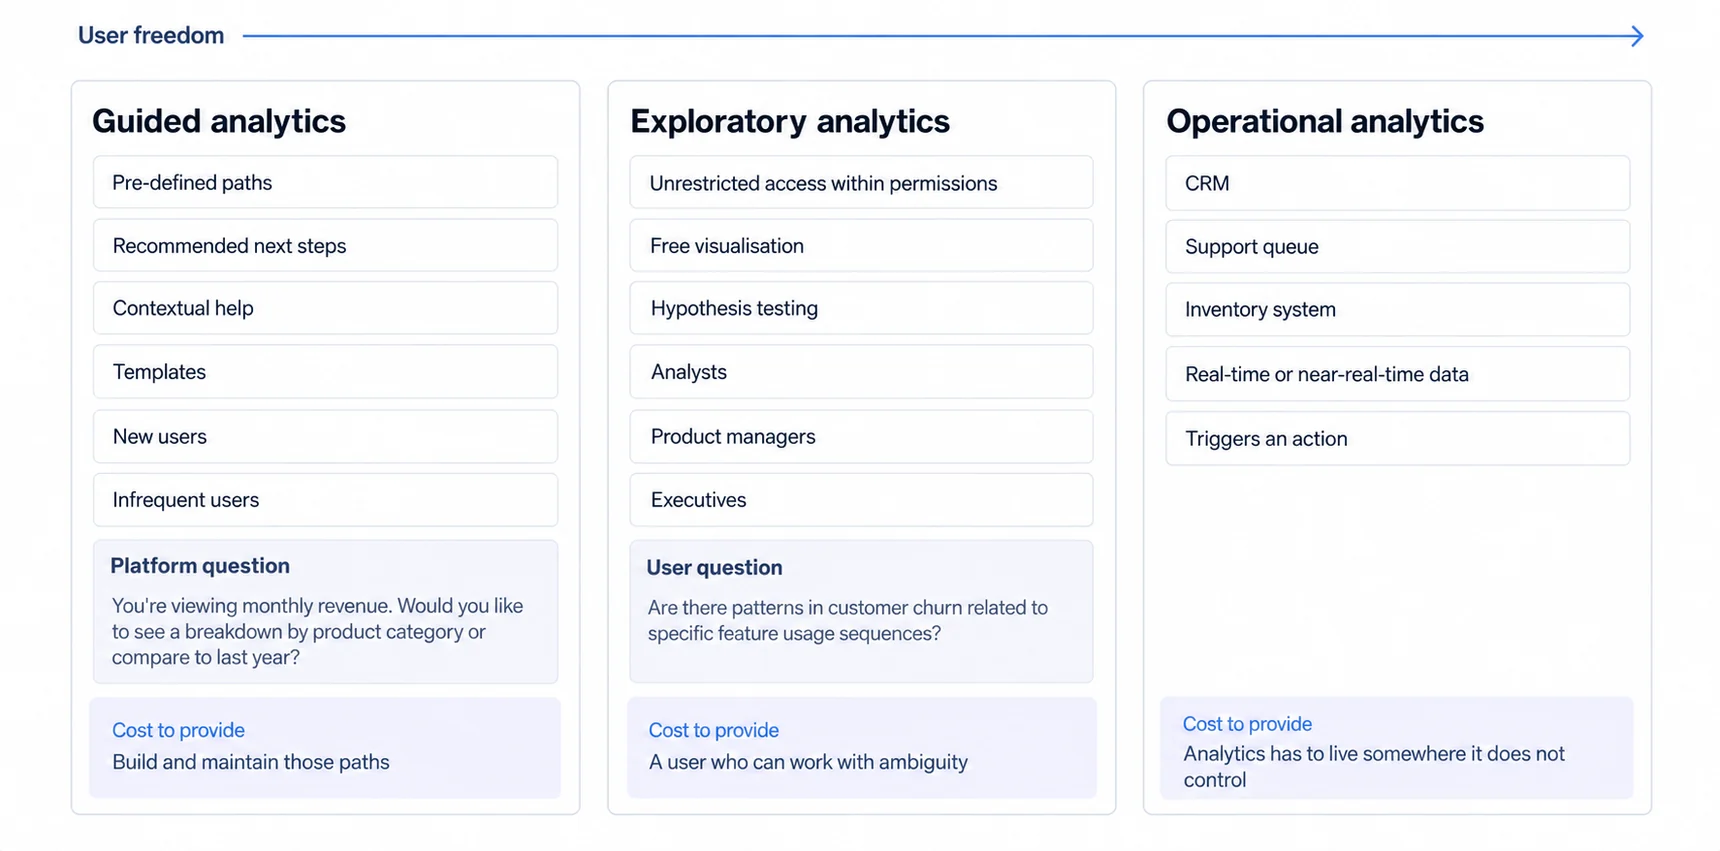
Guided analytics provides structured pathways through pre-defined workflows, recommended next analyses based on current view, contextual help explaining metrics and visualizations, and template libraries for common use cases.
This approach suits users new to analytics or infrequent users who need guidance. The platform suggests: "You're viewing monthly revenue. Would you like to see breakdown by product category or compare to last year?"
Ideal for onboarding, ensuring consistent analyses across teams, and reducing training requirements.
Exploratory Analytics
Exploratory analytics enables open-ended investigation through unrestricted data access within permissions, flexible visualization creation, hypothesis testing capabilities, and statistical analysis tools.
This approach suits data-savvy users comfortable with ambiguity who need to discover insights rather than answer pre-defined questions. They might explore: "Are there patterns in customer churn related to specific feature usage sequences?"
Ideal for analysts, product managers, and executives conducting strategic analysis.
Operational Analytics
Operational analytics embeds insights into daily workflows through real-time analytics or near-real-time data, embedded in operational tools (CRM, support tickets, inventory management), action-oriented interfaces triggering workflows, and mobile-optimized for field access.
This approach suits frontline employees making operational decisions. A sales rep views customer health score directly in CRM; a support agent sees ticket resolution trends in their queue.
Ideal for operational efficiency, immediate decision-making, and closing the gap between insight and action.
Successful Self-Service Implementations Balance Technology, Process, and People
Successful self-service implementations follow structured approaches balancing technology, process, and people.
Phase 1: Assessment and Planning (Weeks 1-2)
Define clear objectives beyond "better analytics." Specify desired outcomes like "reduce time-to-insight from 2 weeks to 2 hours" or "enable sales teams to create pipeline dashboards independently."
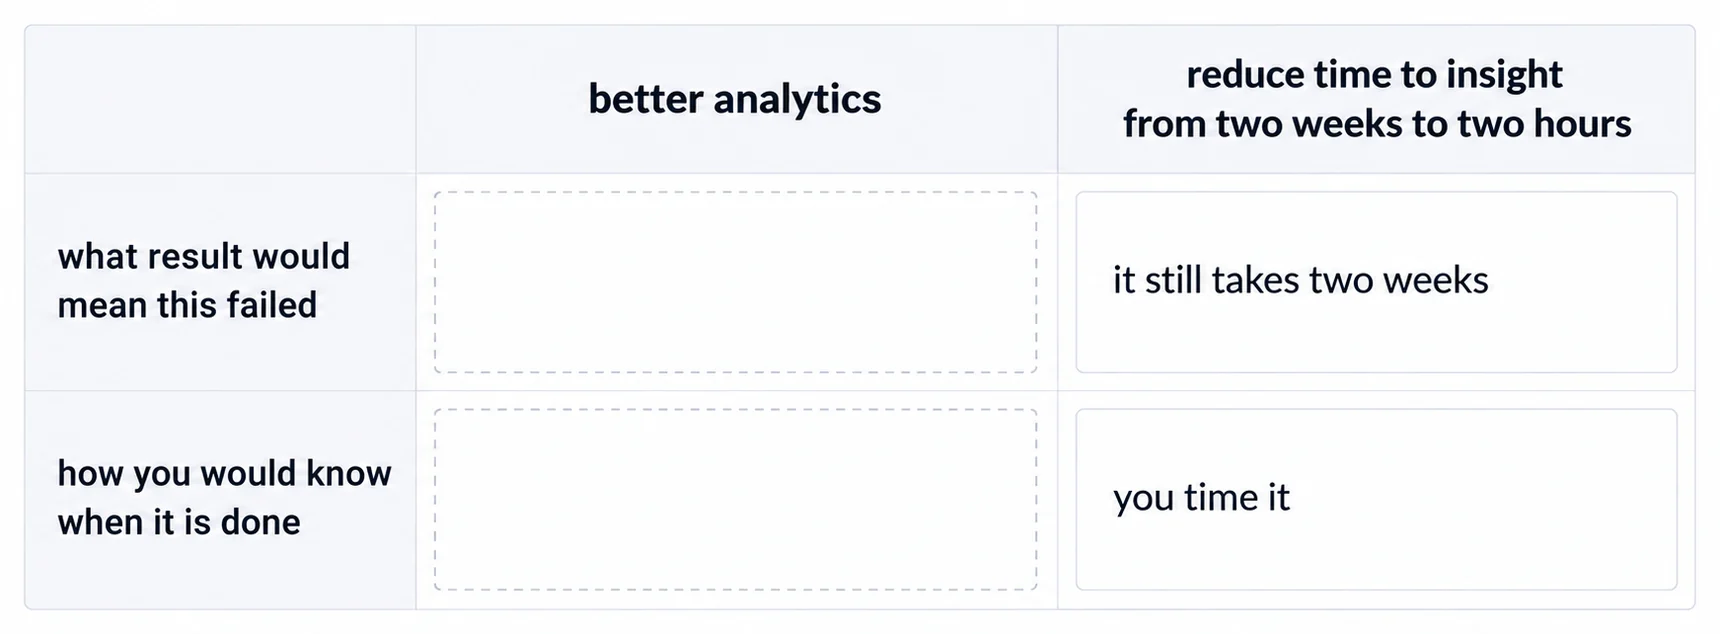
Identify initial use cases providing immediate value with manageable complexity. Start with 2-3 specific scenarios rather than attempting complete rollout. Marketing teams analyzing campaign ROI, sales teams tracking pipeline metrics, or customer success monitoring engagement scores work well as starting points.
Evaluate current data infrastructure including source systems, data quality, existing business intelligence tools, and team data literacy. Gaps here derail self-service later.
Establish governance framework before rollout. Define data ownership, access policies, metric definitions, and approval processes. Starting with weak governance creates chaos requiring painful remediation.
Phase 2: Data Foundation (Weeks 3-6)
Build or enhance your semantic layer mapping technical schemas to business concepts. This investment determines self-service success. Users won't succeed working through raw "fact_transactions" tables, they need "Orders", "Customers", and "Products" with pre-calculated metrics.
Implement data quality monitoring detecting anomalies, missing values, and inconsistencies. Self-service amplifies data quality issues since users lack expertise recognizing problems.
Create certified datasets that governance teams have validated for accuracy, completeness, and appropriate access controls. Designate these as "approved for self-service" while restricting access to unvetted sources.
Establish row-level security ensuring users see only data they're authorized to access. For embedded analytics in multi-tenant applications, this means rigorous testing preventing cross-tenant data leakage.
Phase 3: Platform Selection and Configuration (Weeks 7-10)
Choose appropriate platform category: internal BI tools (Tableau, Power BI, Looker, Qlik) for employee use cases, or one of the embedded analytics alternatives (Sumboard embedded analytics, Qrvey, Embeddable) for customer-facing scenarios.
Configure authentication and single sign-on integration with existing identity providers. Setup should feel smooth, users shouldn't notice they're accessing a new system.
Connect to data sources and validate connectivity, performance, and refresh schedules. Users expecting real-time data who receive yesterday's numbers quickly lose trust.
Create initial dashboards and reports demonstrating platform capabilities while providing immediate value. These serve as templates users can modify rather than building from scratch. Follow dashboard design best practicesfor optimal results.
Phase 4: Training and Enablement (Weeks 11-14)
Develop tiered training appropriate to user sophistication: basic training for occasional users, intermediate training for frequent users, and advanced training for power users who'll become champions.
Create complete documentation including getting started guides, video tutorials, metric definitions and business logic explanations, and troubleshooting common issues.
Establish ongoing support including regular office hours, Slack/Teams channels for questions, designated analytics champions in each department, and feedback mechanisms for improvement requests.
Conduct initial training in small groups enabling hands-on practice with realistic scenarios. Lecture-style training produces minimal capability; guided practice with immediate application builds competence.
Phase 5: Rollout and Adoption (Weeks 15+)
Launch with early adopters who'll provide feedback and become advocates. Their success stories drive broader adoption more effectively than top-down mandates.
Monitor adoption metrics including active users, dashboard creation rates, query volumes, and time spent in platform. Low engagement signals training gaps or capability mismatches.
Iterate based on user feedback. Self-service platforms require continuous refinement as usage patterns reveal limitations and opportunities.
Celebrate successes publicly. Recognize teams using self-service effectively and share their insights across the organization. Positive reinforcement accelerates adoption.
Expand gradually adding new data sources, advanced features, and additional user groups. Complexity should grow with user maturity.
The Obstacles Are Predictable, Which Is What Makes Them Preventable
Organizations encounter predictable obstacles implementing self-service. Understanding these enables proactive mitigation.
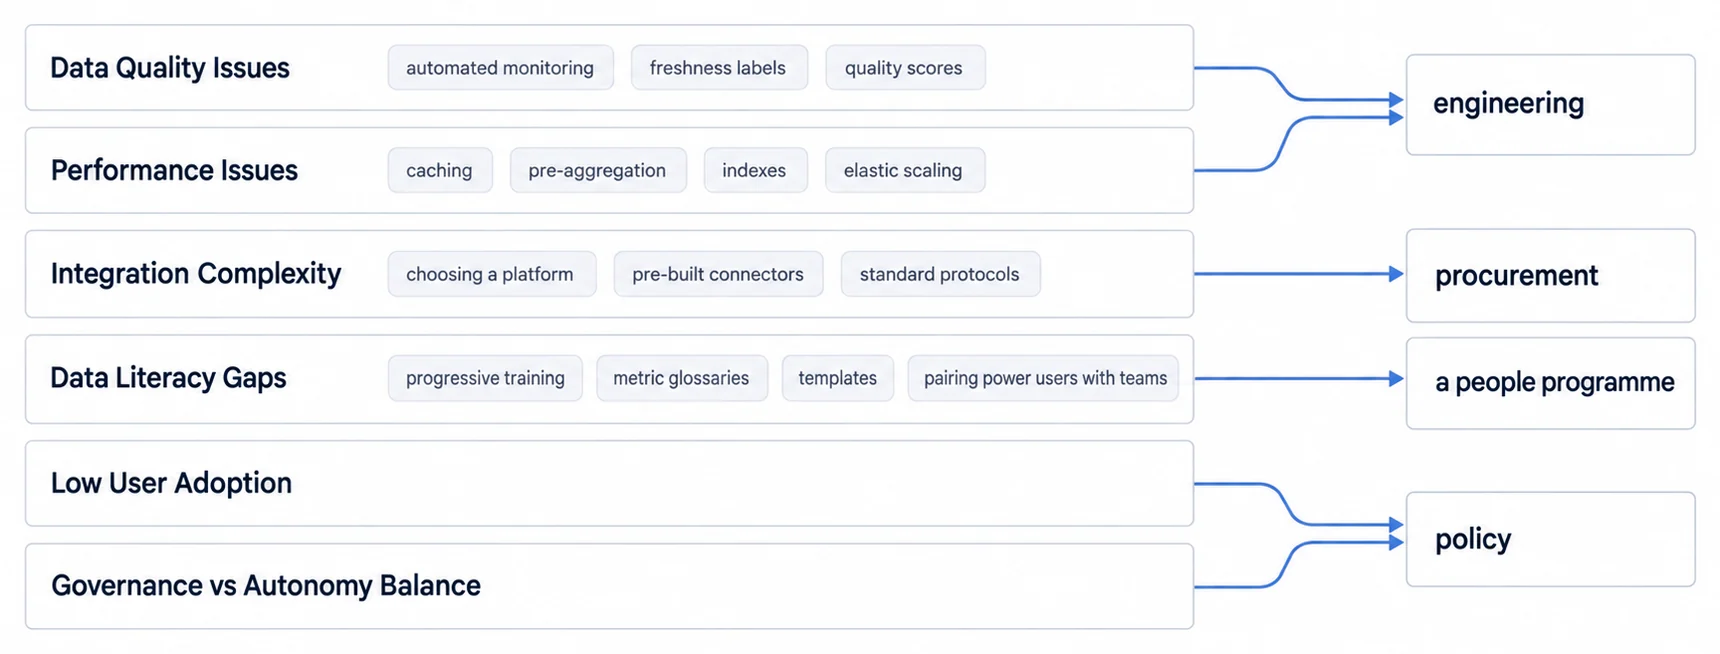
Challenge: Data Quality Issues: Self-service amplifies underlying data quality problems. Users lacking technical expertise can't distinguish accurate data from errors, leading to decisions based on flawed insights.
Solution: Implement automated data quality monitoring detecting anomalies before users encounter them. Clearly label data freshness and quality scores. Create feedback loops enabling users to report suspected issues. Prioritize fixing systematic quality problems rather than explaining away errors.
Challenge: Low User Adoption: Platforms sit unused despite training investments. Users revert to requesting reports from analysts, negating self-service benefits.
Solution: Identify adoption barriers through user interviews. Common issues include inadequate training, platforms that don't match workflows, data that doesn't answer real questions, and interfaces too complex for target users. Address root causes rather than assuming users need more training. Sometimes the platform selection was wrong.
Challenge: Data Literacy Gaps: Users with limited quantitative skills struggle interpreting results, choosing appropriate visualizations, or recognizing statistical significance.
Solution: Provide progressive training starting with guided analytics before exploratory capabilities. Create metric glossaries explaining calculations and appropriate interpretations. Build templates for common analyses reducing decision complexity. Pair power users with teams needing development.
Challenge: Performance Issues: Query response times frustrate users accustomed to instant web searches. Slow dashboards get abandoned.
Solution: Implement query result caching, pre-aggregate common metrics, establish usage-based quotas, optimize database indexes based on access patterns, and scale infrastructure elastically. Performance monitoring should trigger proactive optimization before users complain.
Challenge: Governance vs Autonomy Balance: Overly strict governance stifles the autonomy that makes self-service valuable. Too little governance creates chaos with unreliable insights.
Solution: Start with tighter controls and gradually liberalize as data literacy improves. Establish governed data zones for certified datasets while allowing sandbox environments for experimentation. Clear guidelines help users understand boundaries without blocking exploration.
Challenge: Integration Complexity: Self-service platforms must connect to diverse data sources, each with different authentication, APIs, and schemas.
Solution: Choose platforms with pre-built connectors for common sources. Use standardized protocols (OAuth for authentication, REST APIs for data access). Document integration patterns for custom sources. The best platforms abstract complexity behind simple configuration interfaces.
Successful Deployments Follow Common Patterns That Trade Risk for Value
Organizations implementing successful self-service follow common patterns that maximize value while minimizing risks.
Start with Specific Use Cases: Launch with well-defined business problems rather than generic "better analytics" goals. Concrete use cases like "sales teams need weekly pipeline analysis" provide clear success criteria and demonstrate value quickly.
Invest in Semantic Layer First: The foundation of successful self-service is governed, business-aligned data models. Build semantic layers before rollout, not iteratively. AtScale (2026) emphasizes that "no matter how powerful the AI or how sleek the interface, it all falls apart without a solid data foundation."
Balance Governance and Enablement: Create clear guardrails through role-based access, certified datasets, and metric definitions. Within these boundaries, give users freedom to explore and create. The goal is "governed democratization" not unrestricted access.
Provide Ongoing Training: Initial training isn't sufficient. Create continuous learning programs with progressive skill development, peer mentoring, regular office hours, and updated documentation. Data literacy develops gradually.
Build a Community of Practice: Foster collaboration through user forums, showcase sessions highlighting innovative analyses, peer-to-peer support channels, and analytics champions in each business unit. Community accelerates adoption and knowledge sharing.
Measure and Iterate: Track adoption metrics, user satisfaction, time to insights, and business outcomes. Use data to guide platform improvements and training investments. Self-service requires continuous evolution based on actual usage patterns.
Prioritize Data Quality: No amount of self-service capability compensates for poor data quality. Establish data quality monitoring, clearly communicate data limitations, implement validation rules, and create feedback loops for users to report issues.
Secure by Design: Build security into architecture rather than adding it afterward. Implement least-privilege access, encrypt sensitive data, audit all access, and regularly review permissions. For multi-tenant applications, automate tenant isolation testing.
Start Simple, Scale Gradually: Launch with basic self-service capabilities and proven use cases. Add advanced features based on demonstrated user demand rather than technology availability. Complexity should grow with user maturity.
Celebrate Successes: Recognize teams and individuals using self-service effectively. Share success stories across the organization. Positive reinforcement drives adoption better than mandates.
The Market Divides Into Internal BI Platforms and Purpose-Built Embedded Ones
The self-service analytics market in 2026 divides into platforms optimized for internal BI versus those purpose-built for customer-facing embedded analytics.
Internal BI Platforms include established players like Tableau (complete visualization with Tableau Pulse for natural language), Power BI (Microsoft ecosystem integration with extensive connectors), Looker (strong semantic layer with LookML), Qlik (associative data engine enabling exploratory analysis), and ThoughtSpot (AI-powered search-first analytics).
These platforms excel at empowering internal employees but lack native multi-tenancy, white-labeling, and external user scalability needed for customer-facing use cases. Pricing models assume per-user licensing suitable for hundreds of internal users, not thousands of external customers.
Embedded Analytics Platforms specialize in customer-facing implementations. These platforms provide multi-tenant architecture with data isolation, white-label customization supporting complete branding, SDK or iFrame integration for embedding, flat-rate or usage-based pricing models, developer-focused APIs and documentation, row-level security for tenant isolation, and scalability supporting thousands of customers.
Sumboard exemplifies modern embedded analytics platforms designed for B2B SaaS companies. The platform enables rapid embedding of interactive dashboards with features like filtering, comparison, email scheduling, and exports. Sumboard connects to various SQL and API data sources and provides an intuitive query editor. The low-code approach allows teams to deliver customer-facing analytics without extensive development or maintenance burden (docs.sumboard.io, 2026).
AI-Powered Analytics Platforms represent the emerging category incorporating natural language querying and automated insights. These include platforms like Querio (AI-powered with embedded analytics capabilities), DataGPT (conversational autonomous analyst), Databricks AI/BI (integrated with lakehouse architecture), and AskEnola (context-aware business question interpretation).
These platforms demonstrate the future direction where users interact with data through conversation rather than dashboard building. Google Cloud's Looker Conversational Analytics (2026) shows this evolution: "users can ask questions in natural language and get answers fast" while maintaining grounding in semantic layers for accuracy. For more on this trend, see ChatGPT for business intelligence.
Evaluation Considerations: Internal use cases prioritize ease of use, data source connectivity, and collaboration features. Customer-facing use cases prioritize white-labeling, multi-tenancy, scalability, and developer experience. The platforms serving these needs differ fundamentally in architecture and pricing.
Organizations should match platform capabilities to specific use case requirements rather than defaulting to familiar brand names designed for different scenarios.
Self-Service Analytics Use Cases by Industry
Self-service analytics manifests differently across industries based on data types, regulatory requirements, and user needs.
Healthcare Self-Service Analytics
Internal use case: Hospital staff analyze patient outcomes, resource utilization, and operational efficiency independently. Clinicians explore treatment effectiveness data without requesting reports from BI teams.
Embedded use case: Healthcare SaaS platforms (EHR vendors, population health management) embed analytics showing patient populations, quality metrics, and cost analysis for hospital customers. Self-service enables clinicians to explore their own patient data, segmented by conditions, treatments, or demographics.
Key requirements include HIPAA compliance with strict audit trails, patient-level data masking, real-time data for clinical decisions, and multi-facility isolation in health system platforms. Row-level security prevents unauthorized patient record access.
Financial Services Self-Service Analytics
Internal use case: Bank employees analyze risk metrics, portfolio performance, and customer segmentation independently. Traders explore market data, compliance teams monitor regulatory metrics, and wealth managers analyze client portfolios.
Embedded use case: Fintech platforms (investment apps, banking software, wealth management tools) embed portfolio analytics, spending insights, and investment performance for end-users. Real-time analytics integration enables timely investment decisions.
Key requirements include transaction-level security, regulatory compliance (SOC 2, PCI DSS), real-time data for trading decisions, and audit trails for regulatory reporting. Financial data accuracy and precision become critical as errors directly impact monetary decisions.
B2B SaaS Self-Service Analytics ⭐
Internal use case: SaaS company employees analyze product usage, customer health scores, and churn prediction metrics. Product teams explore feature adoption, customer success teams track engagement, and executives monitor key business metrics.
Embedded use case: SaaS products embed analytics for their customers, marketing automation showing campaign performance, HR platforms displaying workforce analytics, CRM systems providing sales pipeline insights. This represents the primary opportunity for embedded analytics platforms since self-service becomes a product differentiator.
Marketing SaaS Example
Marketing automation platforms embed campaign analytics, attribution reports, and ROI dashboards for clients using their products. Self-service enables marketing teams to explore their campaign data, create custom segments, compare channel performance, and schedule recurring deliveries, all without requesting reports from the platform vendor.
HR Tech Example
HR platforms embed workforce analytics, turnover predictions, and compensation benchmarking for HR departments. Self-service lets HR teams slice data by department, role, tenure, or custom attributes. They can independently generate compliance reports, analyze diversity metrics, and forecast hiring needs without custom development from the platform vendor.
E-Commerce Self-Service Analytics
Internal use case: E-commerce operations teams analyze sales performance, inventory levels, and customer behavior. Merchandisers explore product performance, logistics teams optimize shipping, and executives monitor business health.
Embedded use case: E-commerce platforms (Shopify, BigCommerce, WooCommerce) embed sales analytics, customer insights, and inventory reports for merchants. Self-service lets store owners analyze their own sales patterns, customer segments, and product performance without technical expertise.
Key requirements include real-time inventory tracking, multi-currency and localization support, seasonal pattern recognition, and integration with payment processors, fulfillment systems, and marketing tools.
B2B SaaS represents the highest-value opportunity for customer-facing self-service analytics. SaaS companies can differentiate products, reduce support burden, and enable customers to derive value independently, transforming analytics from cost center to revenue driver.
Advanced Self-Service Analytics Capabilities
Modern platforms extend beyond basic reporting into sophisticated analytical capabilities.
Predictive Analytics and Forecasting
Self-service platforms increasingly incorporate machine learning models enabling users to predict future outcomes through trend-based forecasting, regression analysis, classification models, and anomaly prediction.
Users access these capabilities through simple interfaces: "Forecast next quarter's revenue based on historical patterns" rather than building models manually. The platform handles model training, feature engineering, and prediction confidence intervals.
Timeline: Predictive capabilities are mainstream in 2026, with continued advancement in accuracy and ease of use. For more details, explore AI-powered analytics and predictive analytics dashboards.
Natural Language Query (NLQ)
Users ask questions in natural language: "What were last month's top-selling products in the Northeast region?" The system interprets intent, generates appropriate queries, and returns visualizations.
NLQ lowers the barrier for self-service by eliminating need to understand interface metaphors or query construction. However, effective NLQ requires reliable semantic layers ensuring accurate intent interpretation. Ambiguous questions produce unreliable results.
Timeline: NLQ is widely available in 2026 but accuracy varies significantly by platform and data domain complexity. Learn more in our natural language analytics guide.
Collaborative Analytics
Self-service evolves from individual activity to team collaboration. Collaboration features include real-time co-editing of dashboards, threaded discussions on specific insights, assignment of follow-up tasks, and shared workspaces organizing team analytics. The social layer accelerates knowledge transfer and insight propagation across organizations.
Augmented Analytics (Automated Insights)
AI proactively surfaces insights users didn't think to ask for. Anomaly detection highlights unusual patterns, correlation discovery reveals unexpected relationships, and predictive forecasts show likely future outcomes. Self-service evolves from "query-driven" to "insight-driven." Learn more about augmented analytics.
Users spend less time building dashboards and more time acting on AI-surfaced insights. The technology requires machine learning models understanding normal patterns, change point detection algorithms, and business context determining insight relevance.
Headless/Composable Analytics
Architectures decouple analytics backend (semantic layer, query engine, data transformations) from frontend (dashboards, visualizations). Developers access analytics APIs to embed insights anywhere, Slack notifications, email digests, mobile apps, in-app alerts. See the headless BI guide and API-first analytics implementation patterns.
This composability transforms analytics from dashboard destination to embedded intelligence throughout applications. The headless approach enables "analytics-as-a-service" consumed by multiple frontend experiences optimized for different contexts.
Timeline: Emerging now in modern data stacks. Mainstream adoption by 2027 as API-first architectures prove superior flexibility compared to monolithic platforms.
The Selection Framework Changes Entirely When the Reader Is a Customer
Selection framework differs fundamentally based on whether you're implementing for internal employees or external customers.
Decision Framework: Internal BI vs Embedded Analytics
The first decision: Are you implementing self-service for internal users (employees) or external users (customers)? This determines platform category.
Internal use cases → Traditional enterprise BI tools (Tableau, Power BI, Looker, Qlik)
Customer-facing use cases → Embedded analytics platforms (Sumboard, Qrvey, Embeddable)
Only one of these questions needs answering directly. Who is looking at the dashboard, an employee or a customer, settles the user count, the tenancy model, the branding requirement and the integration route on its own, because all four follow from the viewer rather than from anything you get to choose separately.
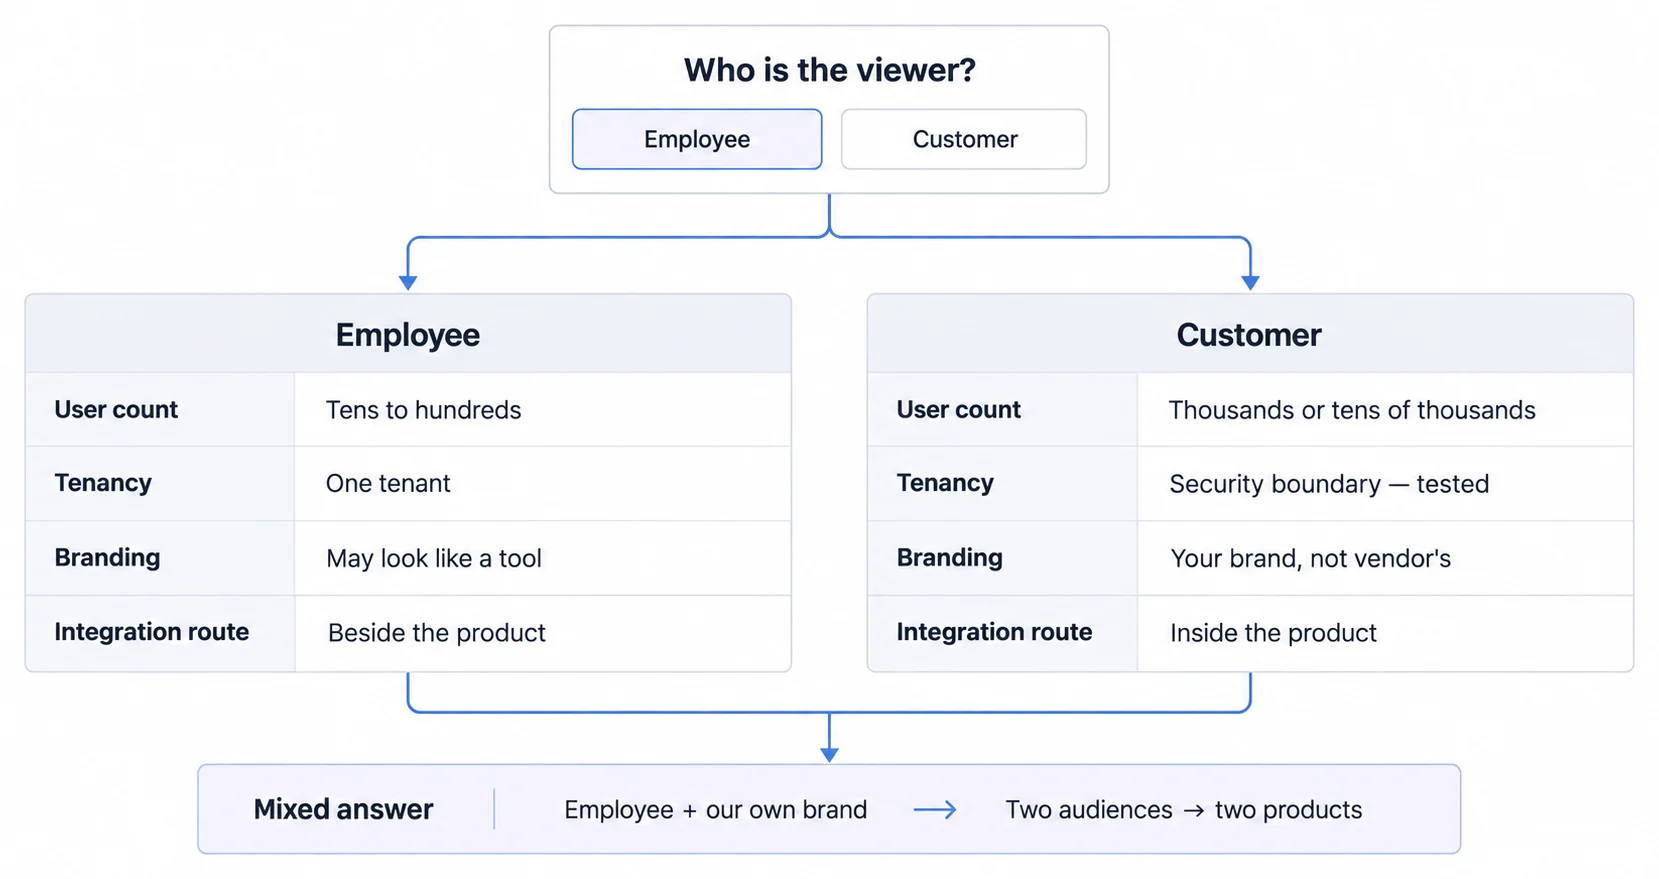
This decision is binary. Traditional BI tools lack the multi-tenancy and white-labeling that customer-facing use cases need; embedded platforms carry complexity an internal-only implementation never uses. A mixed answer is worth pausing on: it usually means two audiences rather than one platform that has to serve both.
Evaluation Criteria for Internal BI Tools
For internal business intelligence use cases, evaluate on:
Data Source Connectivity: Does it connect to your databases (PostgreSQL, MySQL, SQL Server), data warehouses (Snowflake, BigQuery, Redshift), and SaaS applications (Salesforce, Marketo, Google Analytics)?
Ease of Use: Can non-technical business users create dashboards without SQL? Are drag-and-drop interfaces intuitive? Do visualizations require extensive configuration?
Governance Features: Does it provide semantic layer for metric definitions, role-based access controls, data lineage tracking, and audit logs?
Pricing Model: Per-user pricing acceptable for internal use cases since user counts remain predictable (50-500 typical).
Implementation Timeline: months rather than weeks for enterprise deployments, covering data modeling, governance setup, and training.
Vendor Ecosystem: Availability of training resources, community forums, consulting partners, and third-party integrations.
Evaluation Criteria for Embedded Analytics Platforms ⭐
For customer-facing embedded use cases, DIFFERENT criteria apply:
White-Label Depth: Complete customization (logos, colors, fonts, domain names) vs limited theming. Customers should never see the analytics vendor's brand. See our white-label analytics guide.
Multi-Tenant Architecture: Built-in data isolation vs DIY implementation. Platform should natively support thousands of tenants with row-level security.
Integration Approach: SDK embedding (React, Vue, Angular components) vs iFrame embedding. SDKs provide more control; iFrames deploy faster. Learn about iframe vs SDK implementation.
Pricing Model: Flat-rate or usage-based vs per-user critical since external user counts can be 10,000+. Per-user pricing becomes prohibitively expensive.
Deployment Speed: Days vs months matters when analytics is a competitive differentiator. Fast implementation accelerates time-to-market.
Developer Experience: API quality, documentation completeness, SDK maintenance, and webhook support determine engineering productivity.
Scalability: Platform must handle 10 customers vs 10,000 customers without architecture changes. Auto-scaling, caching, and query optimization required.
Security: Row-level security enforcement, SOC 2 certification, data encryption, audit logging, and optional self-hosting for compliance.
Build vs Buy Decision Matrix
Build the analytics layer in-house only when at least one of these conditions is genuinely true:
- Analytics IS your core product (Tableau, Looker themselves)
- Unlimited engineering resources available
- Ultra-specific custom requirements no platform can meet (extremely rare)
Buy a platform when analytics supports the product rather than defining it, especially under these conditions:
- Analytics is a FEATURE, not the core product, which is the usual case
- Fast time-to-market critical
- Want to avoid maintenance burden
- Need proven security/compliance
- Limited engineering resources
Compare cost over the period in which the product will actually operate, including retained engineering capacity rather than licence price alone:
- Build: your own salaries for a 6-12 month first version, plus ten years of the engineering capacity it keeps occupied
- Buy: Sumboard is €199-€499 a month; other vendors range from published figures up to quote-only, so the number depends on which one and on what its meter counts
The economics heavily favor buying unless analytics represents your primary revenue stream.
When Sumboard is the Right Choice ⭐
Sumboard fits customer-facing B2B SaaS products that need to serve tens to thousands of tenant organizations, deploy in days or weeks, and avoid a per-viewer price that grows with customer adoption. It is designed for API-first products with React, Vue, or Angular frontends whose developers need SDK control without committing to a six-to-twelve-month analytics build.
It is not the right fit in these situations:
- Internal BI only (use Tableau/Power BI/Looker)
- Ultra-custom UX requirements justifying in-house build
- Legacy tech stack with complex integration needs
Sumboard's low-code approach lets teams "focus on core product while still delivering high-quality analytics to customers" without extensive development burden (docs.sumboard.io, 2026). Explore the embedded analytics platform, the customer-facing analytics product, and embedded dashboard solutions.
Ready to launch customer-facing analytics?
Stop losing customers to competitors with better analytics. Sumboard's customer-facing analytics platform lets you launch self-service dashboards in days, not months.