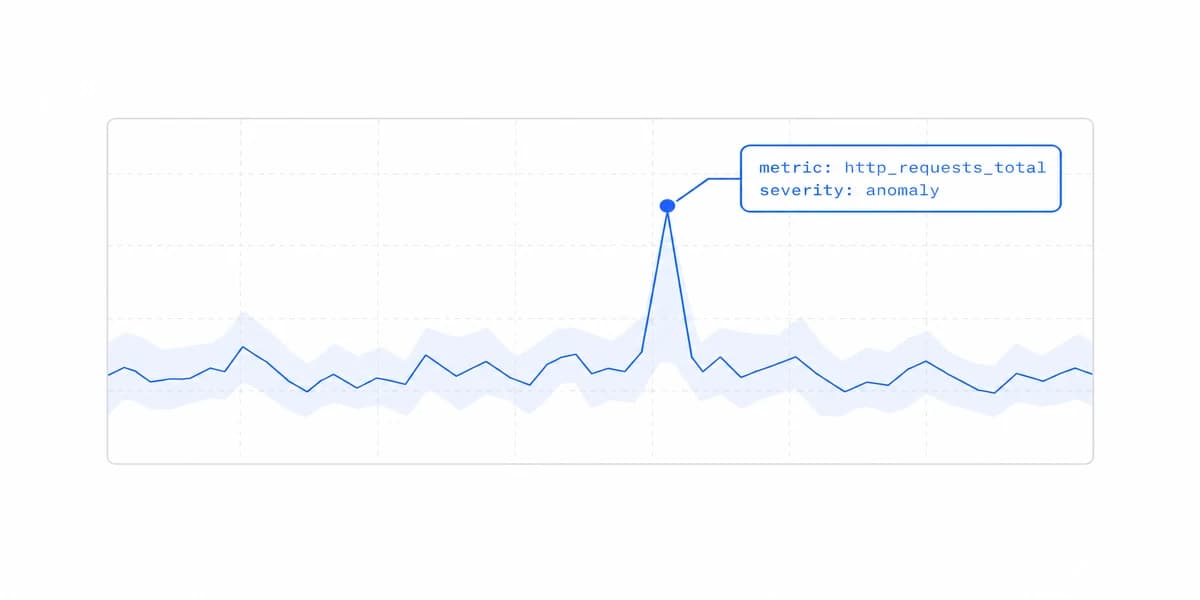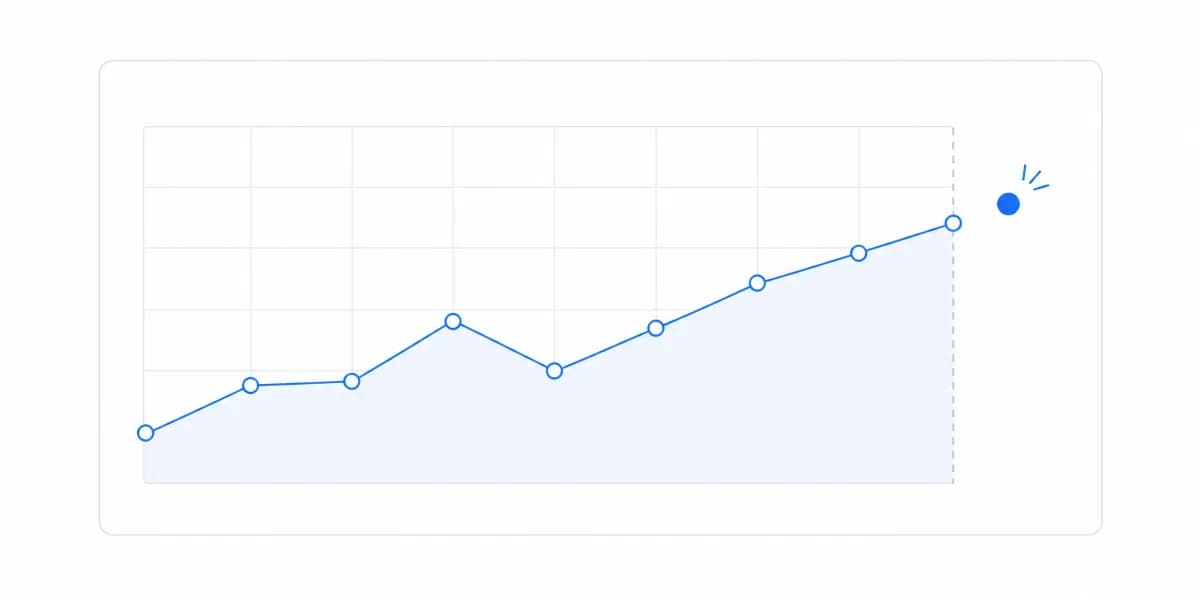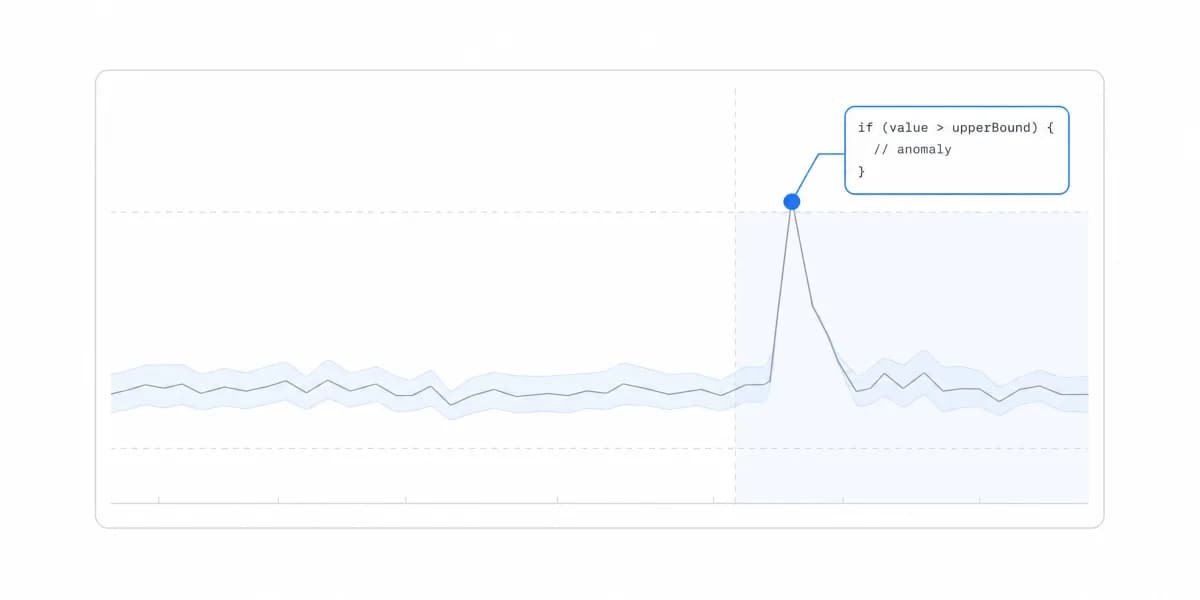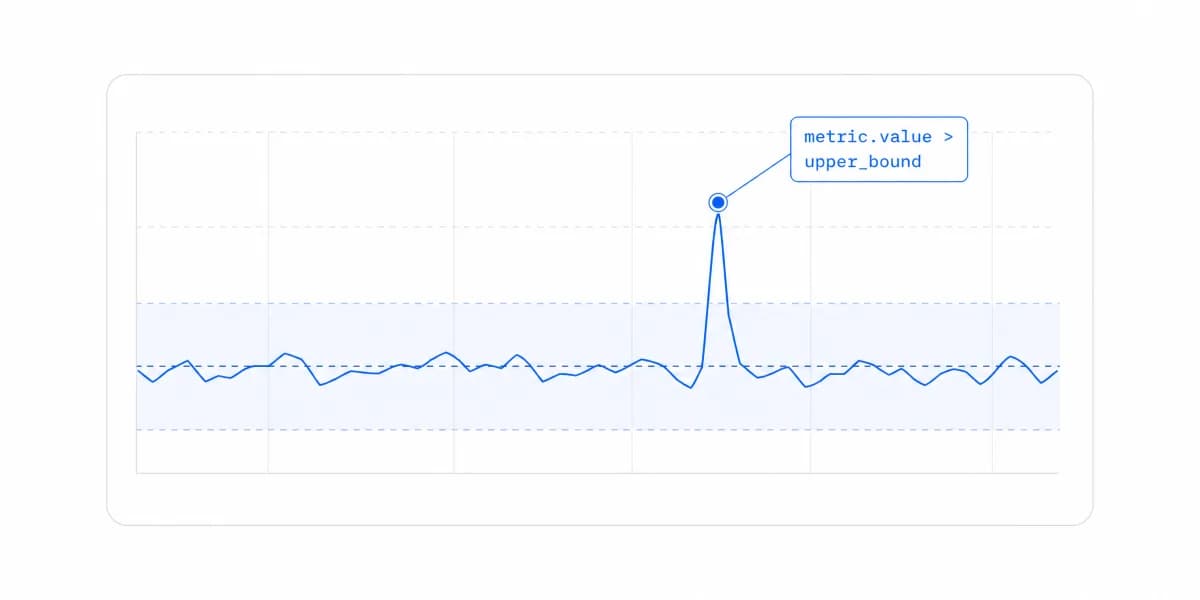
We've been noticing a pattern in customer conversations. The question isn't whether to add analytics anymore. It's whether those analytics should predict what's coming next.
A year ago, customers were asking for dashboards that showed "what happened last quarter." Now they're asking: "Can we forecast churn risk for each customer? Can we predict which accounts will upgrade? Can we show sales reps which deals are likely to close?"
This shift from descriptive to predictive analytics is happening faster than most SaaS companies expected.
What Makes Predictive Analytics Different
Traditional dashboards answer "what happened?" Predictive analytics dashboards attempt to answer "what's next?" That split is worked through in predictive versus traditional analytics, including where each one belongs in a customer-facing product.
The technical difference is straightforward: descriptive analytics uses historical data aggregation (sums, averages, counts), while predictive analytics applies statistical models and machine learning to forecast future outcomes.
But here's what matters from a product perspective: your customers don't just want to see their data anymore. They want to know what to do with it.
We're seeing this across verticals:
- FinTech: Customers want fraud predictions, not just fraud reports
- MarTech: Users expect campaign performance forecasts, not just historical metrics
- HR Tech: Clients need turnover predictions before employees quit
The bar has shifted. Static reports feel outdated. Forecasts feel actionable.
Prediction Is Math Applied to Patterns, and It Needs Months of Clean Data
Let's be direct about what embedded analytics really means, because there's a lot of marketing hype around this term.
Predictive dashboards differ by the decision being estimated, the available evidence, and how uncertainty is communicated.
Time series forecasting, Using historical patterns to predict future values (e.g., "Based on the last 12 months, revenue next quarter will likely be $X with 85% confidence")
Regression models, Identifying relationships between variables to predict outcomes (e.g., "Feature X usage is associated with a higher upgrade probability")
Classification models, Categorizing future events (e.g., "This customer has a 72% churn risk score")
The reality: predictive models require substantial historical data (typically 6-12 months minimum), clean data pipelines, and regular retraining to maintain accuracy. They're not magic. They're math applied to patterns.
For SaaS companies, this creates a dilemma: your customers expect predictions, but building the infrastructure to generate them takes 6-12 months and ongoing data science expertise.
The Bigger Opportunity Is Customers Seeing Forecasts About Their Own Data
Here's where the conversation shifts.
Most content about predictive analytics dashboards focuses on internal use cases, helping your own team make better decisions. That's valuable, but it's only half the story.
The bigger opportunity: embedding predictive analytics directly into your product so your customers see forecasts about their own data.
Think about it: If your SaaS platform manages inventory, your customers don't just want to see current stock levels, they want to know when they'll run out. If you provide marketing analytics, clients want predictions about campaign performance before the campaign runs.
Customer-facing predictive analytics dashboards give your users the ability to:
- See forecasts specific to their account
- Explore "what-if" scenarios (e.g., "If I increase ad spend by 20%, what's my predicted ROI?")
- Receive proactive alerts when predictions indicate risk
We're seeing SaaS companies in competitive markets use this as differentiation. When your competitor shows "here's what happened," and you show "here's what's likely to happen next," you win deals.
The challenge: embedding predictive analytics introduces complexity around multi-tenancy (each customer sees only their predictions), performance (displaying predictions needs to be fast), and white-labeling (predictions should feel native to your product).
Building Takes Six to Twelve Months, Embedding Takes Days to Weeks
Let's talk about implementation realities.
Building predictive analytics in-house typically involves:
- Data infrastructure: warehouses, pipelines, model training environments
- Data science team: hiring ML engineers, maintaining models
- Dashboard layer: building UI for predictions, alerts, scenario planning
- Timeline: 6-12 months to production
- Cost: a 6-12 month first build with a dedicated engineering team, $200K-500K+ in engineering cost, and a continuing share of engineering capacity after launch
We've seen startups commit to this path, then realize 15 months in that they've barely shipped basic forecasting while their roadmap has stalled.
The alternative: embedding analytics to visualize your predictions means:
- Connect to your existing data warehouse where predictions are stored
- White-label dashboard components that match your product
- Interactive exploration and filtering for end users
- Timeline: Days to integrate, weeks to customize
- Cost: Predictable monthly subscription
The key insight: you don't need to build both the prediction engine AND the visualization layer. Most companies already have (or can query) predictive data, they just need a fast way to show it to customers.
Your data team can focus on generating accurate forecasts using whatever tools they prefer (Python, dbt, Snowflake's ML functions, external APIs). Our comparison of embedded analytics platforms covers how each one handles everything else: multi-tenant data isolation, interactive dashboards, PDF exports, scheduled reports.
The trade-off: you gain speed and avoid maintenance burden for the visualization layer, while keeping full control over your prediction logic.
Across the customer conversations behind this guide, most predictive use cases have not needed a custom dashboard interface. That is an observation from our own conversations rather than a measured share, so treat it as a reason to test standard components first. Standard interactive charts, filters, and drill-downs work well for displaying churn predictions, sales forecasts, and risk scores.
The real differentiation comes from how you present predictions to users (the interactivity, the context, the actionability) not from building a custom charting engine from scratch.
The Prediction Itself Is Only Half the Value
Here's what we're learning from customers who've embedded predictive analytics: the prediction itself is only half the value.
A dashboard that shows "72% churn risk" is interesting. A dashboard that shows "72% churn risk because of low feature adoption + no support tickets in 60 days" is actionable.
What makes predictive analytics dashboards actually useful:
Interactive exploration, Users can drill into predictions, filter by segment, adjust time horizons. Static forecasts feel like black boxes. Interactive forecasts feel trustworthy.
Confidence intervals, Don't just show the prediction; show the range. "Revenue forecast: $500K (±$75K)" sets better expectations than "$500K" alone.
Alert systems, Proactive notifications when predictions cross thresholds. If a customer's churn risk jumps from 20% to 75%, they shouldn't have to log in to discover it.
Contextual recommendations, Pair predictions with suggested actions. "Churn risk increased → Consider reaching out to discuss usage patterns."
The technical challenge: displaying predictions in real-time requires fast query execution. Users expect dashboards to load with near-instant response times, even when querying large prediction datasets. This is where infrastructure matters, poorly optimized analytics platforms create laggy experiences that erode trust.
For embedded analytics, performance is critical. Your customers are using predictions to make decisions. Slow dashboards kill confidence in the predictions themselves.
Cashpad, a restaurant management SaaS, embedded analytics to show operational predictions to their customers: "Analytics is one of the first things we are showing to our customers... Now it looks so much better than before, and works faster." The speed improvement transformed their customer demos and drove adoption.
Predictive Analytics Is Moving From Nice-to-Have to Table Stakes
Predictive analytics used to be a "nice-to-have" feature for advanced users. It's quickly becoming table stakes.
Your customers (especially in competitive SaaS markets) expect to see forecasts, risk scores, and predictions. They're comparing your analytics to what they see in consumer apps (Spotify predicts their music taste, Netflix forecasts what they'll watch next).
The question isn't whether to add predictive analytics. It's how fast you can ship it without derailing your product roadmap.
For resource-constrained teams, that usually means separating concerns: your data team generates predictions, your embedded analytics platform visualizes them. The companies that figured this out 12 months ago are now winning deals based on their predictive features while competitors are still building dashboard infrastructure from scratch.
Where to go next
- AI analytics guide: the seven categories of AI analytics and the different question each one answers.
- AI-Powered Analytics: customer expectations for analytics are changing faster than most platforms can keep up.
- AI Analytics articles: every article in this cluster.
Ready to embed predictive analytics?
Sumboard's embedded analytics platform connects to your data warehouse and provides white-label dashboard components, visualize customer-facing predictions in days, not months.