Different users can need different views of the same governed metrics because their decisions, time horizons, and workflows differ.
Separate dashboards by role can be a useful starting point, but they add maintenance and may not represent the user's current task.
Authorization and personalization solve different problems. Authorization determines what the user may see. Personalization may organize only that permitted set using explicit preferences, context, or evaluated behavior signals.
Treat Behavior as Ambiguous Evidence
Visits, filters, drill-downs, saved views, and exports can provide product evidence, but they do not reveal intent by themselves. Repeated use may indicate value, habit, confusion, or a missing shortcut. Combine telemetry with interviews, task observation, support evidence, and an explicit hypothesis.
A customer-facing analytics product such as Sumboard can compare task-based defaults with role-based dashboard types. Measure comprehension, task completion, errors, time, reset use, and support demand rather than treating clicks as success.
What Makes AI Dashboard Personalization Different
Personalization can be manual, rules-based, or model-ranked. Machine learning is optional and should not be introduced until a simpler preference or rule fails a measured requirement.
Three capabilities set it apart:
Usage analysis: With appropriate consent and retention controls, teams can analyze which views, filters, and workflows are used. The analysis should test a specific design hypothesis and remain scoped to the tenant and purpose.
Contextual defaults: Current account, workflow stage, device, or time window may change a useful default. Context must never widen authorization, and the user needs a visible explanation and reset.
Progressive disclosure: Instead of overwhelming users with every available chart, well-designed systems reveal complexity gradually. Start with high-level summaries. Let users drill down when they need details. Configure default views based on role and refine them based on usage patterns.
This follows the AI analytics guide: define the decision, ground the output, expose uncertainty, and measure the result before automating more of the workflow.
Three Layers Solve Different Problems and Must Not Overwrite Each Other
These layers solve different problems and must not be allowed to overwrite one another:
Layer 1: Authorization Belongs on Trusted Services, Not in the Interface
Roles, attributes, and tenant context define the data and actions a user may access. Enforce this policy on trusted services, not only in dashboard visibility controls.
Authorization can also choose a safe initial view, but it is not evidence that every user with the same role has the same task.
Layer 2: A Preference Is Something the User Chose, and Said So
Let users save a layout, filter, time range, notification, or export preference when the workflow benefits from persistence. Explicit choices are usually clearer than inferred intent.
- Show what has been saved and for which scope
- Provide reset and delete controls
- Define retention and synchronization behavior
- Preserve accessible navigation when layout changes
Telemetry can identify candidates for a better default, but a preference should not be silently inferred from one or two interactions.
Layer 3: Adaptation May Reorder Permitted Views, Never Widen Them
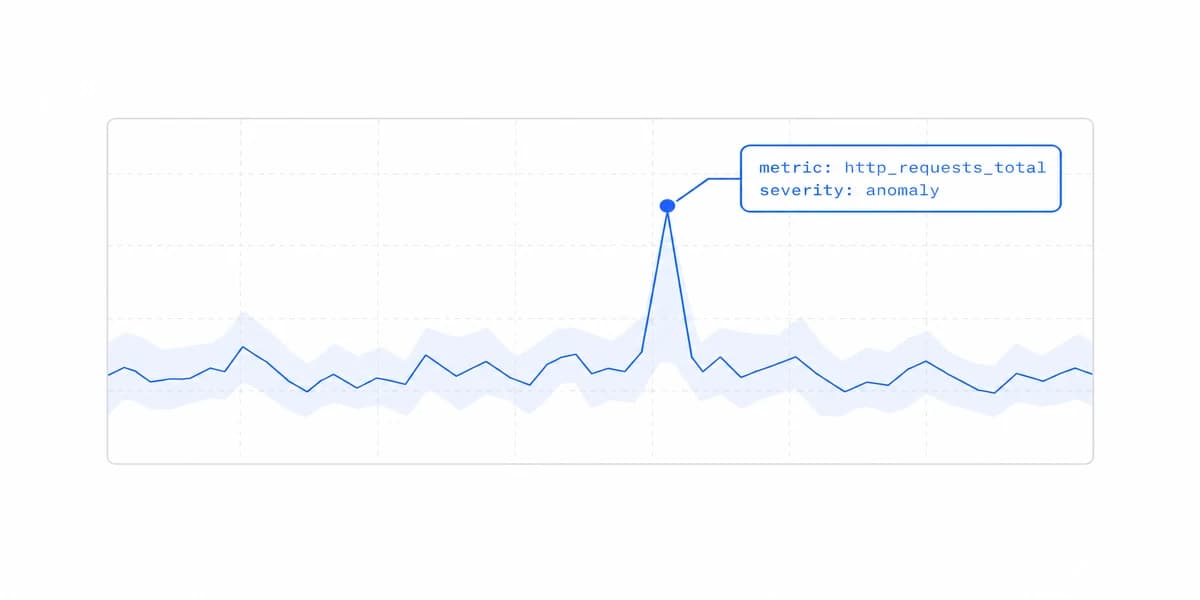
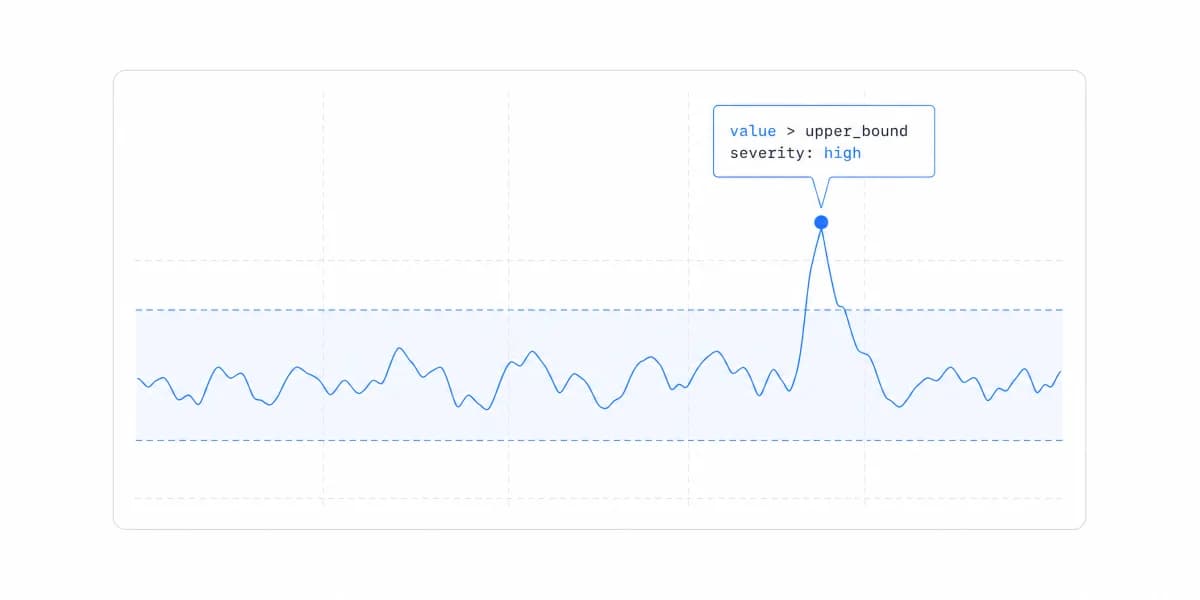
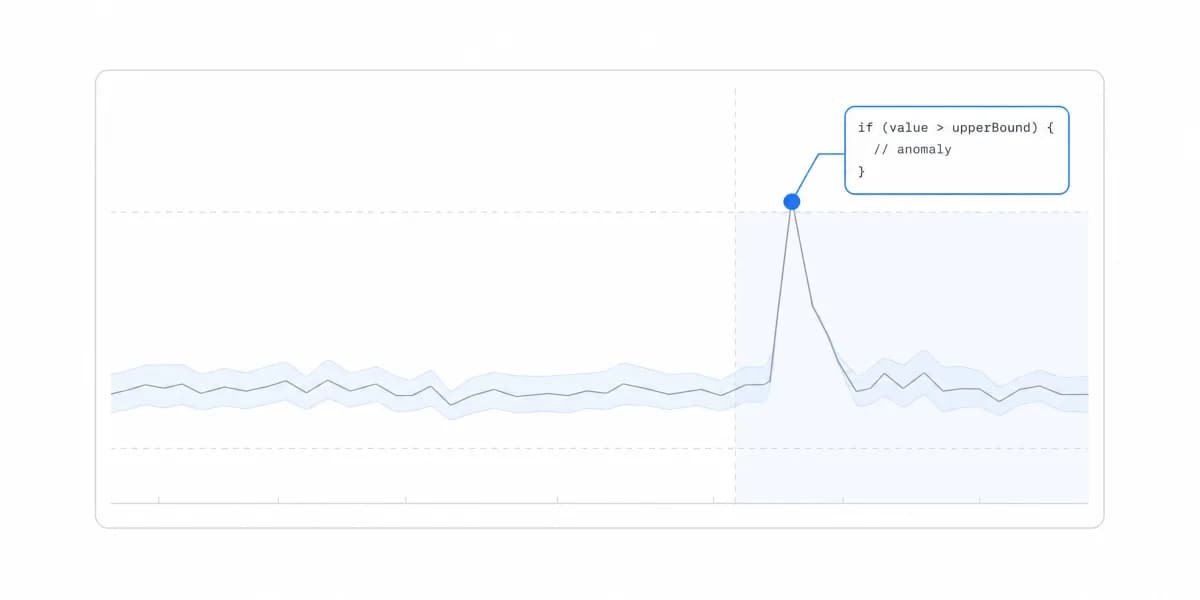
An adaptive layer may rank permitted views or an automated insights dashboard may flag a defined condition. Specify the baseline, threshold or model, evaluation window, false-positive cost, owner, explanation, and fallback. A statistical change is not automatically important and an alert is not automatically actionable.
Multi-Tenancy Changes the Data Boundary
In B2B SaaS, the product serves users inside separate customer organizations. Personalization data therefore has tenant, user, purpose, consent, and retention boundaries.
Each tenant may have its own roles, definitions, and workflows. Keep authorization and semantic scope explicit before producing a personalized candidate set.
Multi-tenant isolation must cover queries, caches, feature stores, logs, experiments, exports, messages, and model training or retrieval. Row-level filtering is only one control.
Use scoped credentials, server-side authorization, tenant-aware cache keys, validated messages, least-privilege services, and audit evidence. Verify these controls in the actual embedded architecture.
Cross-tenant learning requires separate approval
Teams building self-service analytics may want to improve defaults from aggregate product behavior. Usage metadata can still reveal sensitive behavior or business context. Define aggregation thresholds, access, retention, opt-out, and security review before any cross-tenant use.
Prefer tenant-local signals for individual personalization. Treat cross-tenant analysis as a different processing purpose with its own privacy, security, and evaluation controls.
Implement in Increasing-Risk Stages
Embedded analytics platforms vary, so verify permissions, saved views, telemetry, filters, alerts, consent, retention, explanations, and tenant controls rather than assuming they are native.
Three Stages, Starting With Defaults and Explicit Preferences
Start with task-based defaults and explicit preferences. Establish a safe view, let users save permitted choices, and test comprehension and task completion.
Analyze consented usage to test a hypothesis. Combine telemetry with qualitative evidence, segment by relevant context, and compare changes against a baseline.
Add adaptive ranking or alerts only where justified. Run offline and controlled evaluations, expose the reason and reset, monitor errors and bias, and retain a deterministic fallback.
Do not make "more personalized" the objective. Optimize a defined user outcome while preserving authorization, privacy, accessibility, predictability, and control.
Measuring Personalization Means Comparing Against the Default, Not Against Nothing
"It improved engagement" is the claim that survives least contact with a second look. The comparison that carries evidence is against the un-personalized default, for the same task, on a comparable population: task completion, time to the answer the user came for, and the rate at which people reset or override what was chosen for them.
That last number is the useful one and the one teams skip. A high override rate says the system is confidently wrong. A rise in session length can mean the same thing, because a user hunting for something they previously found immediately generates engagement while getting a worse product. Decide which direction each metric has to move before the experiment starts.
Predictability Is a Feature, and Personalization Spends It
A dashboard people return to daily earns its speed from muscle memory. They know where the number is. An interface that rearranges itself between visits spends exactly that, and the cost lands hardest on the users who open it most.
Practical limits follow: keep any reordering stable within a session rather than reacting live, make a change visible instead of silent, and keep one reset that always returns the known layout. Where the adaptive layer is uncertain, leaving the default alone is the better outcome, not a missed opportunity.
Personalization Is a Controlled Product Change
Personalization is useful only when it improves a defined task and remains understandable and reversible. Begin with deterministic authorization and explicit preferences; introduce adaptive behavior only when evidence supports the additional data and operating risk.
For teams exploring predictive analytics dashboards, the same foundation applies: define the target, validate against a baseline, preserve tenant boundaries, expose uncertainty, and monitor the outcome after release.
Where to go next
- AI analytics guide: the seven categories of AI analytics and the different question each one answers.
- Agentic Analytics: AI agents that don't just surface insights, they decide and act.
- AI Analytics articles: every article in this cluster.
Ready to launch customer-facing analytics?
Stop losing customers to competitors with better analytics. Sumboard's customer-facing analytics platform lets you launch self-service dashboards in days, not months.