An automated insight is not a highlighted data point with confident prose. It is a claim produced by a system and presented to a person who may act on it. That makes metric meaning, evidence, authorization, uncertainty, and outcome part of the product contract.
The safe sequence is: detect a signal, show what supports it, bound the permitted action, and observe what happens. Our AI analytics guide covers the wider implementation landscape, while the self-service analytics guide covers governed exploration; this article focuses on the automated release path inside a dashboard.
Start With a Question, Not an AI Feature
Do not begin with “find anomalies across every metric.” Begin with a user, decision, and cost of being wrong or late.
Write down:
- the metric, population, segment, period, and owner;
- the baseline or forecast being compared;
- which changes matter to the user's task and why;
- the permitted records and dimensions this identity may inspect;
- what evidence would justify a notification or action;
- the false-positive, false-negative, delay, and attention costs;
- the safe state when data or confidence is insufficient.
An embedded analytics implementation also needs to preserve tenant and role boundaries through caches, links, drill-downs, exports, alerts, schedules, logs, and support tools. Personalization cannot expand the data a user is authorized to see.
Detection Does Not Establish Cause
Automated systems can surface several different claim types:
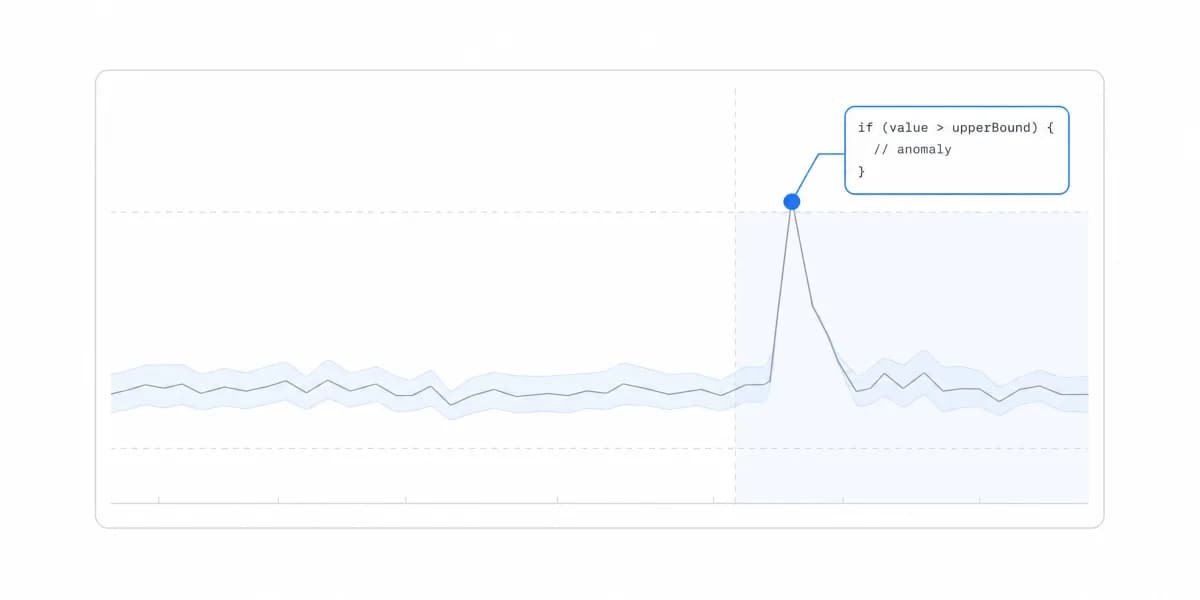
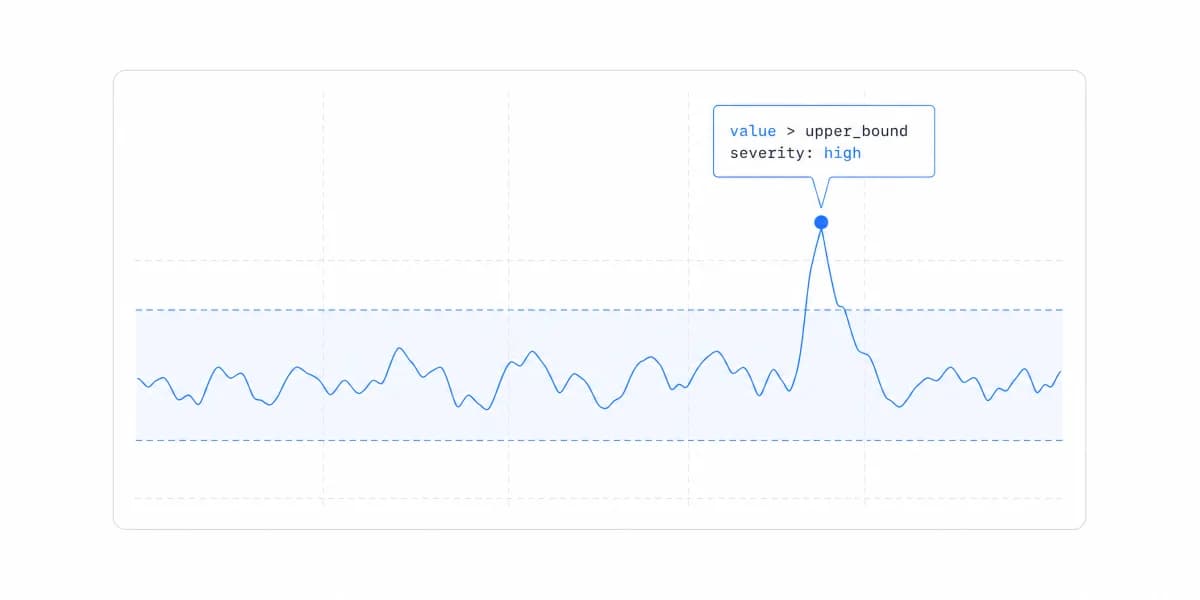
- a threshold or rule was crossed;
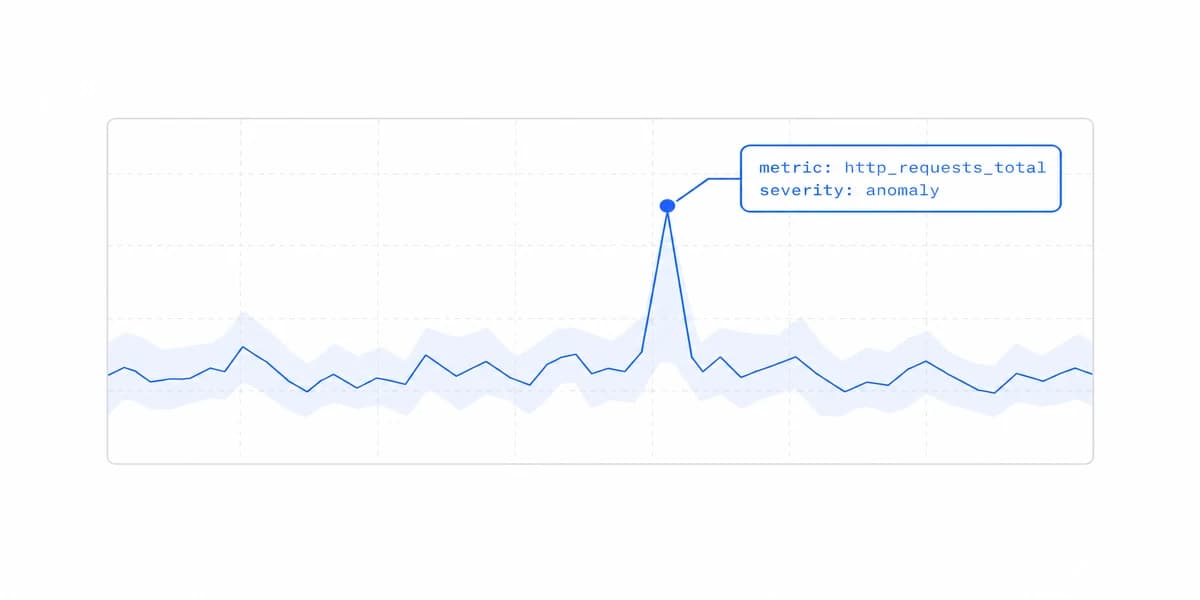
- a value differs from a historical or peer baseline;
- a model scores an event as unusual;
- a segment contributed to an aggregate change;
- variables are associated under a stated analysis;
- a forecast has changed under a model and scenario.
These claims are not interchangeable. “Conversion is below its expected range” does not mean “campaign X caused the decline.” A feature contribution or correlation is not automatically a causal estimate. The interface should label the claim type, method, comparison, magnitude, uncertainty, data window, and limitations, then link to supporting records.
This is one place where augmented analytics needs restraint: automation can reduce search effort, but it can also scale ambiguous definitions, confounding, stale data, or spurious patterns.
Make Abstention a Product State
A system should be able to say “not enough evidence,” suppress a result, or route it to review. Common reasons include:
- missing or stale source data;
- an unapproved metric or comparison population;
- too little data for the stated method;
- unstable behavior across relevant segments;
- unauthorized supporting records;
- an unsupported causal explanation;
- no safe, owned, or reversible next action.
Do not replace absence of evidence with generic language from an AI model. If generated text summarizes a statistical result, constrain it to the structured evidence and verify that it does not invent a cause, recommendation, customer identity, or certainty level.
Design the Insight Card as Evidence
Color and placement can direct attention, but the insight must remain understandable without color alone. A useful card or annotation should expose:
- What changed: metric, direction, magnitude, unit, period, and segment.
- Compared with what: target, prior period, peer group, forecast, or model baseline.
- How it was detected: rule, statistical method, model, and applicable version.
- How certain it is: interval, score meaning, sample limitations, and stability where relevant.
- What supports it: permitted records, drivers, events, and data-quality state.
- What is not known: alternatives, excluded factors, and whether cause is unestablished.
- What can happen next: an owned, authorized, preferably reversible action or review.
Match the evidence to the relevant dashboard type. An operational alert may emphasize timeliness and escalation; an executive review may emphasize definition, comparison, and uncertainty; a customer-facing surface may emphasize account scope, plain language, and support.
There Is No Defensible Rule for Showing Three Insights, or Five
There is no defensible universal rule to display three, five, or any other fixed number of insights. Prioritization should combine signal quality, user relevance, decision consequence, recency, novelty, actionability, and attention cost.
Define collision behavior when several signals compete. Related detections may need one grouped incident instead of repeated notifications. A severe but uncertain signal may require human review rather than a prominent customer recommendation. A low-consequence informational change may stay in a feed instead of interrupting the workflow.
AI-powered analytics should also respect explicit user controls: notification preferences, mute and reset, explanation access, feedback, and a way to report an incorrect or harmful result.
Keep Actions Bounded and Reversible
An insight should not imply that immediate action is always correct. Name the authorized owner, the action scope, prerequisites, approval needs, reversal path, and escalation route.
For example, a demand anomaly might support inspecting inventory and source events. It does not automatically justify changing a price, cancelling an order, or contacting a customer. The next step can be “review evidence” rather than “execute recommendation.”
Predictive outputs require the same discipline. A predictive analytics dashboard should show model version, prediction target, horizon, uncertainty, applicable population, evaluation window, and scenario assumptions. Monitor whether the deployed population and data remain consistent enough for the intended use.
Evaluate the Whole Human-System Path
The NIST AI Risk Management Framework is intended to incorporate trustworthiness considerations across design, development, use, and evaluation. Its companion Playbook organizes suggested actions around Govern, Map, Measure, and Manage rather than treating deployment as the finish line.
For an automated insight, create production-representative tests for:
- metric and source correctness, late and missing data, and definition changes;
- known positive, negative, ambiguous, and no-evidence scenarios;
- false and missed signals, calibration, uncertainty, and subgroup behavior;
- tenant, role, record, export, notification, and support authorization;
- user comprehension, task completion, action correctness, and recovery;
- loading, empty, stale, denial, error, and model-unavailable states;
- accessibility, responsive behavior, latency, workload, and observability;
- drift, incident response, recalibration, rollback, and retirement.
Evaluate outcomes against an appropriate comparison, not just clicks. A clicked insight can still be misunderstood. A dismissed insight can be correct but irrelevant. Support displacement can reveal value or merely move confusion elsewhere.
The Same True Insight, Delivered Weekly, Stops Being an Insight
Correct output has its own failure mode. A system detecting a real, persistent condition will report it on every run, and by the fourth appearance the reader has learned to skip the card. Nothing malfunctioned; the surface simply trained its own audience to ignore it.
Handle repetition as explicitly as accuracy. An insight that has been seen and dismissed needs a state that suppresses it until something changes materially, a condition already known and accepted needs a way to be acknowledged rather than re-reported, and a card that has been shown several times without any action following it is telling you something about the card rather than about the data.
Measure it directly. The rate at which insights are acted on, tracked over weeks, catches this decay while a per-insight accuracy score stays perfect throughout.
Release a Narrow, Owned Loop
Start with one important task and a small set of signals because that makes evidence and ownership tractable, not because a fixed number is inherently optimal. Use representative identities, tenants, data volumes, edge cases, and downstream actions.
An embedded analytics platform can supply parts of the delivery surface, but your team still owns metric meaning, policy, evaluation, action design, customer communication, and release approval. The same is true for a customer-facing analytics product, ours included: native styling and fast rendering do not establish that an insight is true, safe, or valuable.
After release, monitor false and missed signals, overrides, complaints, support cases, incident severity, action results, model and data drift, and unresolved ownership. Keep a kill switch or suppression path appropriate to the risk.
The useful boundary is simple: automation may reduce the work of finding a candidate signal. It does not remove the work of proving what the signal means, deciding who may act, or learning whether the action helped.
Where to go next
- AI analytics guide: the seven categories of AI analytics and the different question each one answers.
- AI Dashboard Personalization: a practical framework for personalizing customer-facing dashboards without confusing behavior.
- AI Analytics articles: every article in this cluster.
Ready to launch customer-facing analytics?
Stop losing customers to competitors with better analytics. Sumboard's customer-facing analytics platform lets you launch self-service dashboards in days, not months.