Your manufacturing customers are asking for production analytics. They want to see OEE trends, quality metrics, and supply chain visibility, not in quarterly PDFs, but in real-time dashboards they can check daily.
If you're running a B2B SaaS platform serving manufacturers, you've probably heard these requests. The question is: do you build analytics in-house for 6-12 months, or find a solution that deploys in days?
Why Production Analytics Visualization Matters Now
Manufacturing analytics isn't new. Factories have tracked metrics for decades. What's changed is how customers expect to access this data.
Three years ago, emailing a monthly Excel report satisfied most customers. Today, they compare your analytics to consumer apps they use personally, Stripe dashboards, Google Analytics, real-time tracking.
They expect:
- Interactive exploration: Drilling down from factory-level OEE to specific production lines
- Real-time updates: Seeing quality metrics as production runs complete
- Mobile access: Checking KPIs from the factory floor, not just desktop
- Custom filters: Segmenting by date range, facility, product line without contacting support
This shift puts B2B SaaS companies in a difficult position. Your customers need production analytics that matches their operational pace.
But building dashboards wasn't in your original product roadmap, and your engineering team is already stretched thin.
What Makes Production Analytics Different
Production analytics has specific requirements that distinguish it from general business intelligence. Understanding these different types of dashboards helps clarify why manufacturers need specialized solutions.
Real-time requirements: Manufacturing doesn't wait. When a production line stops, managers need immediate visibility into OEE drops, not next-day reports. Dashboards that update in real-time become operational tools, not just reporting systems.
Multi-facility complexity: Your customers likely run multiple factories. Each facility has its own production schedules, equipment configurations, and quality standards.
Analytics must handle multi-tenant data isolation while allowing aggregate views across facilities.
Operational context: Production metrics need context. A 75% OEE might be excellent for one product type but concerning for another. Dashboards must present benchmarks, historical trends, and comparative data, not just raw numbers.
Integration requirements: Production data lives across MES systems, ERP platforms, IoT sensors, and quality management tools. Analytics must aggregate data from multiple sources while maintaining accuracy and performance.
These requirements make production analytics more complex than standard dashboards. This is why many B2B SaaS companies struggle when customers request these features. It's not just adding charts to an app.
Key Visualizations Production Teams Need
Based on how manufacturers actually use analytics, these visualizations consistently deliver the most value:
OEE dashboards: Overall Equipment Effectiveness breaks down into availability, performance, and quality. Effective KPI dashboards show not just the percentage, but which factor is driving changes. When OEE drops from 85% to 78%, managers need to see immediately whether it's unplanned downtime, cycle time issues, or quality defects. These key performance indicators form the foundation of operational decision-making.
Quality control metrics: First Pass Yield (FPY), defect rates, and scrap percentages tell manufacturers whether their processes are stable. These metrics often require drill-down capabilities, from facility level to specific production lines to individual operators or machines.
Supply chain visibility: Production delays often start with supplier issues. Dashboards tracking inventory turnover, supplier delivery times, and material availability help prevent production stoppages before they occur.
Predictive maintenance indicators: IoT sensor data reveals patterns before equipment fails. Visualizing vibration levels, temperature anomalies, and performance degradation lets maintenance teams schedule repairs during planned downtime rather than emergency shutdowns. Following dashboard design best practices ensures these complex metrics remain actionable.
For B2B SaaS companies, delivering these visualizations means building not just charts, but a complete analytics experience. This includes filtering, drill-down navigation, export capabilities, and responsive mobile layouts. The scope expands quickly from "adding a few graphs" to a full analytics platform.
Production Analytics Involves Significantly More Than Most Teams Initially Estimate
When customers request production analytics, most B2B SaaS companies face the same calculation. A complete embedded analytics solution involves significantly more than most teams initially estimate.
Building in-house means 6-12 months of development and significant costs, typically requiring senior engineers dedicated full-time. This doesn't include substantial ongoing expenses or the opportunity cost of delaying other features.
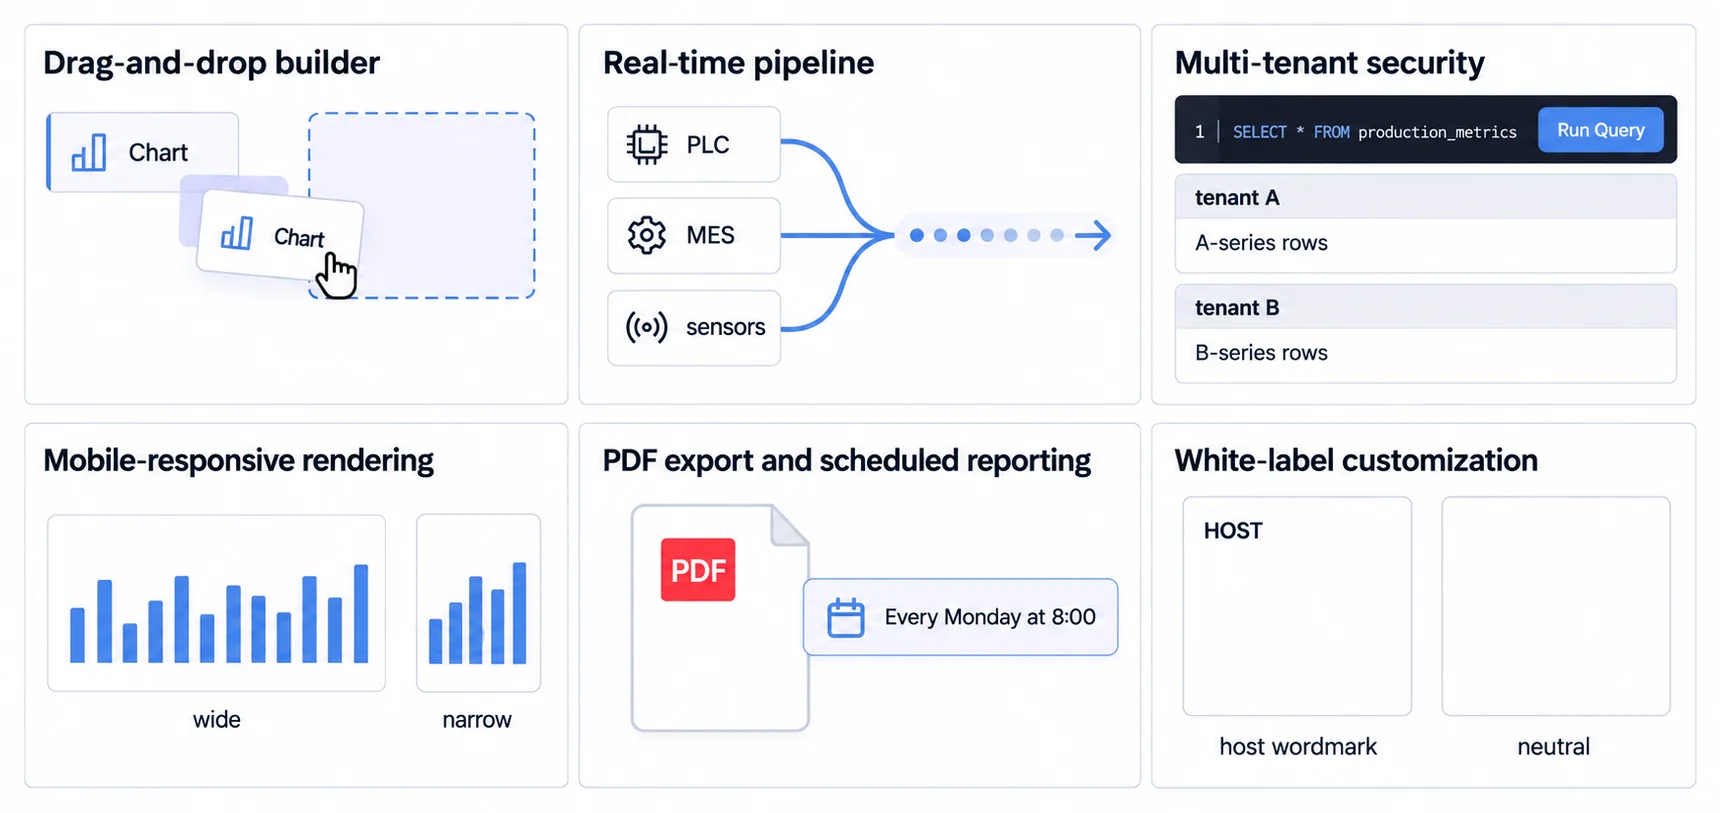
Your team must build:
- Dashboard builder with drag-and-drop configuration
- Real-time data pipeline from multiple sources
- Multi-tenant security with row-level access control
- Mobile-responsive chart rendering
- PDF export and scheduled reporting
- White-label customization for branding
Even after launch, you inherit a permanent maintenance responsibility. Every browser update, every new chart type request, every integration becomes your team's concern.
Embedded analytics platforms change this equation. Instead of building, you integrate an SDK and configure dashboards. For production analytics specifically, this means:
- Deploy production-ready dashboards in days, not months
- Pay €199-€499/month instead of lengthy development cycles
- Minimal maintenance burden, the platform handles infrastructure updates and scaling
- Multi-tenant security built-in
- White-labeled experience matching your brand
For B2B SaaS companies serving manufacturers, an embedded analytics product makes production dashboards a feature you ship this quarter, not next year. Your engineering team stays focused on your core product while customers get the analytics they expect.
The manufacturing analytics space is competitive. Companies that deliver professional, real-time production dashboards gain an edge. Those that promise "coming soon" for multiple quarters lose customers to competitors who shipped already.
Production Data Arrives Late, Out of Order, and Sometimes Twice
Line and machine data rarely behaves like a clean stream. A network drop at a plant produces a backfill an hour later. An operator reclassifies a stoppage after the shift has ended. The same event gets reported by two systems that both believe they are authoritative.
A view that silently recomputes will show a customer a number that changed since they last looked, with nothing to explain it, and that is the fastest way to lose trust in an otherwise correct dashboard. Design for restatement instead: carry an as-of timestamp, mark a period visibly when it is restated, and build aggregates that can be recomputed deterministically rather than incremented in place. Then a changed number is a feature of the system rather than a support ticket.
The Shift Boundary Is Where Most Production Metrics Start Disagreeing
Two systems that agree all day can disagree about a shift total, because they cut the day differently. One uses plant local time and another uses UTC. One attributes a run to the shift it started in, another to the shift it ended in. A site on a rotating schedule has weeks where those two rules do not produce the same answer at all.
None of that is a data-quality problem, it is an undeclared definition. Fix the boundary rule once, write it into the metric definition alongside the source and the grain, and show which rule a number used when a customer asks. That single line prevents most of the reconciliation meetings that follow a production dashboard launch.
The Build or Buy Decision Comes Down to Focus, Not to Capability
Production analytics is no longer optional for B2B SaaS platforms serving manufacturers. Your customers expect interactive, real-time visibility into OEE, quality, and supply chain metrics.
The build vs. buy decision comes down to focus: do you spend months building analytics, or integrate a solution and deliver value this quarter?
Manufacturing dashboard solutions built specifically for customer-facing use cases handle the complexity, real-time updates, multi-tenant security, mobile responsiveness, white-label branding, so you can focus on what makes your product unique.
Your manufacturing customers are asking for analytics now. The question is whether you'll deliver this quarter or next year.
Where to go next
- Chart types guide: more than forty charts grouped by the question each one answers.
- Chart Types: the question is not which charts to support but which questions customers need answered.
- Data Visualization articles: every article in this cluster.
Ready to launch customer-facing analytics?
Stop losing customers to competitors with better analytics. Sumboard's customer-facing analytics platform lets you launch self-service dashboards in days, not months.