Published estimates for building embedded analytics in-house run from $150,000 to about $350,000. Two of them name a first year; the third names only a duration of seven months or more.
Read as a range, that looks like a disagreement about price. Two of the three publish the team they are pricing, and once you divide by it, those two land close together.
The third estimate names no roles, no team size and no scope, so nothing can be divided and no reason for its size can be read off the page. Why it is the largest of the three is not something this article can tell you.
Three Published Figures, and Only Two of Them Say What They Bought
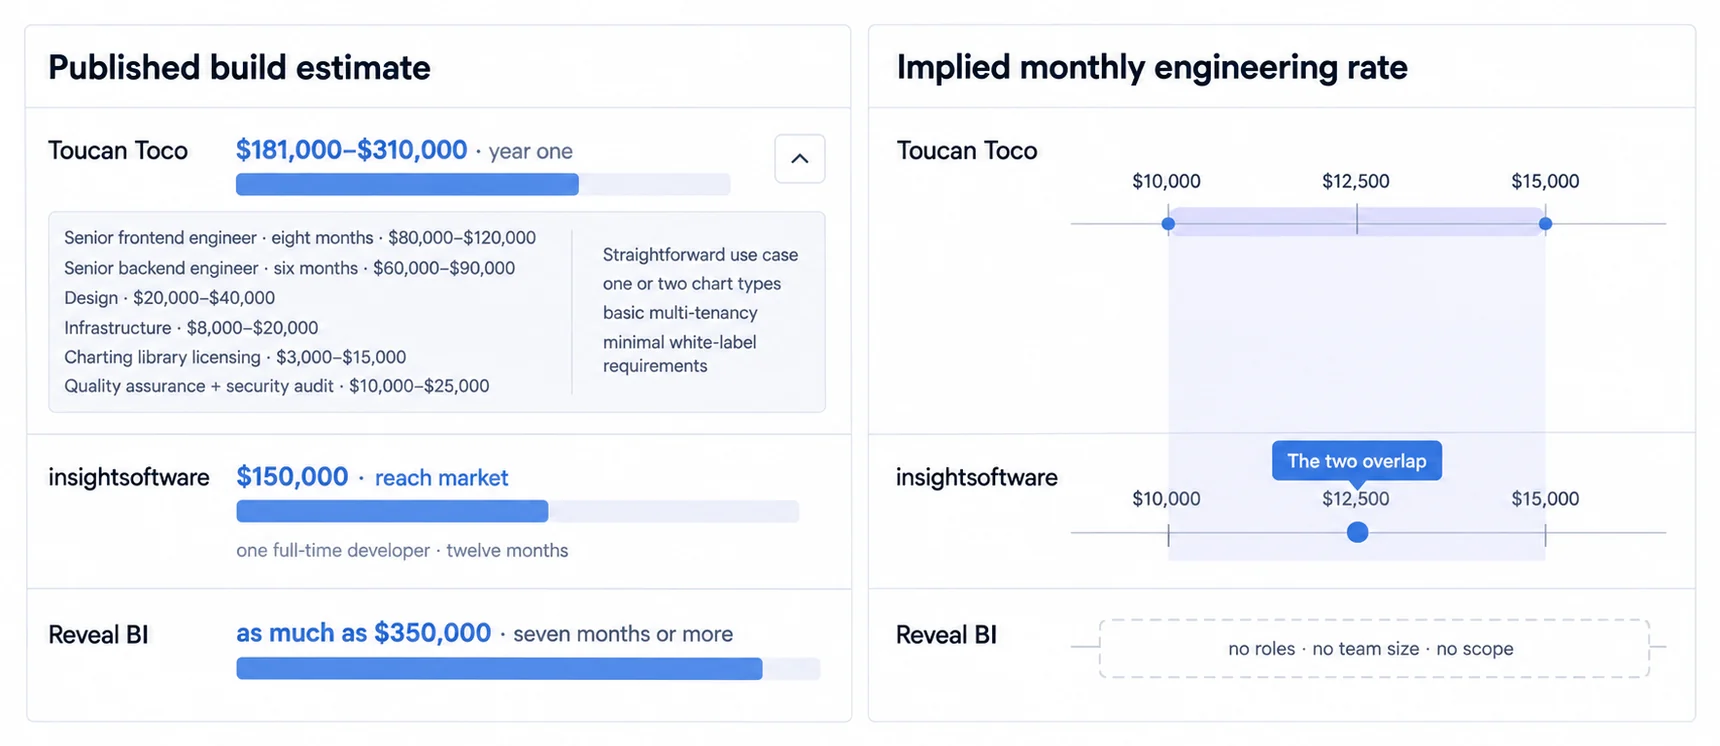
Toucan Toco publishes $181,000 to $310,000 for year one and itemises it: a senior frontend engineer for eight months at $80,000 to $120,000, a senior backend engineer for six months at $60,000 to $90,000, product and UX design at $20,000 to $40,000, infrastructure at $8,000 to $20,000, charting library licensing at $3,000 to $15,000, and QA with a security audit at $10,000 to $25,000. It also publishes the assumption underneath, which is the rarest part: the estimate covers a straightforward use case, which it defines as "one or two chart types, basic multi-tenancy, minimal white-label requirements". (Toucan Toco, Embedded Analytics: Build vs Buy Guide for SaaS, read 20 August 2026.)
insightsoftware prices a different shape of team. Its build scenario is "one full-time developer to go to market in twelve months (equivalent to $150,000)", with "$50,000 annually" for support afterwards. (insightsoftware, Embedded Analytics: Build versus Buy, read 20 August 2026.)
Reveal BI publishes the largest number and the least context: "Building an in-house solution can take seven months or more and is estimated to cost as much as $350k." No roles, no team size, no feature list. (Reveal BI, Embedded Analytics Pricing, read 20 August 2026.)
Divide the Two That Name a Team, and Those Two Nearly Agree
Toucan Toco's senior frontend line is $80,000 to $120,000 across eight months, which is $10,000 to $15,000 per engineer-month. insightsoftware's $150,000 across twelve months is $12,500 per engineer-month.
The second number sits inside the first range. Two independent estimates, published by different vendors for different audiences, agree closely on what an engineer-month costs.
What separates their totals is how many engineer-months each assumes, and whether design, infrastructure, a charting licence and a security audit belong on the bill. That accounts for the gap between those two. It does not account for Reveal BI's figure, which cannot be divided at all.
The Search Results Mix Build Numbers With Buy Numbers
A second reason the range looks incoherent has nothing to do with the estimates themselves.
Search for what it costs to build and the results return licence prices alongside build prices. A page-one LinkedIn article names a fixed annual licence of around $30,000 to $50,000; a page-one community thread reports a base platform around $60,000 a year with viewer seats on top. Those are answers to a different question, and they are not wrong, they are just not build costs.
Keep the two ledgers apart until each is complete. Our own read of nine vendor pricing pages, including what a headline quote leaves out, sits in embedded analytics pricing models, and this page does not repeat it.
Year One Is a Launch Cost, and It Is the Half That Gets Published
Toucan Toco is unusual in publishing the rest: maintenance and bug fixing at roughly half a developer, $50,000 to $80,000 a year; continued feature work at $30,000 to $60,000 a year; infrastructure scaling at $15,000 to $40,000 a year; security and compliance updates at $10,000 to $20,000 a year. Its three-year total is $371,000 to $630,000.
Look at what that does to the shape of the decision. Year one roughly doubles by year three, and most of the added money is upkeep: maintenance, infrastructure scaling and compliance updates. One line is not upkeep, and Toucan Toco separates it out: $30,000 to $60,000 a year of continued feature work.
Read the split before you decide whether the total is reasonable. An analytics feature that ships without a named owner for year two is not a cheaper build, it is a deferred one, and the deferral shows up as a browser upgrade that breaks a chart no one is rostered to fix.
Seven Components Sit Behind Any Honest Total
The list below is the union of what the two scoped estimates count. Write your own number against each line, and leave a blank rather than a guess where you cannot.
- Frontend engineering. Chart rendering, layout, responsive behaviour, and the interaction states.
- Backend engineering. Query execution, the tenant filter, aggregation, and the API your frontend calls.
- Design. The part most often assumed to be free because a designer already works on the product.
- Infrastructure. Development, staging and production, and the bill grows with data rather than with users.
- Charting library licensing. Toucan Toco puts this at $3,000 to $15,000, which surprises teams who assumed open source throughout.
- QA and security audit. The line that separates an internal tool from something a customer's security team will review.
- Ongoing ownership. Maintenance, scaling and compliance updates, which do not appear in any year-one figure.
Two of the seven get forgotten most often: the charting licence and the security audit. Both are also the two a buyer's procurement process asks about first.
What This Page Could Not Verify
One source that ranks on page one for this query could not be read: Draxlr's pricing comparison returned a 404 at the URL Google is currently serving. No number from it appears above.
A second page-one result, a Reddit thread reporting a base platform price of around $60,000 a year, was read but is a community report rather than published vendor pricing. It is cited above in that category and nowhere else.
The distinction is the point of this section. A build estimate you cannot open is not evidence, and a range built from unopened sources is a wider range that feels better researched.
Count Engineer-Months First, Then Apply Your Own Rate
The practical order is the reverse of how most teams do it.
Decide the team shape and the duration before touching money: how many engineers, for how long, against a written feature list and a tenant count. Then apply your own loaded cost per engineer-month, which you already know and no vendor does.
An estimate built that way is comparable to the published ones instead of competing with them. It also puts your least certain assumption, which is usually duration, on its own line where somebody can argue with it.
The number that matters is not on any of these three pages, because none of them knows your feature list. They give you two things instead: a defensible rate, and a checklist of what a total should contain. Take both into the same sheet you use to price any embedded analytics product, at the same scope and the same three-year window.
Where to go next
- Embedded analytics pricing models: nine vendor pricing pages read on one day, and what a headline quote leaves out.
- Embedded analytics ROI: which outcomes actually move, and the baseline you need before any of it counts.
- Embedded analytics guide: the three routes to shipping it, and what each one leaves you owning.
- Embedded Analytics articles: every article in this cluster.
Ready to launch customer-facing analytics?
Stop losing customers to competitors with better analytics. Sumboard's customer-facing analytics platform lets you launch self-service dashboards in days, not months.