This guide compares six JavaScript visualization options without pretending that star ratings or one vendor's point-count demo form a benchmark. D3 is a low-level toolbox. Apache ECharts and Chart.js document Canvas-oriented rendering controls. Recharts composes React components into SVG. Highcharts combines a commercial licence with an optional Boost renderer. ApexCharts combines framework wrappers and data reduction with a dual-license boundary. Shortlist by documented capability, then decide with the same production-shaped fixture.
Building a production visualization involves more than drawing the first line or bar. A charting library can supply scales, marks, layouts, rendering, and interaction primitives, but the team still owns the data contract, responsive behavior, accessibility, performance budget, failure states, and upgrade path.
This guide covers six major JavaScript charting libraries with analysis for developers building dashboards, embedded analytics platforms, or data-intensive applications. Different libraries serve different use cases, and understanding the trade-offs matters more than finding a single "best" solution.
What are JavaScript Charting Libraries?
JavaScript charting libraries are pre-built code frameworks that abstract away low-level chart rendering. Instead of manually calculating coordinates, drawing SVG paths, or managing canvas rendering contexts, developers use declarative APIs. Define data and configuration objects, and the library handles the visual output.
A code framework that abstracts low-level chart rendering into declarative APIs, allowing developers to create data visualizations by defining data and configuration objects rather than manually managing SVG paths, canvas contexts, or coordinate calculations.
The evolution from early jQuery plugins to modern React-compatible, TypeScript-ready libraries reflects broader shifts in web development. Modern options expose different integration models: native framework components, wrappers around an imperative core, or low-level modules a framework can compose. Server rendering, hydration, and responsive behavior still need verification for the chosen library and configuration.
The spectrum runs from higher-level libraries that provide chart types and defaults to low-level toolboxes such as D3 that expose scales, shapes, layouts, selections, and rendering choices. The prototype reveals how much default behavior the team keeps and how much it must own.
A dashboard displaying data visualization needs the right rendering foundation, whether that's a simple internal tool or a customer-facing analytics product.
Six Advantages Justify a Library Over a Custom Implementation
Modern charting libraries deliver six core advantages that justify their adoption over custom implementations.
Rapid development: Libraries provide scales, axes, legends, interaction states, and responsive behavior as maintained primitives. Configuration objects replace bespoke rendering logic, so the team can spend its time on the data model and the decisions the chart must support.
Cross-browser implementation: Libraries centralize renderer work and browser fixes, but support matrices and rendering paths differ. Exercise the browsers and devices in the product contract rather than inferring compatibility from a demo.
Responsive primitives: Many libraries expose container, resize, or breakpoint mechanisms. The application still has to define what changes on a narrow screen, how labels truncate, which interactions replace hover, and whether the chart or its wrapper owns resize observation.
Accessibility hooks: Output models differ sharply. SVG can expose elements to the accessibility tree; Canvas needs an accessible name and equivalent fallback content; some libraries add keyboard or description modules. Verify the rendered result with keyboard and assistive technology instead of treating an accessibility feature list as conformance.
Animation and interactivity: Libraries can provide transitions, tooltips, zoom, and pan, but each behavior adds state, input, and performance obligations. Prototype the interactions the product actually needs, including touch and keyboard equivalents.
Maintenance surface: Documentation, examples, releases, issues, and support channels reduce discovery work, but they do not guarantee that the product's exact combination has been solved. Record the version, relevant open issues, upgrade path, and an internal owner.
The Canvas and SVG Difference Decides How a Library Scales With Data Volume
The fundamental rendering difference between canvas and SVG determines performance characteristics and integration complexity. This choice affects how libraries scale with data volume.
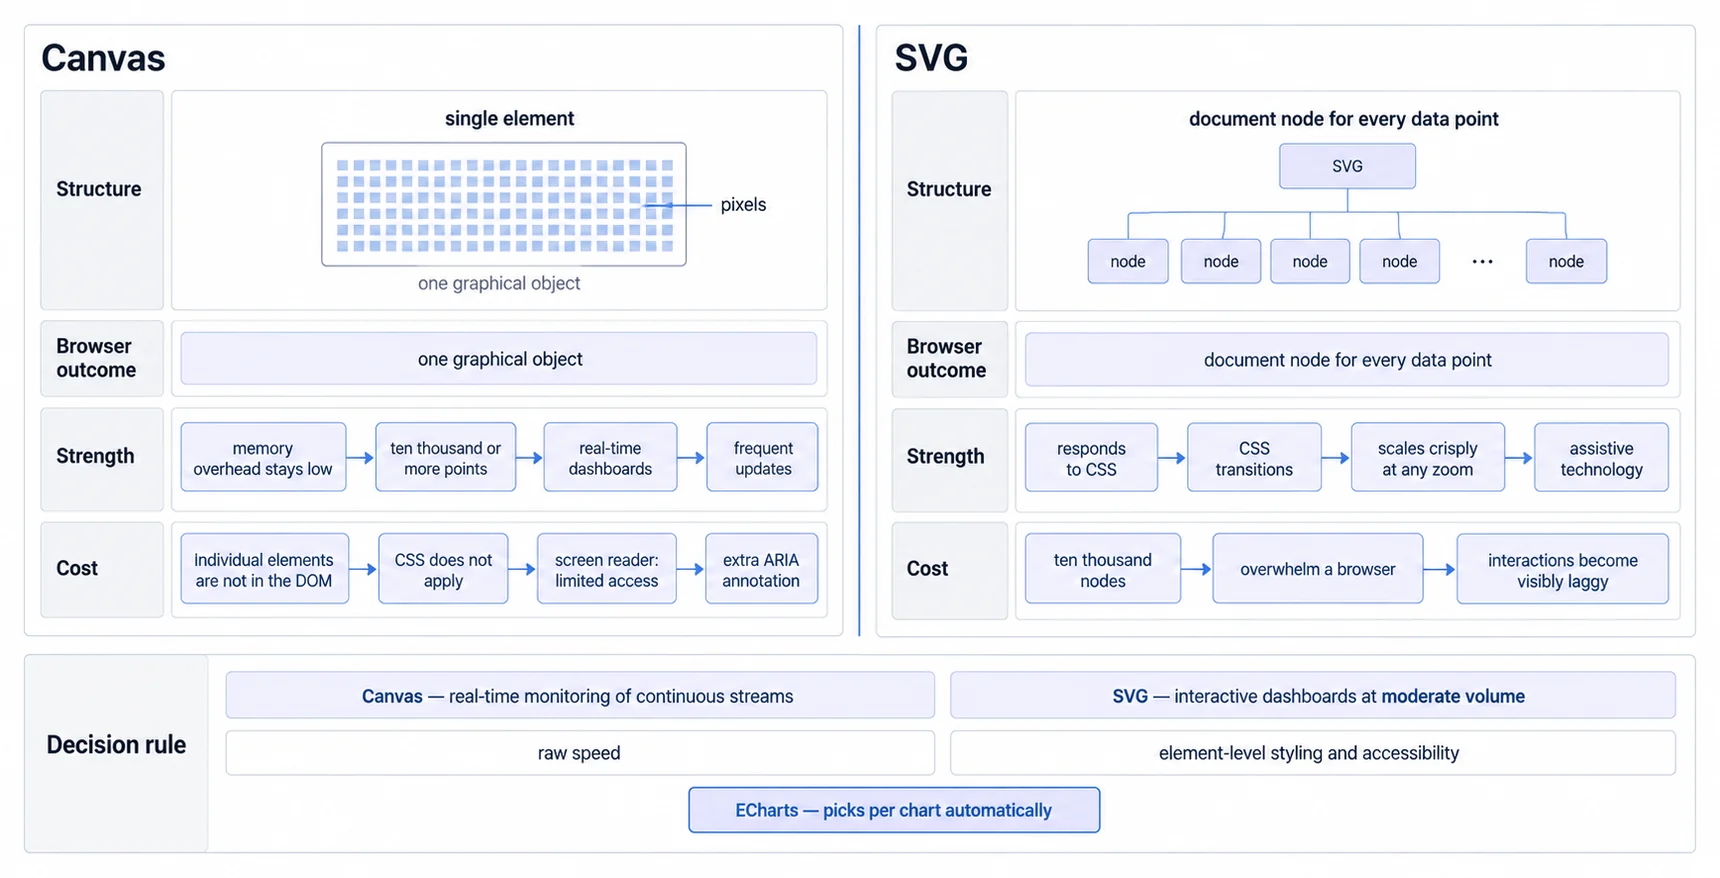
Canvas rendering: Pixel-based, painting into a <canvas> element. The browser does not retain one DOM node for every visual mark, which can help dense scenes. The trade-off is that individual marks are not normal DOM elements: CSS cannot target them directly and assistive technology needs equivalent accessible content.
SVG rendering: Element-based and resolution-independent. Marks can be inspected, styled, and exposed as document elements. Its cost follows the actual element tree and update work, so dense or frequently changing scenes need measurement rather than a fixed point-count cutoff.
Apache ECharts supports both Canvas and SVG, but the renderer is selected when the chart is initialized; it is not an automatic cross-library verdict. Its renderer guide explicitly makes environment, data volume, and functional requirements part of the decision.
Decision rule: Treat renderer as a hypothesis. Run the same fixture on the target device and browser, record render and interaction budgets, inspect accessibility output, and verify export or print requirements. Choose the path that passes those acceptance tests.
How to Choose a JavaScript Charting Library
Selection frameworks help work through dozens of library options. Ask these questions before committing to a specific library.
Team skill and ownership: High-level chart APIs provide more defaults; low-level toolboxes expose more decisions. Compare the time to build and maintain the same fixture with the actual team rather than importing a generic learning-duration estimate.
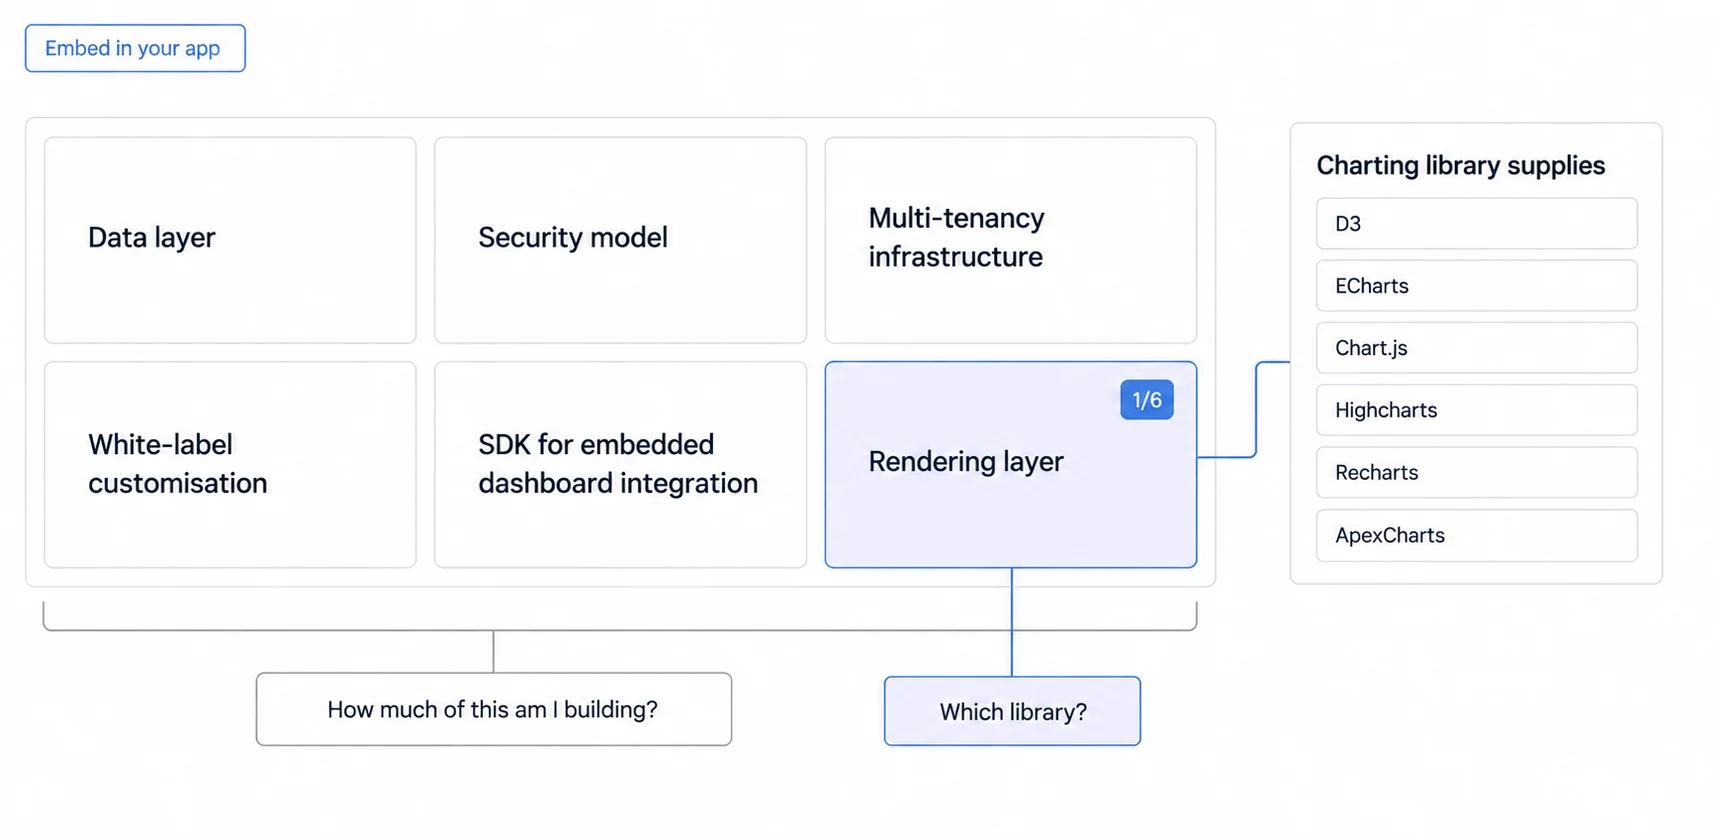
Embedded analytics requirements: Building customer-facing dashboards changes the selection criteria. Libraries solve the rendering layer; the product still needs data contracts, identity, tenant authorization, white-label analytics surfaces, responsive and accessible states, operations, and an integration boundary.
Data and interaction scale: Record chart type, number of series and marks, update cadence, interaction behavior, device, browser, memory ceiling, and acceptable latency. Point count without those fields is not a comparable workload.
Update requirements: A stream transport does not decide renderer performance. Prototype the complete update path, bound the retained window, record allocation and cleanup, and test interaction while updates are arriving.
Framework alignment: React-native libraries, third-party wrappers, official wrappers, and direct imperative integration create different ownership boundaries. Verify wrapper maintenance, version compatibility, lifecycle cleanup, SSR behavior, and the escape hatch for custom rendering.
Commercial boundary: D3, Apache ECharts, Chart.js, and Recharts publish open-source licences. Highcharts publishes separate Internal and SaaS scopes. ApexCharts uses Community, Commercial, and OEM boundaries rather than an unconditional open-source grant. Record the exact product, organization, developer, external-application, and redistribution scope before comparing cost.
Framework Integration Patterns Vary, and React's Virtual DOM Is Why
Framework integration patterns vary significantly. React's virtual DOM creates specific challenges and opportunities for chart library integration.
React developers should evaluate three integration approaches. React-native libraries such as Recharts expose JSX components. Wrapper packages can expose component APIs over an imperative core, but provenance and version support vary. Direct integration gives the application explicit lifecycle ownership. Prototype the selected package rather than transferring the core library's reputation to its wrapper.
The React chart libraries guide covers React-specific integration patterns in depth. For Vue and Angular, framework-compatible components reduce integration friction significantly compared to manual wrapper development.
Performance Requirements Shape Library Selection More Than Feature Checklists
The same point count can produce different results when chart type, number of series, renderer, labels, interaction, update cadence, device, or browser changes.
Test performance with realistic data volumes before architectural commitment. Create dashboards with maximum expected data points (not average). Measure render time, interaction responsiveness, and memory usage. Many projects choose libraries based on small demos, then discover performance issues under production load.
Real-time analytics introduces additional complexity. Define the actual update interval, retained window, latency budget, and interaction contract, then test them together. A library name is not evidence that the chosen update path stays responsive.
Comparison Overview: 6 Major Libraries
Define the representative visual and interaction first; the chart types guide separates comparison, trend, distribution, composition, and relationship questions before a rendering library enters the decision.
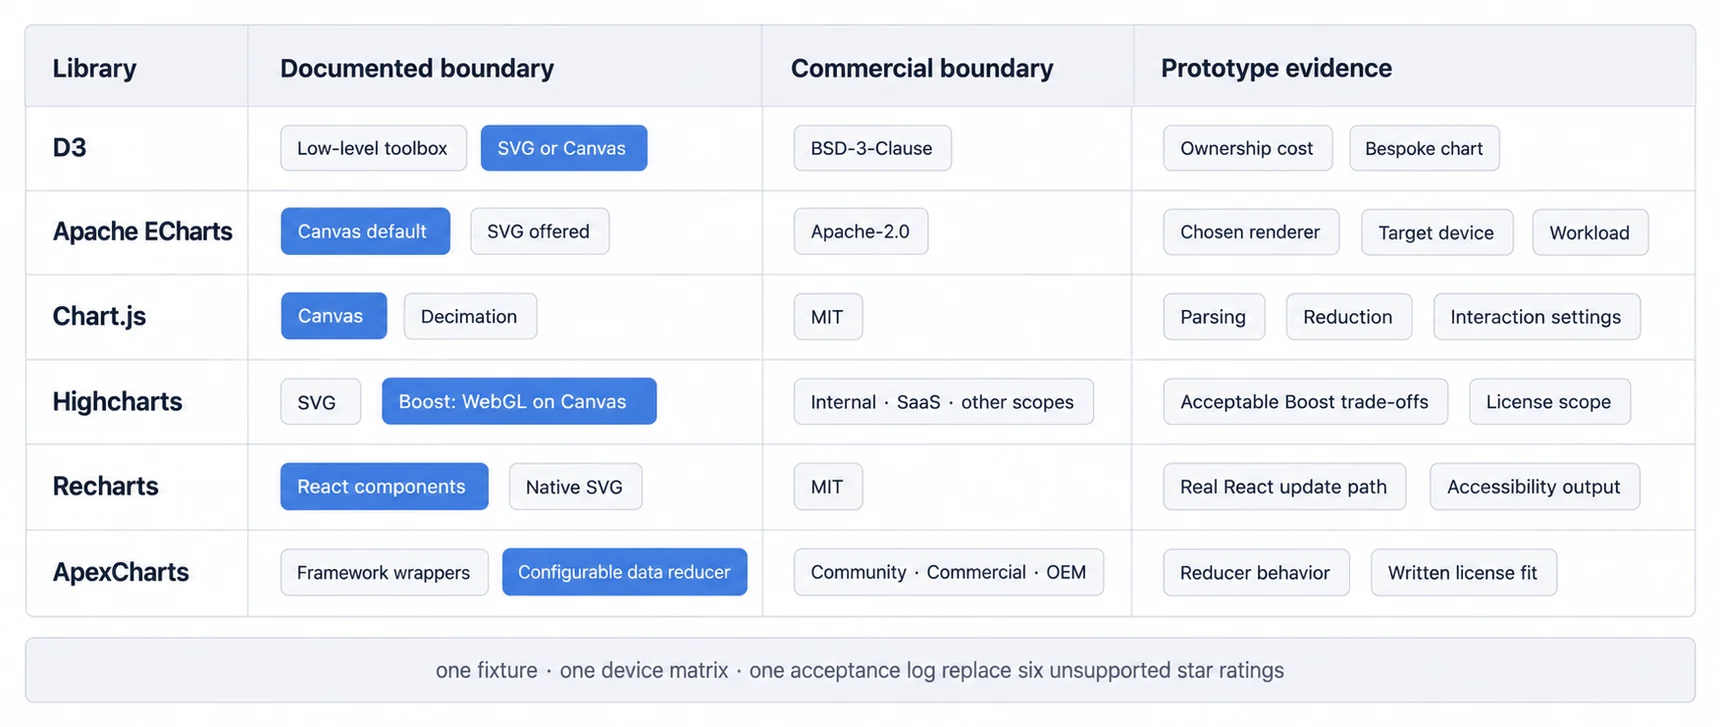
The old comparison mixed learning-time guesses, unexplained star ratings, bundle sizes without version or import path, and performance grades without a fixture. Those numbers looked comparable but were not measurements. The replacement records only documented product boundaries and the evidence a representative prototype must produce.
| Library | Documented boundary | Commercial boundary | Prototype evidence |
|---|---|---|---|
| D3 | Low-level modules used with SVG or Canvas | BSD-3-Clause | Ownership of the bespoke rendering and framework boundary |
| Apache ECharts | Canvas default; SVG selectable | Apache-2.0 | Chosen renderer on target devices, interactions, and export path |
| Chart.js | Canvas with documented parsing, normalization, and decimation controls | MIT | Prepared-data path, reduction settings, accessibility fallback, and update budget |
| Highcharts | SVG structure; Boost uses WebGL on Canvas with feature trade-offs | Internal, SaaS, and other scopes | Boost acceptance, required modules, support terms, and written licence fit |
| Recharts | Declarative React components using native SVG | MIT | Real React lifecycle, responsive behavior, output semantics, and dense-scene limit |
| ApexCharts | Framework wrappers and a configurable data reducer | Community, Commercial, and OEM scopes | Reducer behavior, accessibility output, wrapper lifecycle, and written licence fit |
This table is a shortlist, not a verdict. Run one fixture containing the hardest representative chart, real labels, responsive states, keyboard and touch interaction, an update path, an export or share path where required, and failure or empty data. Record the library version, import path, optional modules, compression, browser, device, dataset shape, and acceptance budgets.
D3.js: Low-Level Composition and Explicit Ownership
D3.js (Data-Driven Documents) is a low-level visualization toolbox. Where higher-level libraries provide chart types, D3 provides modules that can be composed into a custom rendering path. That flexibility also leaves more behavior under application ownership.
Core philosophy: D3 binds data to DOM elements, then applies transformations based on data values. Instead of saying "create a bar chart," developers say "select these elements, bind this data, set attributes based on data values, handle enter/update/exit cycles." This declarative approach provides control over every pixel but requires understanding data binding, selections, scales, and SVG fundamentals.
When D3 excels: Unique visualizations that predefined libraries cannot create. Network diagrams, force-directed graphs, custom interactive maps, geographical visualizations with projection transformations, complex hierarchical displays. If design requires visual elements not provided by standard chart libraries, D3 likely provides the primitives needed.
D3 also suits scenarios requiring direct control over animations, transitions, or interactions. Its selections, transitions, scales, shapes, layouts, and other modules can be composed for bespoke work. The data visualization best practices guide covers the visual decisions that still remain under application ownership.
Performance characteristics: D3 does not impose one chart abstraction or renderer. Its official description says modules can be used with SVG and Canvas. Performance therefore belongs to the composition the team builds: element count, drawing path, interaction index, updates, and retained data all need measurement. The D3.js dashboard development guide covers that ownership boundary.
React integration boundary: Some D3 modules transform data; selections and transitions can mutate the DOM. React can own the elements while D3 computes scales and paths, or a contained component can give D3 ownership of a subtree. The React dashboard components article compares those boundaries. Test updates, cleanup, hydration, and event ownership instead of calling the integration inherently good or bad.
D3 exposes primitives rather than a finished chart contract. That can be the right choice for a bespoke visual, but the prototype must include the work that a higher-level library would otherwise own: axes, responsive behavior, interaction states, accessibility, tests, and maintenance. Measure that work with the team that will carry it.
Typical use cases:
- Custom data visualizations for editorial/journalistic projects
- Academic research requiring novel visualization techniques
- Marketing websites with unique interactive data stories
- Internal tools where bespoke rendering justifies the ownership work
- Geographic visualizations with custom projections
Avoid D3 when:
- Team lacks senior JavaScript developers
- Timeline requires rapid implementation (weeks, not months)
- Visualizations fit standard chart types (line, bar, pie, scatter)
- React/Vue/Angular integration matters more than customization
- Maintenance burden of custom code exceeds library limitations
Apache ECharts: Selectable Renderer and Broad Series Surface
Apache ECharts is an Apache-licensed, framework-agnostic charting library with Canvas and SVG renderers, a broad series catalogue, themes, interactions, and progressive or large-data options for supported series.
Renderer controls: Apache ECharts uses Canvas by default and lets the application select SVG at initialization. Its official renderer guide describes trade-offs and treats its point-count guidance as experience rather than a guarantee. That makes ECharts a candidate for dense scenes, not an automatic winner without the target fixture.
The ECharts dashboard guide discusses progressive rendering as one available implementation path. Verify which series supports it, how partial rendering affects interaction, and whether the observed behavior meets the product's latency and completeness contract.
Chart type coverage: ECharts documents standard business charts, statistical and financial charts, graphs, trees, geographic views, and specialized series. Check the exact series, interaction, renderer, and accessibility behavior required by the product; a catalogue count does not establish fit.
Theme system and white-labeling: ECharts exposes theme and option configuration for visual properties. A white-label acceptance test must still inspect every required state, tooltip, control, export, loading and error surface; chart theming alone does not complete the product's brand contract.
Use cases for embedded analytics: ECharts provides strong foundation for B2B SaaS companies embedding analytics in products. The combination of performance at scale, extensive chart types, and white-label theming addresses typical customer-facing requirements. However, embedded analytics requires more than visualization library.
Building customer-facing analytics, whether on your own stack or on a customer-facing analytics product like ours, demands complete infrastructure: multi-tenant analytics architecture with data isolation, multi-tenancy support handling variable customer scale, row-level security preventing data leakage between customers, SDK integration for embedding in customer applications, dashboard builder enabling customer customization, scheduled reports with branded PDF exports.
ECharts can supply the visualization layer. Identity, tenant authorization, data contracts, authoring, sharing, exports, and operations remain separate requirements. This boundary is part of the build vs. buy embedded analytics decision for B2B SaaS companies.
Framework integration: The core API is framework-agnostic. React, Vue, and Angular teams can use wrappers or own a direct lifecycle integration, but wrapper provenance, maintenance, version compatibility, resize handling, cleanup, and SSR behavior must be checked independently from the ECharts core.
TypeScript support: ECharts publishes TypeScript definitions. Validate the exact option surface and wrapper types used by the prototype rather than turning type presence into a star rating.
Licensing and support: ECharts publishes under Apache-2.0. Record the version, dependencies, notices, maintenance channel, and internal owner as part of adoption review.
Typical use cases:
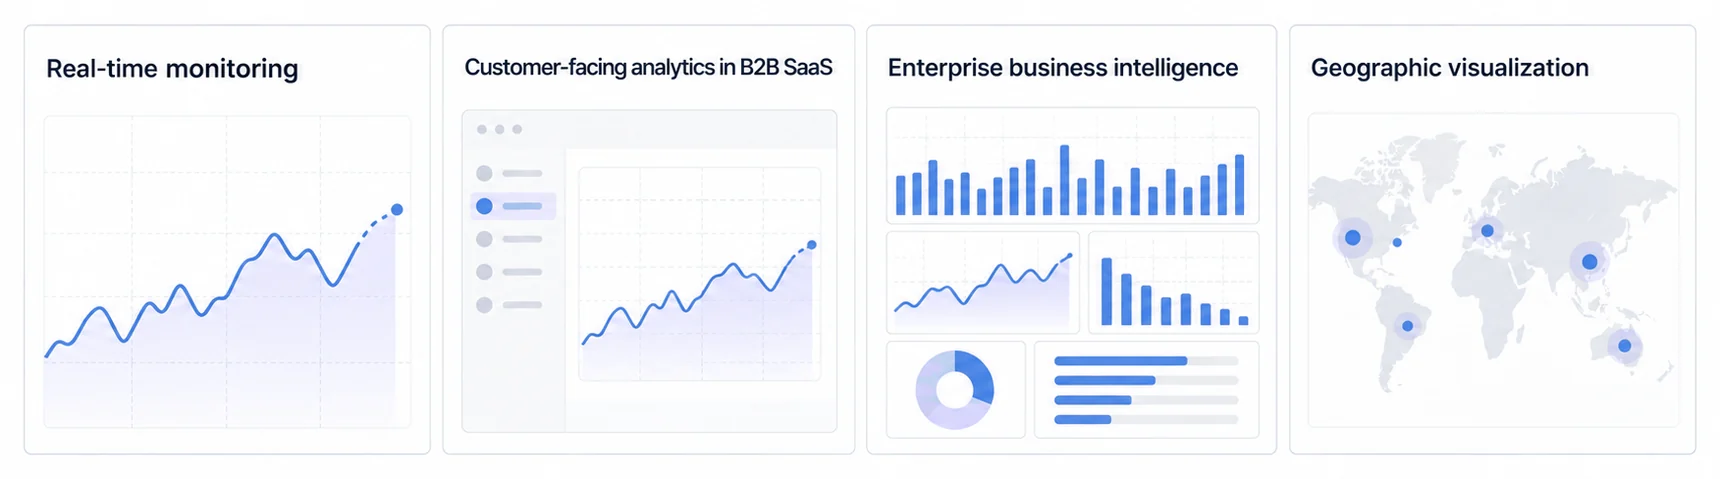
- Real-time monitoring dashboards (server metrics, IoT sensors, financial tickers)
- Customer-facing analytics in B2B SaaS products
- Enterprise business intelligence dashboards
- Data-intensive applications whose representative fixture passes on target devices
- Geographic visualizations (choropleth maps, scatter on maps)
Avoid ECharts when:
- A smaller dependency or simpler API passes the same product contract
- Team unfamiliar with JavaScript configuration objects
- The measured production import exceeds the agreed JavaScript budget
- React-native development experience more important than performance
- Simple chart requirements don't justify learning curve
Chart.js: Configuration-Driven Canvas Charts
Chart.js provides standard chart types through a configuration-driven Canvas API. Its fit depends on whether that API and its plugin model express the representative chart without excessive application-owned work.
Configuration-driven API: Chart.js defines chart types, data, scales, plugins, and interaction through configuration. Its documentation includes runnable examples, but time to production depends on the team's real requirements: data preparation, responsive states, accessibility fallback, plugins, tests, and framework lifecycle.
Chart type coverage: Eight core types (line, bar, radar, pie, doughnut, polar area, bubble, scatter). Sufficient for most business dashboards displaying various dashboard types. The library doesn't attempt exotic visualizations, it executes standard charts exceptionally well.
Performance controls: Chart.js renders to Canvas. Its performance guide documents prepared internal data, disabled parsing, normalized data, decimation, fixed scale ranges, animation controls, and OffscreenCanvas workers. Those controls make a credible prototype possible; they do not create a universal point limit or cross-library ranking.
Responsive and accessible implementation: Chart.js provides responsive configuration, while a Canvas still needs an accessible name and equivalent fallback content. Its accessibility guidance describes ARIA and fallback approaches. Verify resize behavior, focus flow, textual equivalence, and color use in the product context.
React integration: react-chartjs-2 is a separate wrapper package over Chart.js. Verify its supported Chart.js and React versions, lifecycle, tree-shaken registration, update behavior, cleanup, and SSR path as its own dependency.
Plugin surface: Chart.js exposes a plugin API. Treat every required plugin as a dependency with its own licence, version compatibility, maintenance, accessibility, bundle, and interaction implications.
Standard business dashboards with familiar chart types are a sensible prototype target. Decide from the observed fixture rather than a generic data-volume or team-seniority threshold.
Licensing and support: Chart.js publishes under MIT. Record the adopted version, plugin dependencies, maintenance path, and internal owner. See the Chart.js tutorial guide for an implementation walkthrough.
Typical use cases:
- Internal business dashboards (sales, marketing, HR metrics)
- Startup MVPs requiring rapid implementation
- Educational projects or tutorials
- Simple data presentations in web applications
- Situations prioritizing speed over customization
Avoid Chart.js when:
- Custom visualizations beyond standard types required
- The representative dense-data fixture misses its render or interaction budget
- Real-time updates demand sub-second performance
- Unlimited customization more important than ease of use
- Enterprise-scale performance requirements exist
Highcharts: Commercial Scope and an Optional Boost Path
Highcharts represents the explicitly commercial option in this comparison. The purchase decision is a combination of required modules, developer seats, application scope, support terms, and whether the product needs Internal, SaaS, SaaS+, OEM, or custom rights.
Licensing model: The Highcharts shop listed Highcharts Core at $185 per seat annually for Internal use and $366 per seat annually for one SaaS External Application when checked on 2 August 2026. The same page says additional external applications, customer-hosted installations, larger teams, optional products, and custom terms can change the required scope. Price the actual deployment and retain the written licence statement; do not reuse the previous $160/$788 model.
Product surface: Highcharts documents Core plus separate Stock, Maps, Gantt, Dashboards, Grid, and integration products. Record which products and modules the fixture actually imports, how export is implemented, and which accessibility module and output the application uses.
Support and maintenance: Annual and perpetual purchase paths include different use and support conditions. Obtain the applicable support terms and response commitments in writing rather than assuming a generic SLA from the commercial label.
Performance path: Standard Highcharts content uses SVG. The Boost module renders supported series through WebGL on Canvas and skips or simplifies work, with documented interaction and visual limitations. Test both the threshold transition and the features that disappear in Boost mode; vendor samples are capability demonstrations, not a ranking against other libraries.
The Highcharts vs Chart.js comparison examines when commercial licensing justifies cost versus free alternatives.
When licensing can make sense: The required chart, support, distribution, and procurement contract passes, and its total cost is preferable to the ownership carried by another route. Industry labels alone do not establish that result.
TypeScript and framework support: Highcharts publishes TypeScript and framework integration documentation. Exercise the actual wrapper, modules, lifecycle, server-rendering behavior, and types used by the fixture.
Typical use cases:
- Financial services dashboards (trading, portfolio management)
- Healthcare applications with regulatory requirements
- Enterprise BI tools requiring vendor support
- Government projects with procurement requirements
- SaaS products where licensing costs amortize across customers
Avoid Highcharts when:
- Budget constraints prevent commercial licensing
- Open-source requirement exists (organizational policy)
- Another candidate provides the needed features under an acceptable licence
- Prototype or MVP stage (premature licensing commitment)
- Internal tools with lenient failure tolerance
Recharts: React-Native Visualization Library
Recharts targets React developers wanting charts that integrate naturally with React's component model. Built on D3's lower-level utilities but exposing React components, Recharts provides middle ground between D3's complexity and Chart.js's simplicity.
React-first design philosophy: Recharts uses JSX components matching React patterns developers already know. Instead of imperative configuration objects, developers compose charts declaratively using components like <LineChart>, <XAxis>, <Tooltip>, <Legend>.
The what is Recharts article explores React-native benefits. For React projects, Recharts integration feels more natural than libraries requiring wrapper components or useRef management.
Composition model: Recharts charts built by composing smaller components. Want line chart with custom tooltip? Compose <LineChart> with <Line>, <XAxis>, <YAxis>, custom <Tooltip> component. This compositional approach enables customization while maintaining React patterns.
Rendering and update trade-offs: The Recharts project describes declarative React components and native SVG. Measure the resulting element tree, React update path, tooltip work, animation, and responsive container with the real fixture. An SVG implementation cannot be assigned a universal point limit without that context.
Team fit: JSX composition may align with an existing React team's component model. Compare observed implementation, customization, testing, and upgrade work rather than assigning a generic number of learning days.
Chart type coverage: Recharts documents line, bar, area, pie, scatter, radar, and composed chart primitives. Verify the exact chart, interaction, annotation, responsive, and accessibility contract required by the product.
TypeScript support: Recharts is implemented with a TypeScript surface. Validate the props, custom components, event types, and wrapper code the fixture actually uses.
Maintenance evidence: Record the chosen version, release path, issue relevant to the fixture, visual regression strategy, and an internal owner. Community size is context, not acceptance evidence.
Typical use cases:
- React applications requiring chart integration
- Internal admin dashboards in React projects
- Startups with React expertise wanting rapid development
- Projects prioritizing React patterns over extreme customization
- Moderate data volumes with React technology stack
Avoid Recharts when:
- Not using React (framework-agnostic library makes more sense)
- The representative element tree or update path misses its budget
- Real-time updates critical requirement
- Extreme customization required (D3 better choice)
- Performance at scale more important than React integration
ApexCharts: Wrappers, Data Reduction, and a Dual Licence
ApexCharts combines a configuration API, framework wrappers, interactions, accessibility features, and data-reduction controls. Its current commercial boundary must be evaluated alongside the technical fit.
Default presentation: ApexCharts supplies themes, animations, labels, tooltips, and interaction defaults. Evaluate them against the product's design tokens, reduced-motion behavior, accessibility contract, and required customization rather than treating visual taste as a product score.
TypeScript surface: Validate the configuration and wrapper types exercised by the fixture. Type presence is useful, but it is not a comparative quality score.
Feature breadth: ApexCharts documents business, financial, hierarchical, heatmap, mixed-series, annotation, synchronization, and export features. Verify only the exact combination the product needs; catalogue breadth does not prove interoperability among every option.
Performance controls: ApexCharts documents a configurable dataReducer using LTTB with an explicit threshold and target point count. Prototype whether reduction preserves the decisions and anomalies the chart must show, then record render, update, interaction, and memory results on target devices.
Framework compatibility: ApexCharts publishes React, Vue, and Angular wrapper installation paths. Test the selected wrapper's lifecycle, update equality, cleanup, SSR behavior, and version pairing.
Configuration approach: Options and series are supplied through configuration and wrapper props. Compare observed work for the representative fixture instead of an unsupported learning-curve ranking.
Licensing: ApexCharts uses a dual-license model. Its Community Licence is limited by organization and use; Commercial or OEM rights may be required, including for some embedded or configurable products. Obtain written confirmation for ambiguous distribution or product-builder scenarios.
Typical use cases:
- TypeScript projects prioritizing type safety
- Applications where aesthetic polish important
- Workloads whose representative fixture passes with acceptable reduction and interaction
- Business dashboards requiring modern appearance
- Projects whose feature and licence scope both pass review
Avoid ApexCharts when:
- The representative workload misses its acceptance budget
- The required visual cannot be expressed or safely extended
- A smaller API or dependency better fits the required chart
- Native React composition is a stronger requirement than the wrapper route
- Bundle size critical constraint
Real-Time Dashboards Introduce Challenges That Narrow the Library Choice
Real-time dashboards introduce specific technical challenges requiring careful library selection and implementation patterns.
Update frequency considerations: A periodic report and a continuously updating monitor have different acceptance budgets. Define how updates enter the chart, whether data is replaced or appended, which interactions stay active, and what happens under burst, pause, reconnect, and stale-data conditions. Measure the configured implementation rather than assigning performance from the library name.
Data buffering strategies: A screen has finite pixels and a decision has finite context. Bound the live window, aggregate or decimate older data with a documented rule, and provide a separate retrieval path when users need the underlying detail. Test that reduction preserves required peaks, gaps, and anomalies.
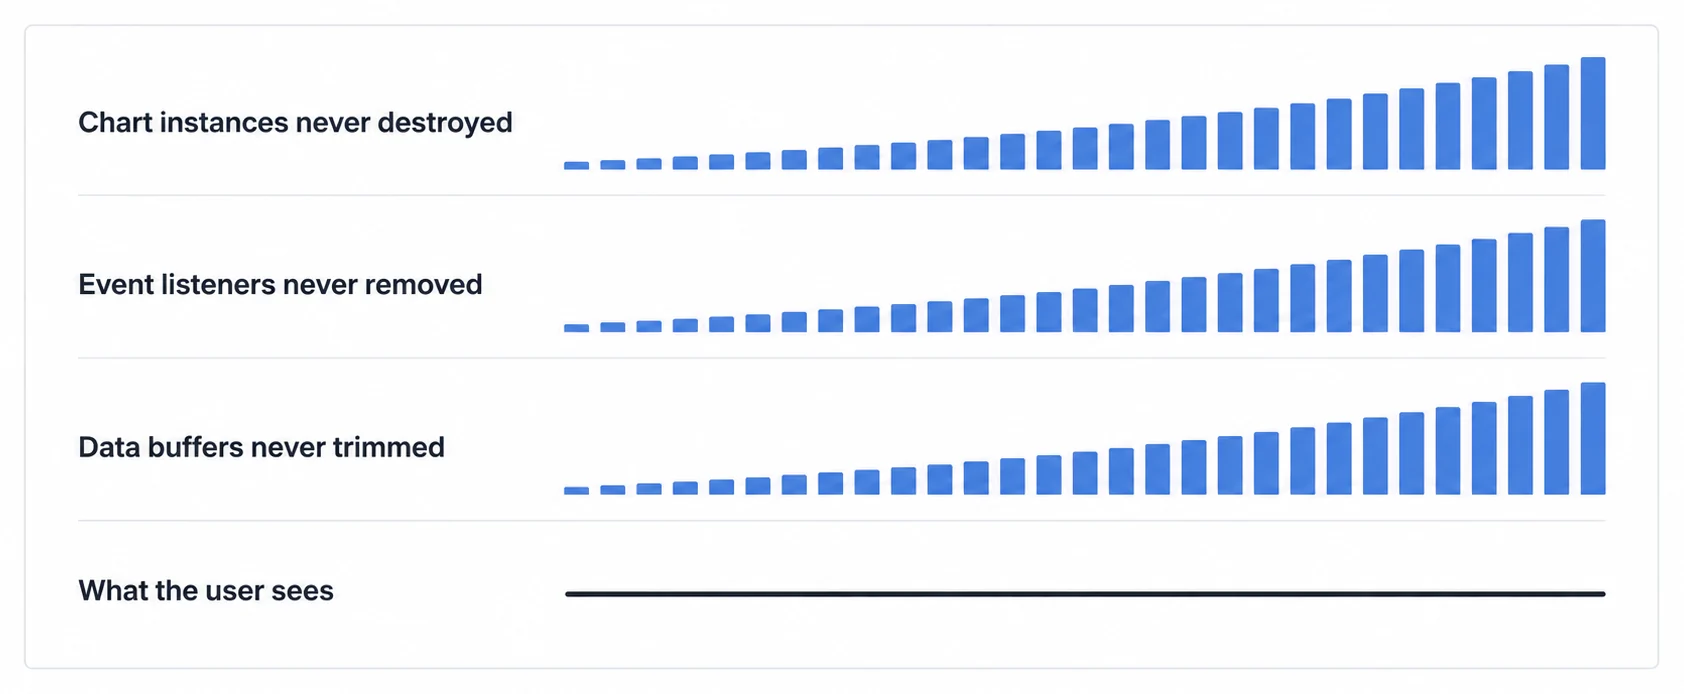
Memory management: Real-time updates create memory leak risk if not handled properly. Chart instances not properly destroyed accumulate in memory. Event listeners not cleaned up continue firing. Data arrays growing unbounded consume memory until crash.
Best practice: Implement cleanup lifecycle. React useEffect cleanup functions. Explicit chart.destroy() calls. Clear references to large data arrays when no longer needed. Monitor memory usage in production using browser Performance API.
Renderer choice: Canvas avoids a DOM node for every mark; SVG exposes an element tree. Either can miss the product budget because data preparation, labels, hit testing, animation, framework updates, and memory also contribute. Test the available renderer paths with the same fixture.
Monitoring performance: Record initial render, update latency, interaction responsiveness, long tasks, memory growth, and recovery after the chart unmounts. Set thresholds from the product's own responsiveness budget and monitor the same metrics after upgrades.
Do not select a library for real-time use from a category label. Test production-shaped data, burst and steady-state updates, interaction, background-tab behavior, reconnect, cleanup, and the target device matrix before architectural commitment.
Charting Libraries Are Building Blocks, Not Complete Analytics Solutions
Strategic positioning for companies embedding analytics in products. JavaScript charting libraries represent building blocks, not complete solutions.
Charting library capabilities: Rendering primitives, chart types, interactions, and framework integration can cover the visualization surface. Implementation effort depends on the representative workflow and the surrounding product contracts.
Missing infrastructure for customer-facing analytics:
Multi-tenant analytics architecture requires trusted identity mapping, tenant authorization, scoped queries and caches, denial tests, and operating evidence. A chart library does not provide that boundary.
Dashboard builder enabling customer customization: drag-drop interface, saved dashboard persistence, metric selection, filtering controls, sharing capabilities, permissions, versioning, and recovery.
White-label capability: custom domains per customer, branded exports, theme customization, complete loading and error states, shared links, emails, and removal of unintended vendor surfaces.
Scheduled reports: automated delivery, artifact generation at scale, tenant and recipient authorization, scheduling, delivery tracking, retries, revocation, and audit.
Security and authentication: identity exchange, tenant and role authorization, row and field scope, direct-link and export controls, rate limits, session expiry, and audit evidence.
Total build estimate: Derive this from a named scope, loaded team cost, representative implementation, infrastructure, security and accessibility review, operations, support, upgrades, and exit work. A universal duration or dollar range is not evidence for a specific team.
B2B SaaS teams can underestimate the contracts beyond rendering. Inventory identity, tenant authorization, data access, authoring, sharing, exports, accessibility, operations, and support before estimating. Use a representative vertical slice to replace assumptions with observed work.
Product reality: Analytics requirements arrive as workflows, permissions, metrics, artifacts, and operating expectations, not merely chart types. Confirm demand from customer evidence and estimate the complete delivery path rather than using competitive pressure as a substitute for scope.
Embedded analytics platforms can provide parts of the data, caching, security, multi-tenancy, white-labeling, authoring, delivery, and SDK integration surface. Verify the exact route, plan, limits, responsibilities, integration work, and exit path against the same requirements used for a build case.
Hybrid approach: A platform can own part of the analytics service while the application owns selected custom visualizations. Verify data and identity flow, design consistency, accessibility, export behavior, event integration, upgrades, support ownership, and commercial rights across the seam.
The platform versus library question often frames as either/or. Reality: platforms can incorporate custom chart libraries. The question is scope of build effort. Libraries build visualization layer. Platforms build complete embedded analytics stack. Choose based on actual requirements, not false dichotomy.
Decision framework: A chart library may be sufficient when the application already owns every surrounding contract. A platform evaluation becomes relevant when the team wants another system to carry some of those contracts. Compare the same scope and include loaded internal time even when it is not invoiced separately.
For customer-facing analytics, compare a production-shaped build slice and platform slice under the same scope, workload, reliability, commercial term, internal ownership, and exit assumptions. Either route can win; the evidence should decide.
Ready to launch customer-facing analytics?
Stop losing customers to competitors with better analytics. Sumboard's customer-facing analytics platform lets you launch self-service dashboards in days, not months.